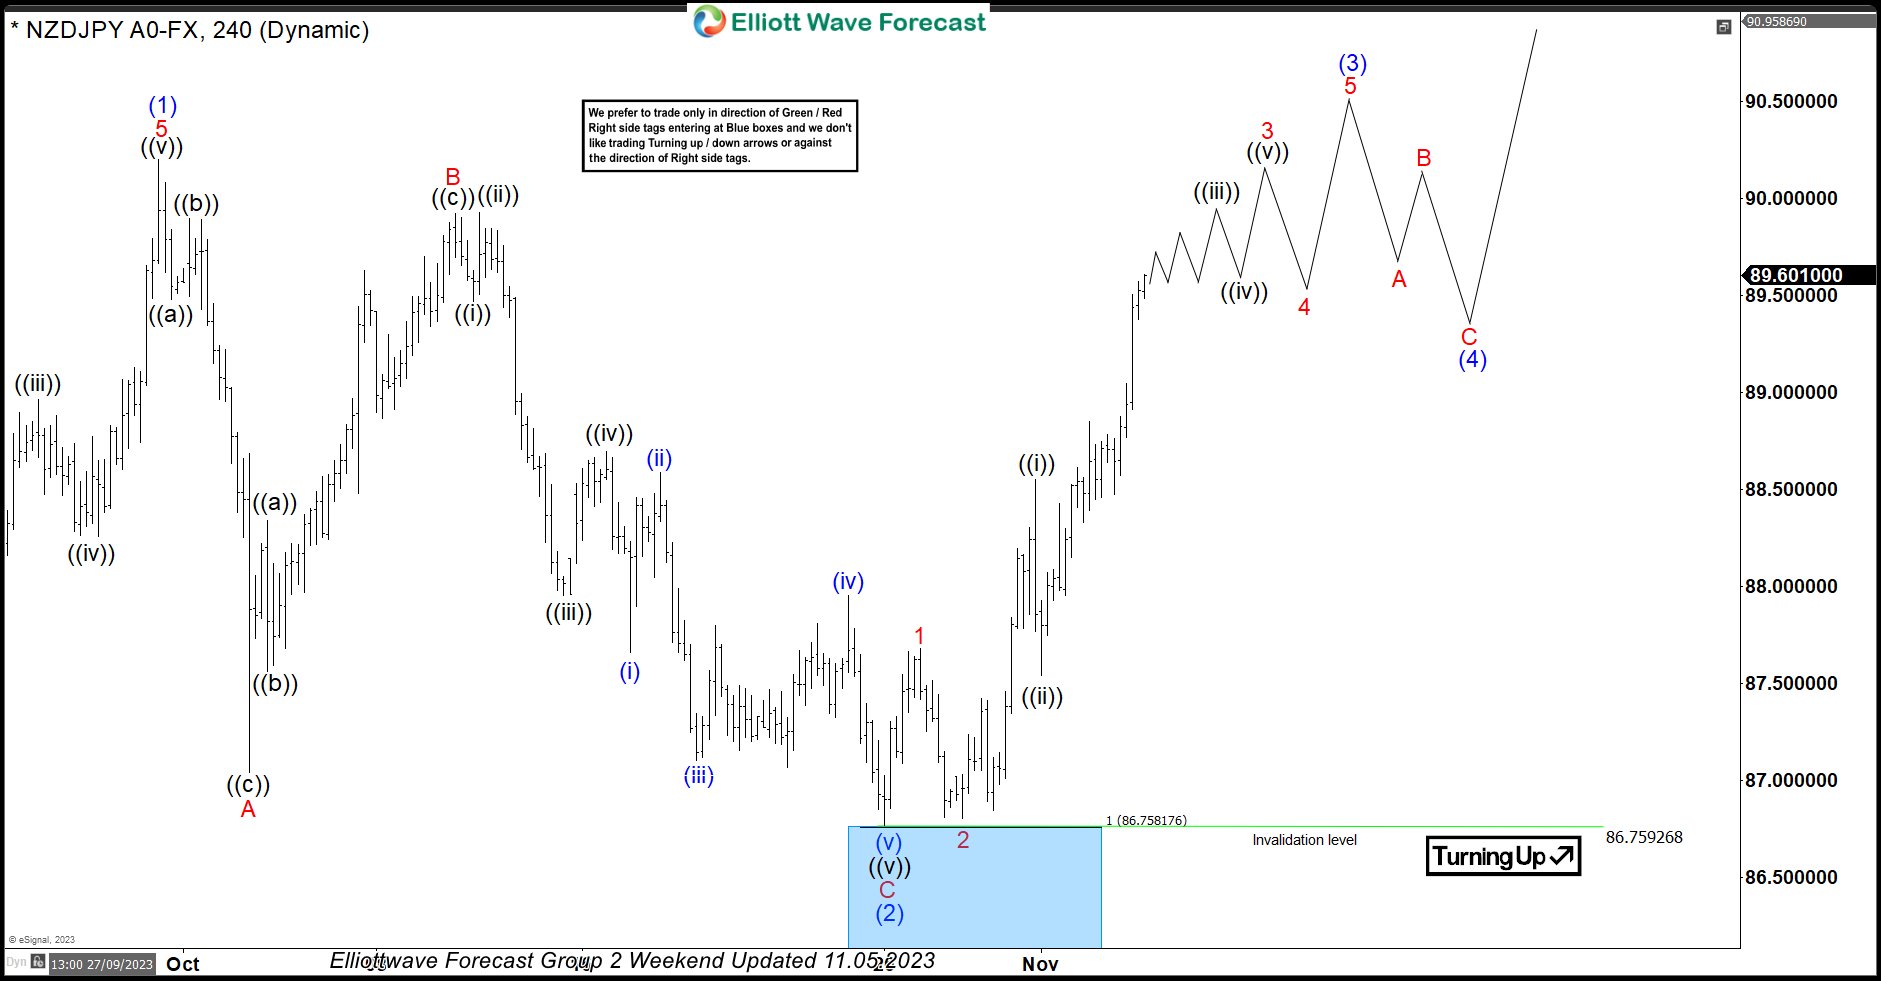

In this technical blog, we will look at the past performance of the 4-hour Elliott Wave Charts of NZDJPY. In which, the rally from 24 March 2023 low unfolded as an impulse sequence and showed a higher high sequence. Therefore, we knew that the structure in NZDJPY is incomplete to the upside & should extend higher. So, […]
-

AUDUSD Trading Update – Before and After the FOMC
Read MoreHere is a quick blog from our Live Trading Room host, Dan Hussey. Take a look at how to manage your risk by using inflection zones and Elliot Wave to your advantage. The Live Trading Room is held daily from 12:30 PM EST (5:30 PM BST), join Dan there for more insight into these proven methods of trading. AUDUSD 240m Before […]
-

USDJPY 240m Technical’s and Trade Plan Update
Read MoreHere is a quick blog from our Live Trading Room host, Dan Hussey. Take a look at how to manage your risk by using inflection zones and Elliot Wave to your advantage. The Live Trading Room is held daily from 12:30 PM EST (5:30 PM BST), join Dan there for more insight into these proven methods of trading. USDJPY […]
-

Double Three Structure in EURGBP
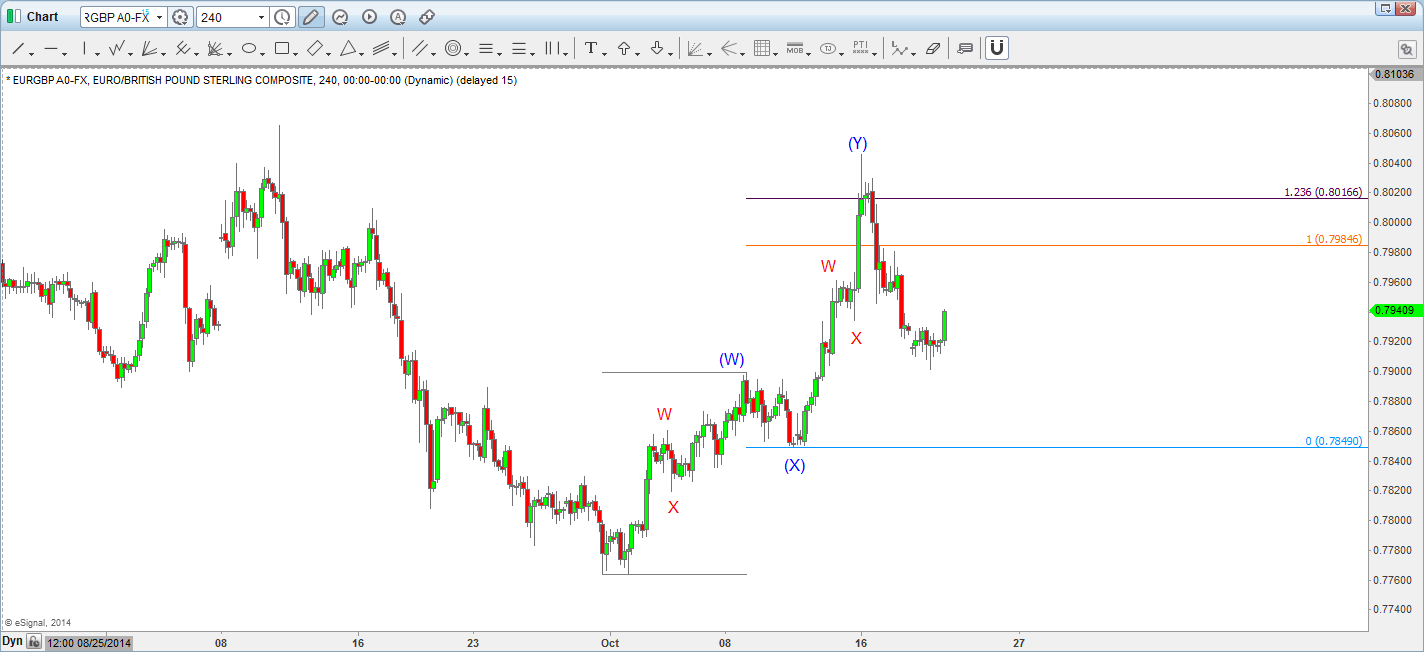
Read MoreEUR/GBP is a pair that moves nearly all in corrective sequence of double three (WXY) or triple three (WXYXZ). That makes the pair to be very predictable and a pair to look for high probability setups. In this blog, we will take a look at how to trade a double corrective Elliott Wave Structure Double three structure […]
-

Symmetrical Triangle in GBP/JPY
Read MoreTriangles pattern occur quite frequently in the market, and it’s one of the best patterns to trade. In this blog, we are going to take a look at how to trade the triangle pattern. There are 8 different types of triangles, as can be seen in the chart below: In this blog, we will take a look […]
-

EURGBP bounce expected to fail after 7 swings
Read MorePreferred Elliott Wave view suggests decline from 0.8065 – 0.7764 was a triple three (WXYZ) structure and completed wave ( A ). Wave ( B ) is in progress and taking the form of 7 swings structure. Wave “W” ended at 0.7860 and dip to 0.7817 was wave “X”. Pair has already made a new […]
-

GBPUSD: Elliott Waves forecasting the path from 9.16.2014
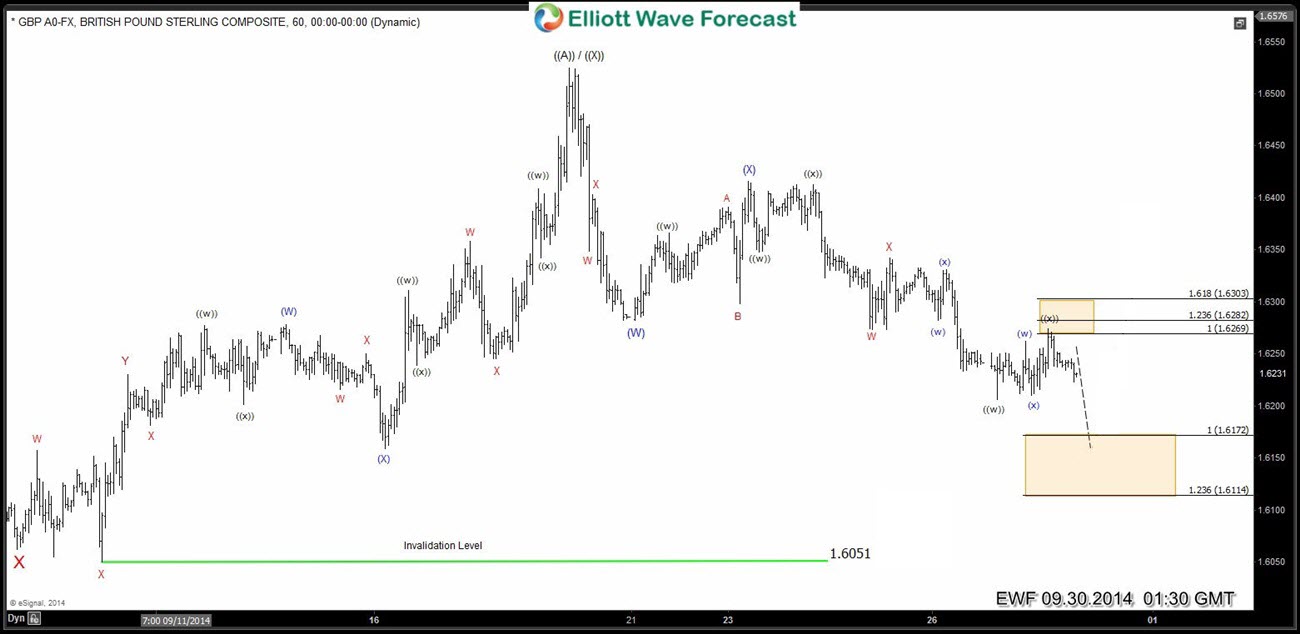
Read MoreAt the middle of September our Elliott Wave analysis for GBPUSD suggested that cycle from the 1.6062 low isn’t completed at 1.6278 , just only the first leg W. The price had given us decline in wave X and reached our potential reversal area. Another 3 wave rally from marked zone 1.6170-1.6145 was expected. Let’s […]