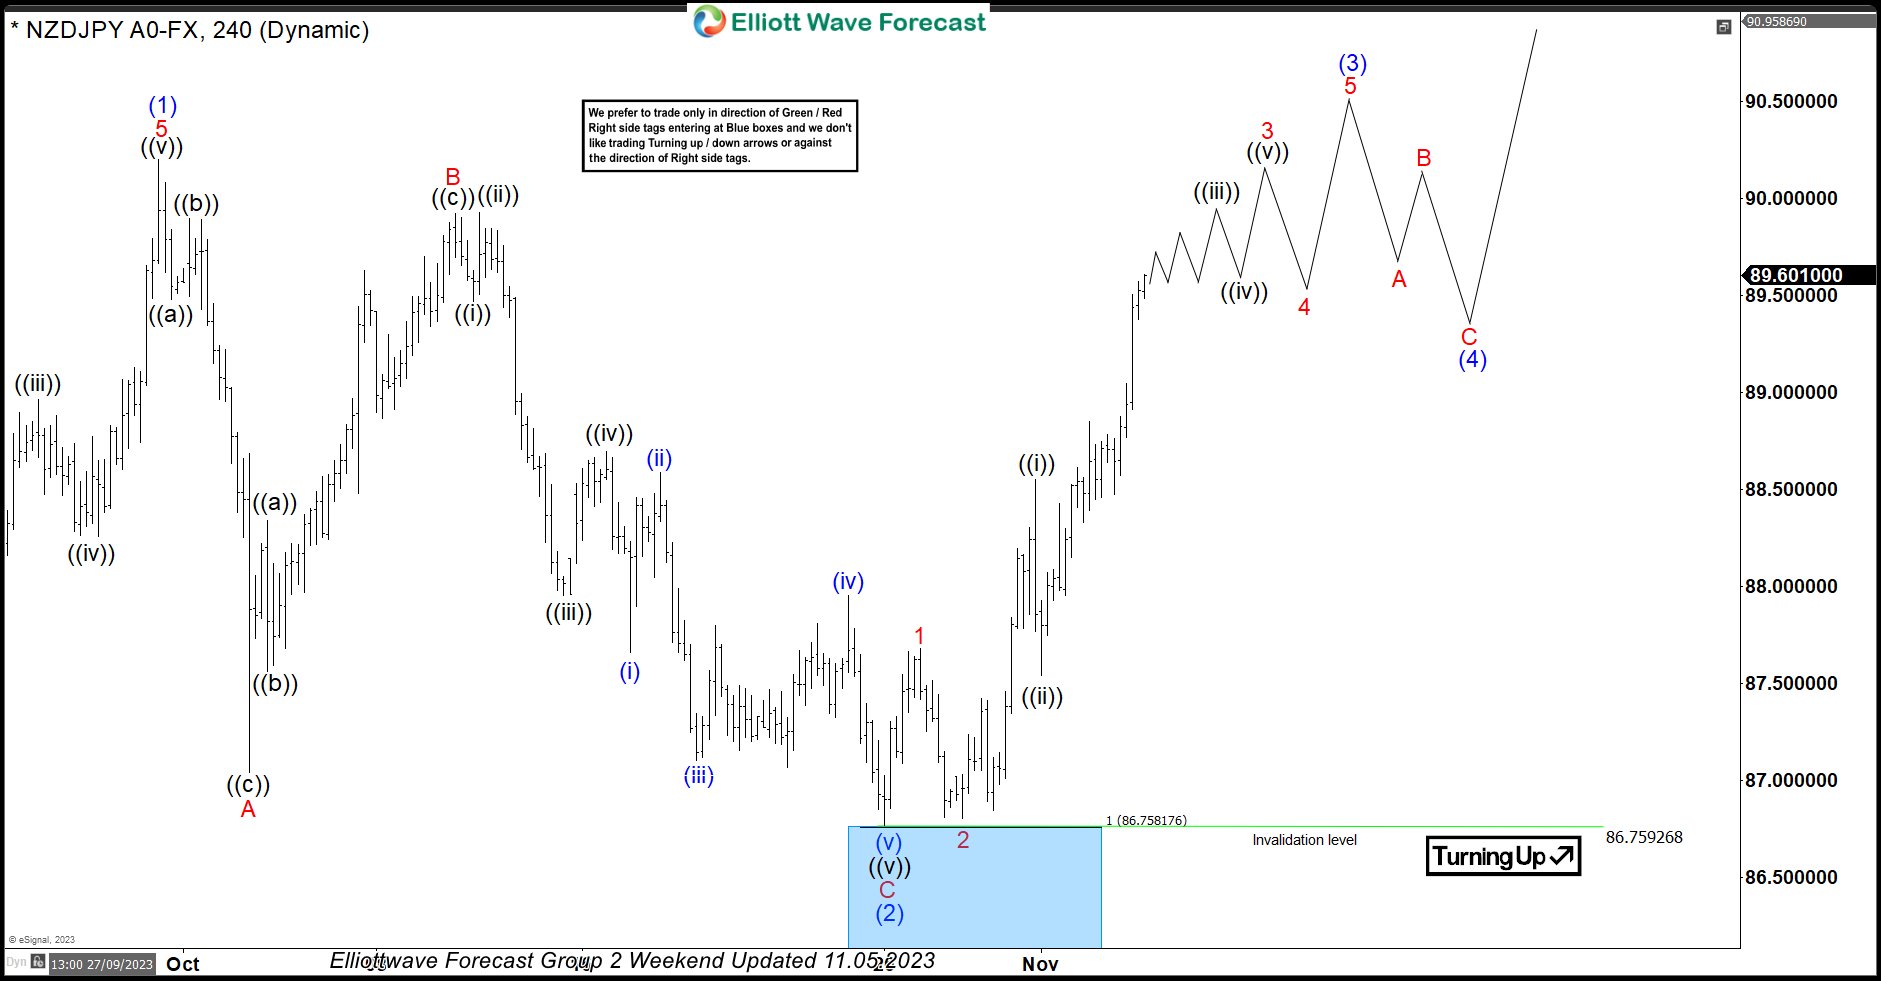

In this technical blog, we will look at the past performance of the 4-hour Elliott Wave Charts of NZDJPY. In which, the rally from 24 March 2023 low unfolded as an impulse sequence and showed a higher high sequence. Therefore, we knew that the structure in NZDJPY is incomplete to the upside & should extend higher. So, […]
-

USDJPY 240m Trade Plan and Technical Update
Read MoreHere is a quick blog from our Live Trading Room host, Dan Hussey. Take a look at how to manage your risk by using inflection zones and Elliot Wave to your advantage. The Live Trading Room is held daily from 12:30 PM EST (5:30 PM BST), join Dan there for more insight into these proven methods of trading. USDJPY […]
-

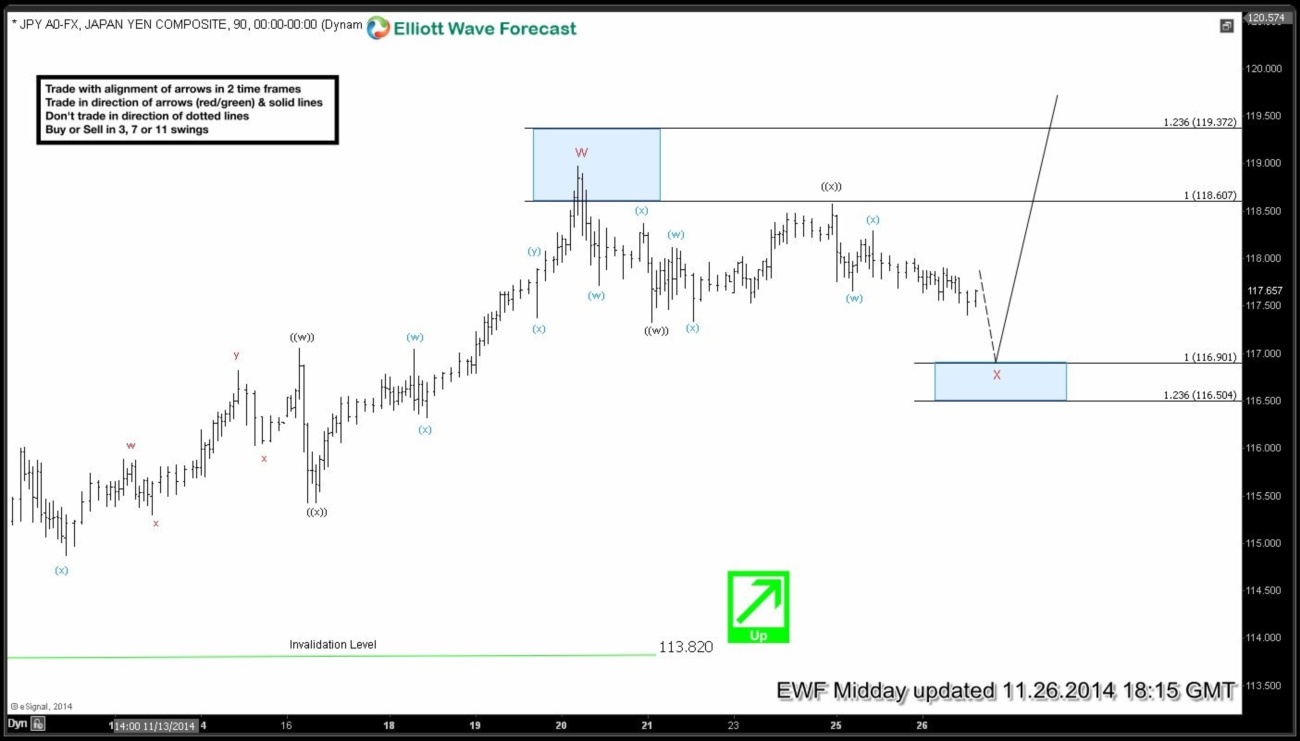
USDJPY Short-term Elliott Wave Analysis 11.26.2014
Read MoreDaily cycle in the pair is very stretched and a decent pull back could start at any moment but there is no confirmation yet that daily cycle has ended so trading strategy in the shorter cycles is still to buy the dips in the sequence of 3, 7 and 11 swings. Pair has already done […]
-

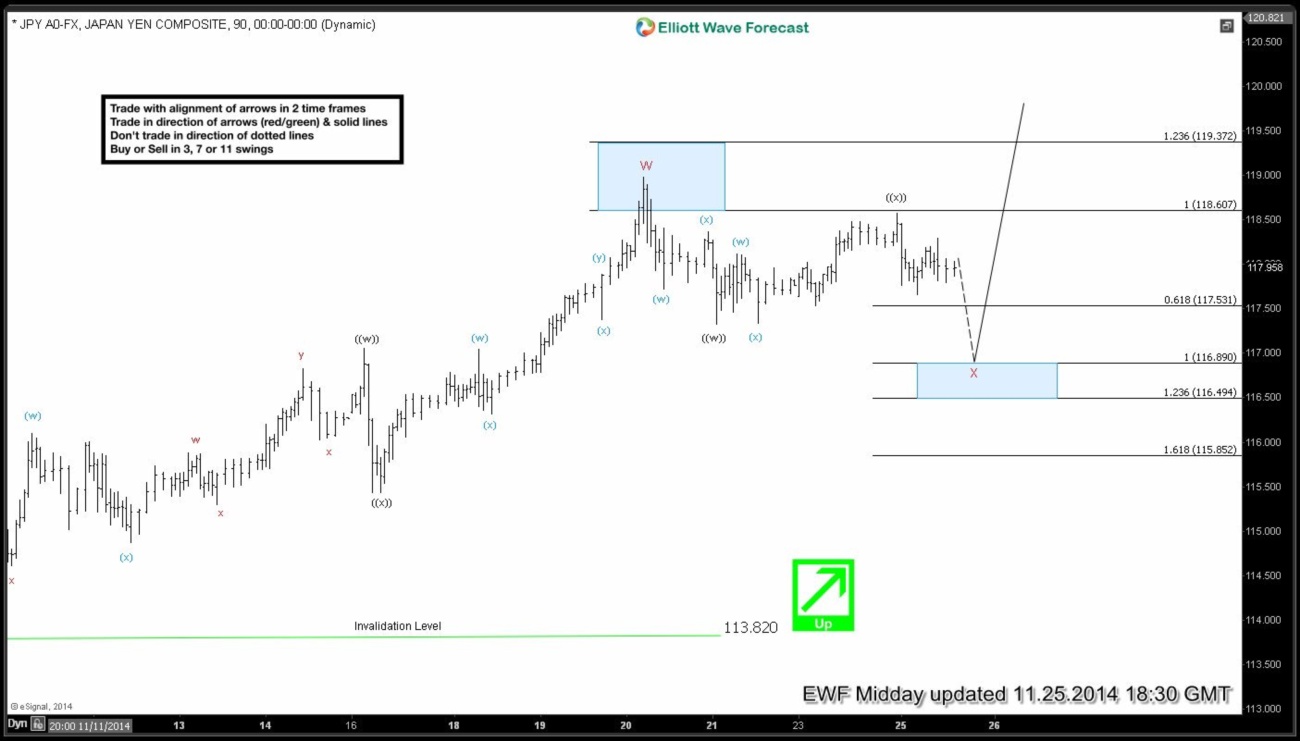
USDJPY Short-term Elliott Wave Analysis 11.25.2014
Read MoreDaily cycle in the pair is very stretched and a decent pull back could start at any moment but there is no confirmation yet that daily cycle has ended so trading strategy ns the shorter cycles is still to buy the dips in the sequence of 3, 7 and 11 swings. Pair has already done […]
-

USDJPY Elliott Wave Setup Video
Read MoreWe take a look at USDJPY in today’s video. Daily cycle in the pair is very stretched and a decent pull back could start at any moment but there is no confirmation yet that daily cycle has ended so trading strategy in the shorter cycles is still to buy the dips in the sequence of […]
-

Elliott Wave Forecasts : $Dollar pairs before & after FOMC
Read MoreEWF has proven one more time that market news events are insignificant for making good trade decisions. As our members know, we do not follow the news, because further paths are already defined in the price structure. All EWF analysis are based strictly on technical stuff, such as Elliott wave cycles, pivot system and market corelation,as […]
-

USDCHF Short-term Elliott Wave Analysis 10.29.2014
Read MoreUSDCHF held 0.9447 – 0.9429 inflection area as expected & has shown a strong reaction higher. Traders long from inflection area should already be in a risk free position. New high above 0.9560 would make it 5 swings up from 0.9356 low moving invalidation higher to 0.9438. Ideal area for 5th swing to end is […]