
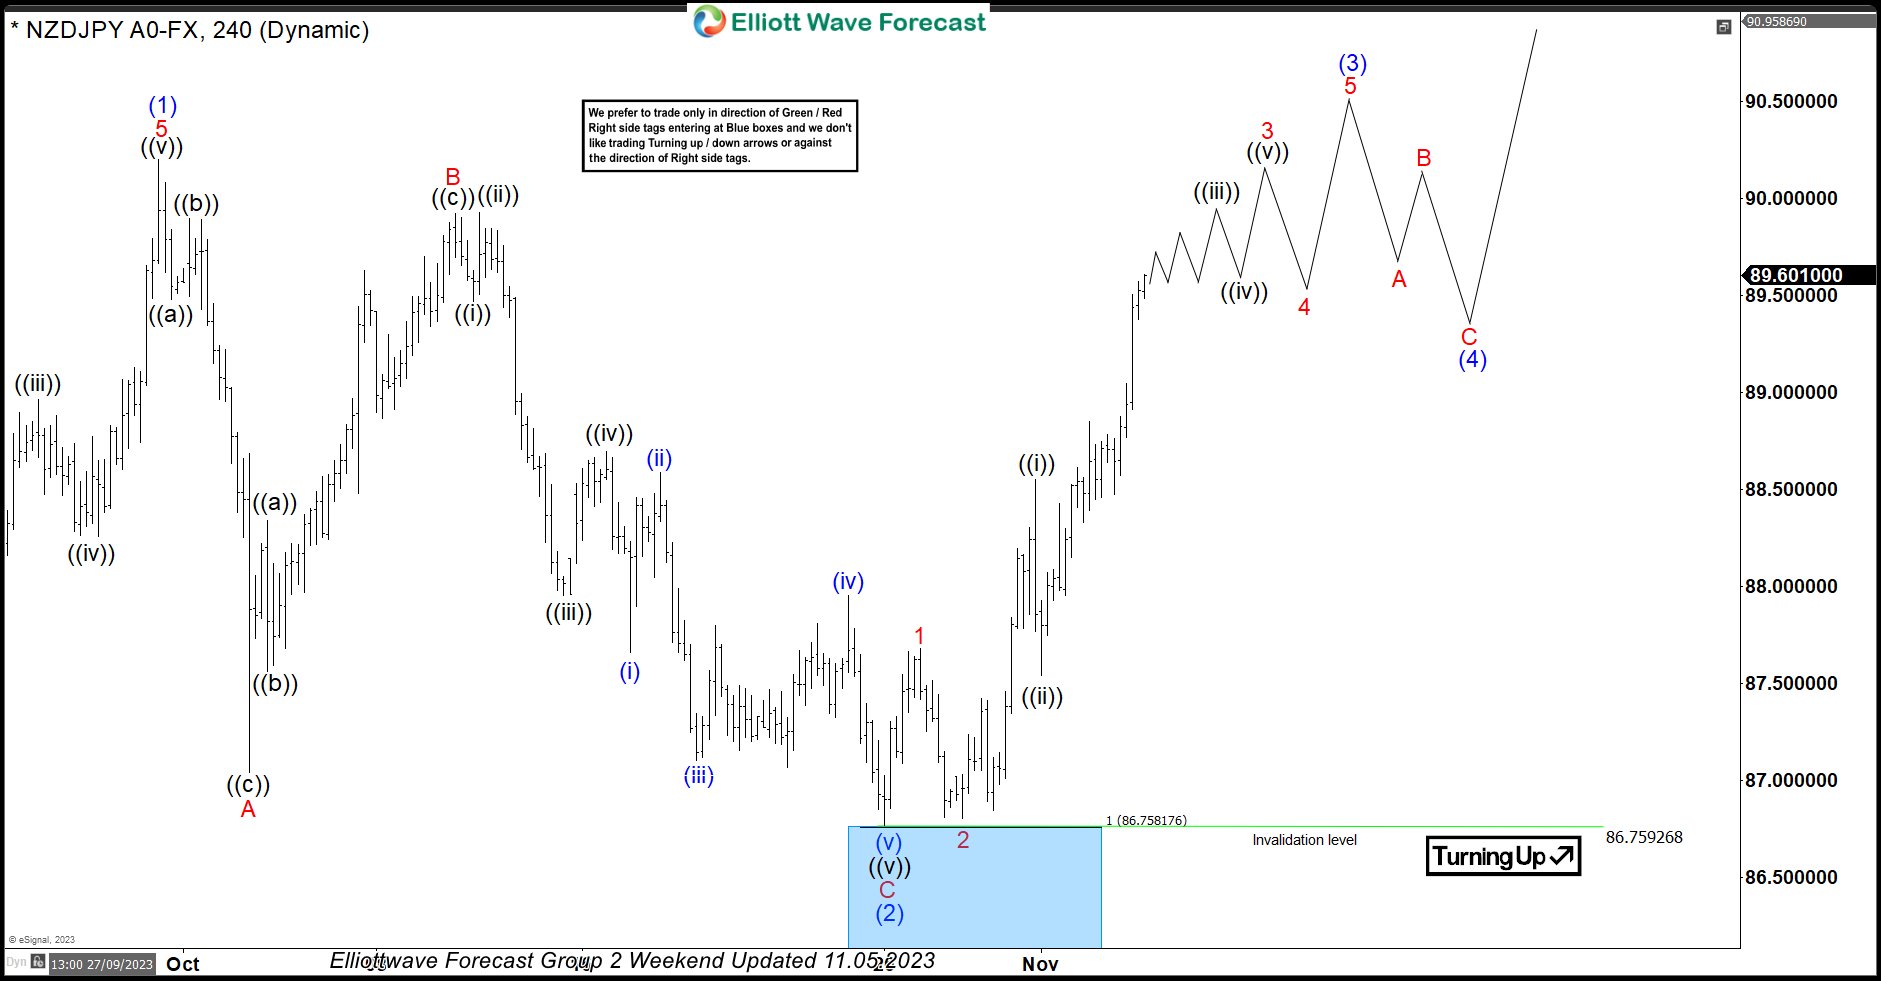
In this technical blog, we will look at the past performance of the 4-hour Elliott Wave Charts of NZDJPY. In which, the rally from 24 March 2023 low unfolded as an impulse sequence and showed a higher high sequence. Therefore, we knew that the structure in NZDJPY is incomplete to the upside & should extend higher. So, […]
-

USDJPY Elliott Wave Video 2.10.2015
Read MoreUSDJPY broke sideways range to the upside last week. We think pair is ending an Elliott wave cycle from 2/2 low and also from 1/16 low. Sideways consolidation in USDJPY is popularly believed to be a bullish Elliott wave triangle but momentum indicators are not supporting the bullish triangle view, it could still be a […]
-
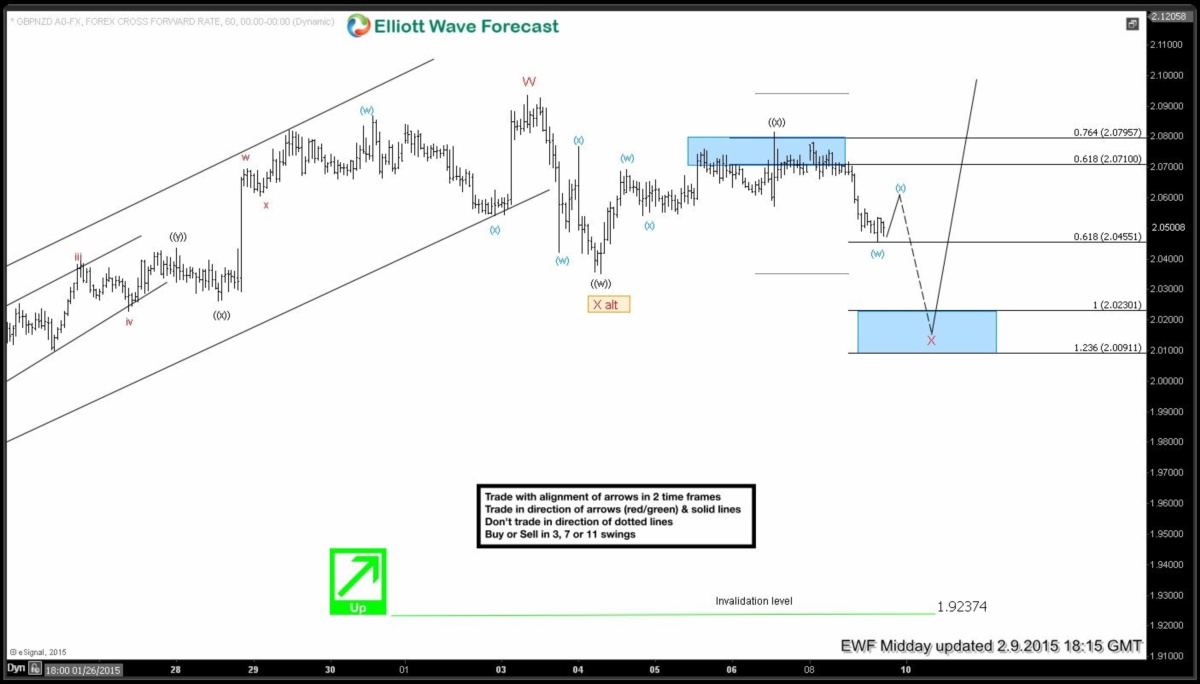
GBPNZD Short-term Elliott Wave Analysis 2.9.2015
Read MorePreferred Elliott Wave view suggests pair has ended a cycle from 1.9237 low as a triple three structure at 2.0935. We have labelled this wave “W” and a pull back in wave “X” is now in progress as a double three Elliott wave structure or a (( w )) – (( x)) – (( y […]
-

EURGBP Elliott Wave Setup Video
Read MoreOur mid-term Elliott Wave cycles remain firmly bearish in EURGBP. Pair tested the inflection area between 0.7591 – 0.7618, got rejected and turned lower as expected. Cycle from the lows is over so connector wave (( X )) is thought to be in place at 0.7591. Pair could test 0.7465 – 0.7449 area to finish […]
-
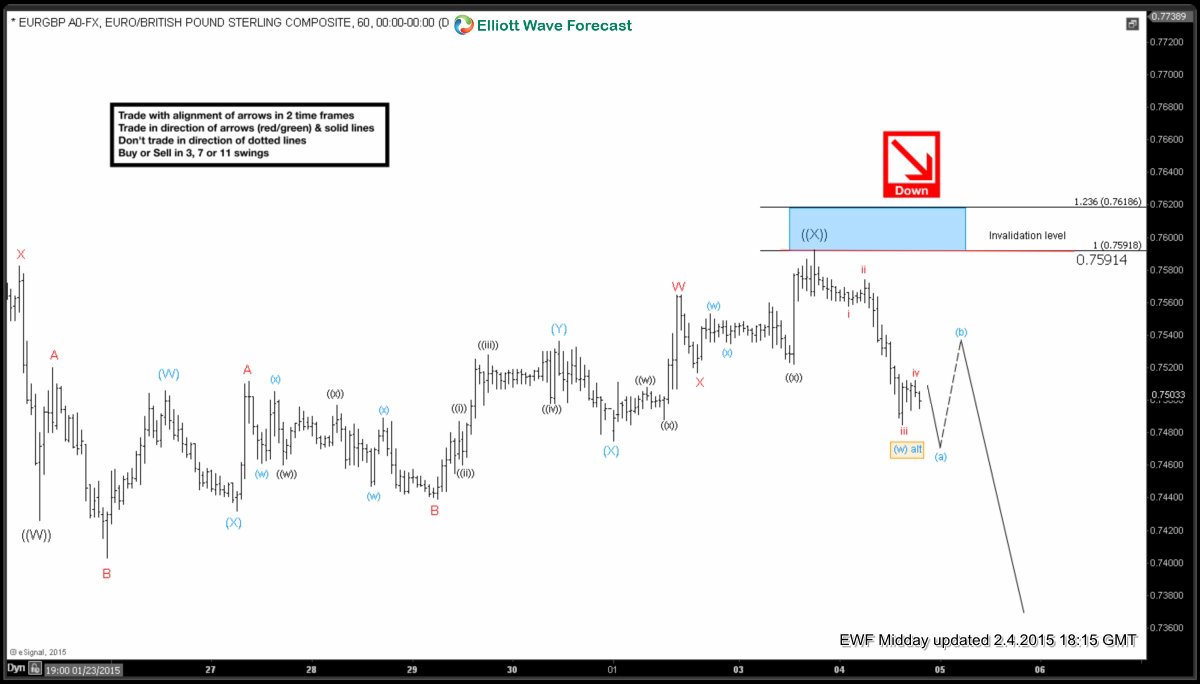
EURGBP Short-term Elliott Wave Analysis 2.4.2015
Read MoreOur mid-term Elliott Wave cycles remain firmly bearish in EURGBP. Pair tested the inflection area between 0.7591 – 0.7618, got rejected and turned lower as expected. Cycle from the lows is over so connector wave (( X )) is thought to be in place at 0.7591. Decline from this high is so far in 3 […]
-

EURGBP Short-term Elliott Wave Analysis 1.26.2015
Read MorePreferred Elliott wave view suggests wave (W) ended at 0.7593 and wave (X) ended @ 0.7714. Wave “W” is proposed to be over at 0.7403. Wave “X” bounce is in progress & could reach as high as 0.7558 – 0.7597 (50 – 61.8 fib) area before decline resumes. We don’t like buying the pair & expect sellers to keep […]
-
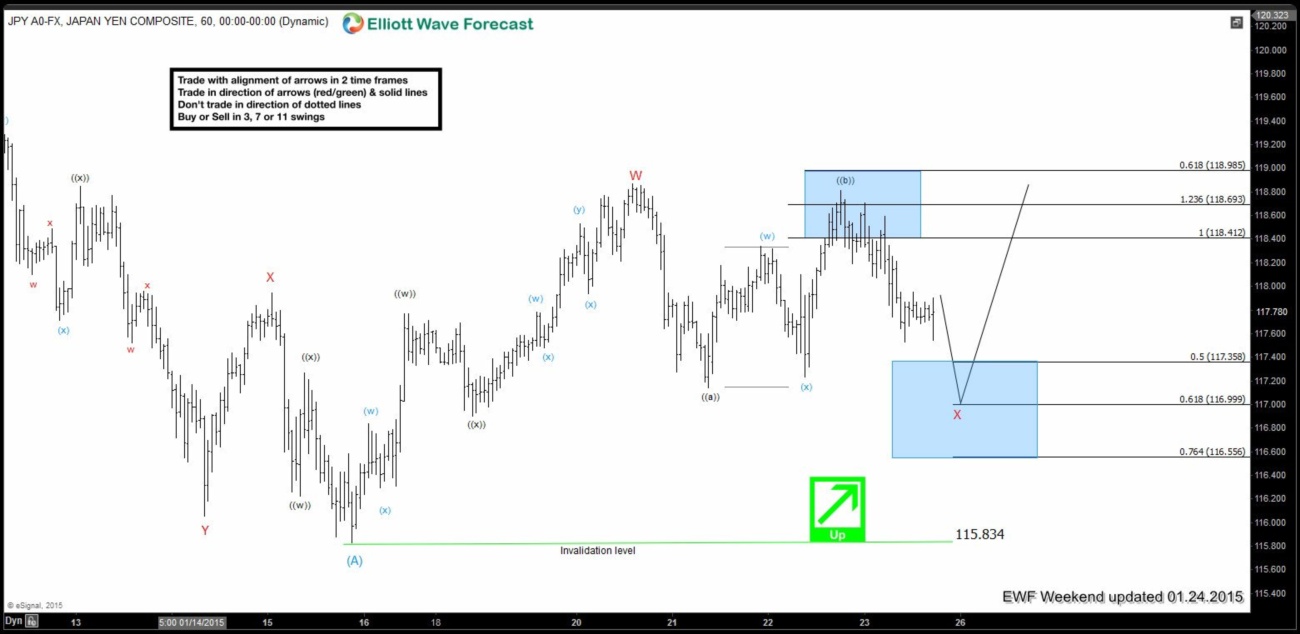
USDJPY Short-term Elliott Wave Analysis 1.24.2015
Read MorePreferred Elliott Wave view is the dips in the pair should hold above 115.82 low for continuation higher. We think wave “W” ended at 118.83, wave “X” pull back is in progress & could test 116.99 – 116.56 area before pair turns higher in the next leg. We don’t like selling the pair as there is no […]