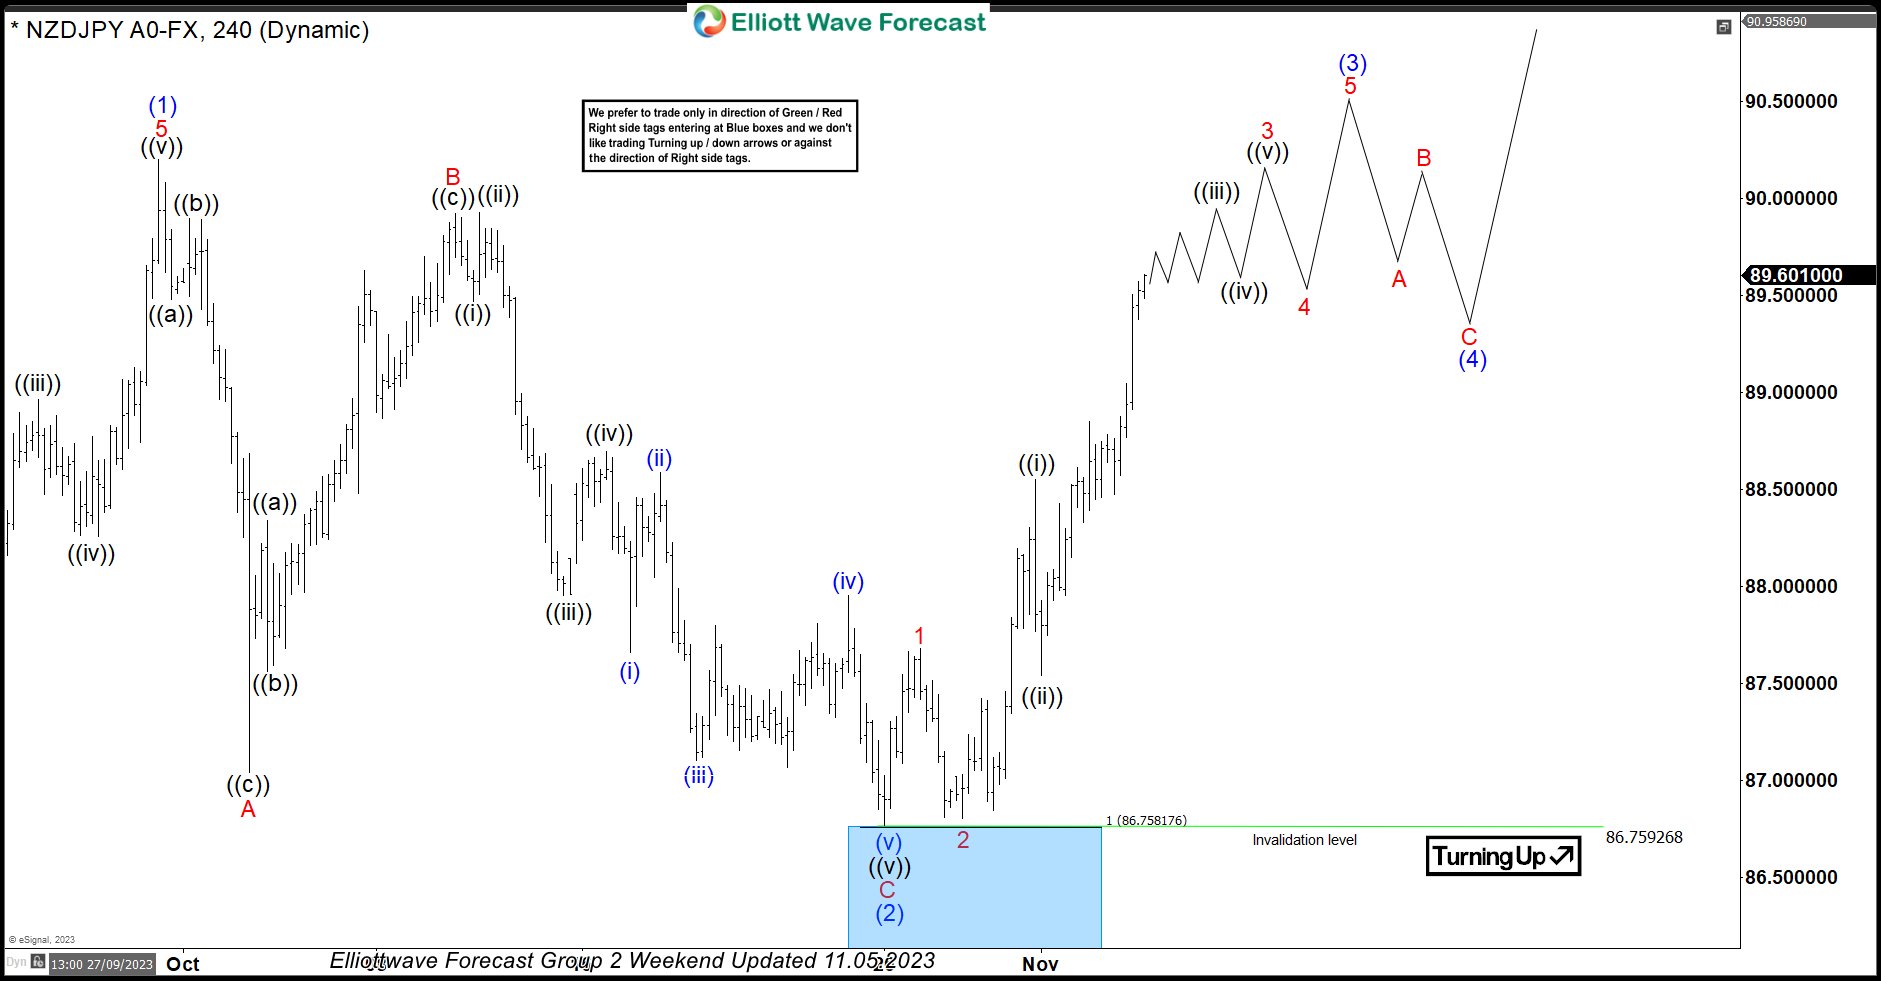

In this technical blog, we will look at the past performance of the 4-hour Elliott Wave Charts of NZDJPY. In which, the rally from 24 March 2023 low unfolded as an impulse sequence and showed a higher high sequence. Therefore, we knew that the structure in NZDJPY is incomplete to the upside & should extend higher. So, […]
-

NZDUSD Live Trading Room – Trading Plan Recap
Read MoreHere is a quick blog from our Live Trading Room host, Dan Hussey. Take a look at how to manage your risk by using inflection zones and Elliot Wave to your advantage. The Live Trading Room is held daily from 12:30 PM EST (5:30 PM BST), join Dan there for more insight into these proven methods of trading. NZD/USD […]
-

USDJPY Live Trading Room – Trading Plan Recap
Read MoreHere is a quick blog from our Live Trading Room host, Dan Hussey. Take a look at how to manage your risk by using inflection zones and Elliot Wave to your advantage. The Live Trading Room is held daily from 12:30 PM EST (5:30 PM BST), join Dan there for more insight into these proven methods of trading. USDJPY […]
-

GBPUSD Live Trading Room – Trade Plan Recap
Read MoreHere is a quick blog from our Live Trading Room host, Dan Hussey. Take a look at how to manage your risk by using inflection zones and Elliot Wave to your advantage. The Live Trading Room is held daily from 12:30 PM EST (5:30 PM BST), join Dan there for more insight into these proven methods of trading. GBPUSD […]
-

NZDCAD Long Term Elliott Wave Analysis 5.30.2015
Read MoreBelow are weekly and daily Elliott Wave analysis on $NZD/CAD, a pair that is not part of the 42 instrument currently covered by EWF, but the same Elliott Wave Principle and technique will be applied to analyze the pair. After watching the videos and reading the commentary below, if you are interested to learn more about Elliott Wave or how we […]
-

$AUD/USD Short Term Elliott Wave Analysis 5.29.2015
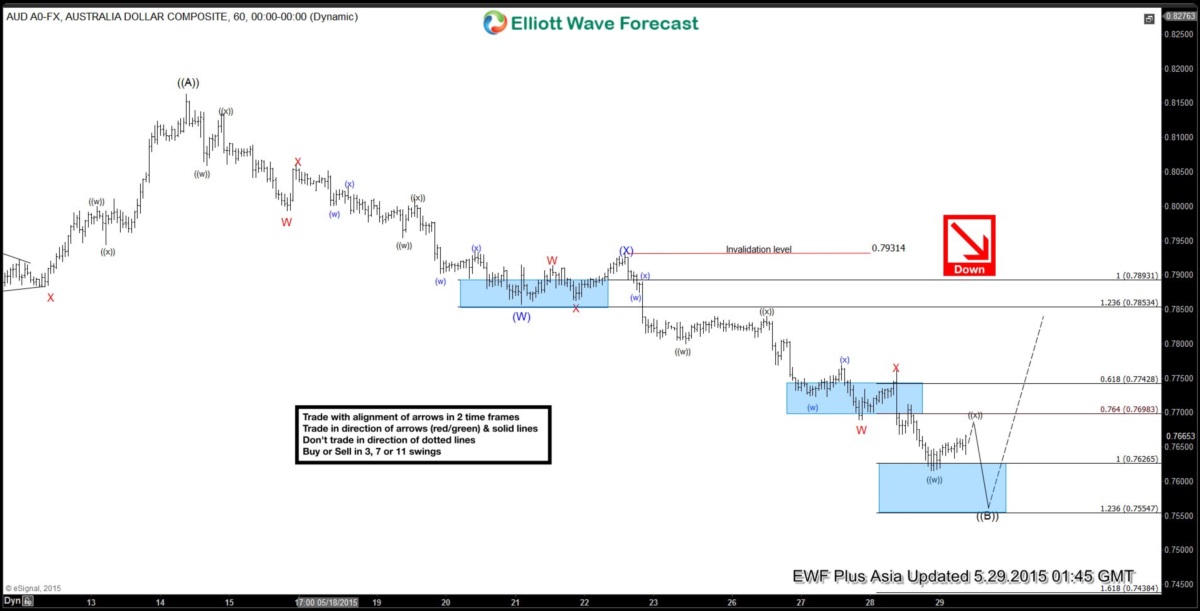
Read MoreCurrent preferred Elliottwave view suggests rally towards 0.8163 completed wave ((A)). Wave ((B)) decline from 0.8163 is unfolding in the form of a double correction (W)-(X)-(Y) where wave (W) ended at 0.7857, wave (X) ended at 0.7931, and wave (Y) is in progress towards 0.7554 – 0.7627 equal leg area. If the pair makes equal leg from […]
-

$AUD/CAD Long Term Elliott Wave Analysis 5.27.2015
Read MoreBelow are weekly and daily Elliott Wave analysis on $AUD/CAD, a pair that is not part of the 42 instrument currently covered by EWF, but the same Elliott Wave Principle and technique will be applied to analyze the pair. The same analysis is also available in written format at our technical blog. After watching the videos below, if you are interested to learn […]