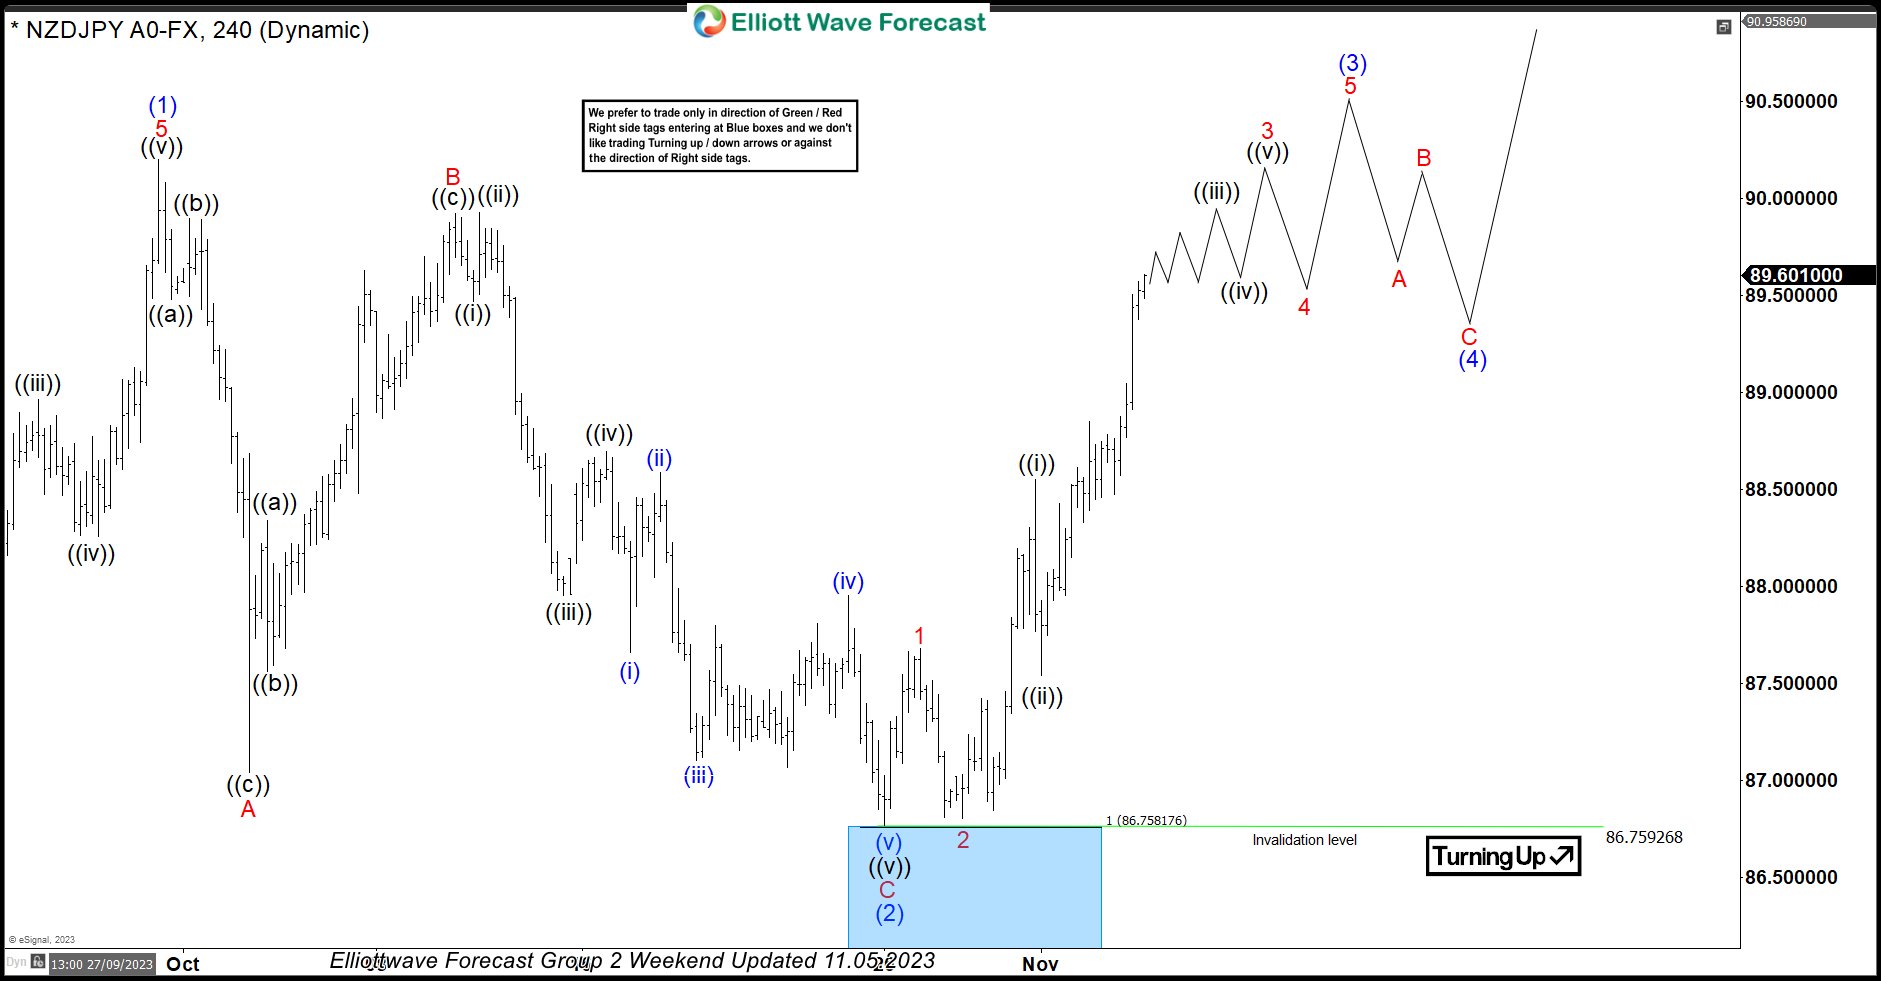

In this technical blog, we will look at the past performance of the 4-hour Elliott Wave Charts of NZDJPY. In which, the rally from 24 March 2023 low unfolded as an impulse sequence and showed a higher high sequence. Therefore, we knew that the structure in NZDJPY is incomplete to the upside & should extend higher. So, […]
-

$EURJPY: EWF Forecasting the decline and selling the rally
Read MoreAnother instrument which has given us nice trading opportunity is EURJPY. As we forecasted,the pair reached important technical area at 139.849-139.924 that was marked as Red Box on EWF charts (Red Box presents sell recommendation). Now, let’s take a quick look at H4 charts from 8.9.2015. $EURJPY H4 Weekend Update 8.9.2015 The chart suggests the pair is […]
-

EURCAD Medium Term Elliottwave Analysis 9.9.2015
Read MoreThis is a medium term Elliott Wave Analysis video update on $EUR/CAD. The pair is currently in wave (X) pullback and once complete, it is likely to turn higher one more leg later. We currently cover 42 instrument ranging from forex, indices, and commodities in 4 different time frames. Welcome to check our service and see if […]
-

AUDJPY Short Term Elliott Wave Analysis 9.8.2015
Read MoreDecline from wave ((X)) at 87.33 is unfolding as a double correction ((w))-((x))-((y)) where wave ((w)) ended at 83.61, wave ((x)) ended at 85.11, and wave ((y)) of W is in progress towards 80.55 – 81.43 before a larger bounce in wave X and then lower again. Near term, wave (x) bounce is in progress […]
-

$AUDJPY:EWF forecasting the decline and selling the rallies
Read MoreDuring the summer of 2015. EWF members knew that AUDJPY was in bearish cycle from the 97.255 high, that was looking for further decline toward our target area : 83.814-80.642. AUDJPY has had one of the clearest structures during that period. Let’s take a quick look at Elliott Wave charts from the 27.July 2015. to […]
-

AUDNZD Medium Term Elliottwave Analysis 9.2.2015
Read MoreThis is a medium term Elliott Wave Analysis video update on $AUD/NZD. Medium term, we like to see more upside in the pair after the pullback is complete. We currently cover 42 instrument ranging from forex, indices, and commodities in 4 different time frames. Welcome to check our service and see if we can add value to […]
-

AUDCAD Medium Term Elliottwave Analysis 8.25.2015
Read MoreThis is a medium term Elliott Wave Analysis video update on $AUD/CAD. After being sideways for months, the pair is showing an encouraging sign yesterday by making a new low. Wait to see 0.94 support to fail for a possible move to the downside. We currently cover 42 instrument ranging from forex, indices, and commodities in 4 different time frames. Welcome […]