
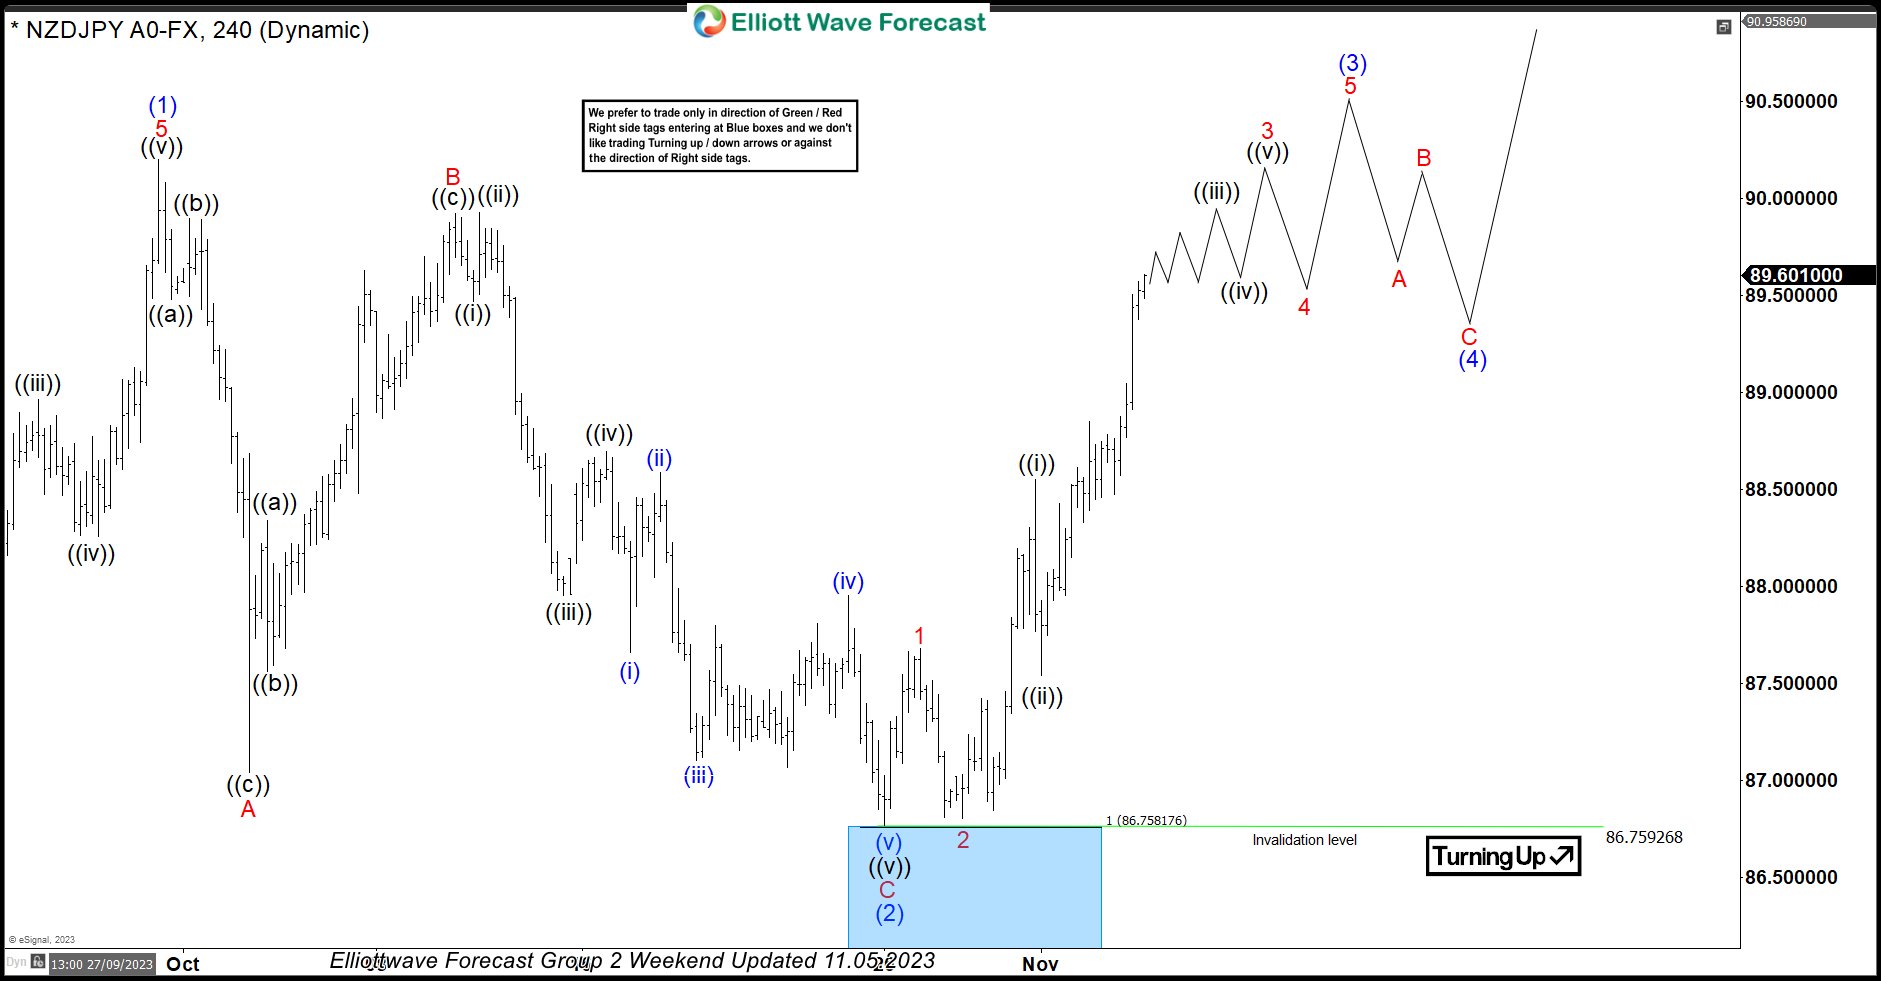
In this technical blog, we will look at the past performance of the 4-hour Elliott Wave Charts of NZDJPY. In which, the rally from 24 March 2023 low unfolded as an impulse sequence and showed a higher high sequence. Therefore, we knew that the structure in NZDJPY is incomplete to the upside & should extend higher. So, […]
-
Elliott Wave Analysis: USDJPY Correcting in Flat Structure
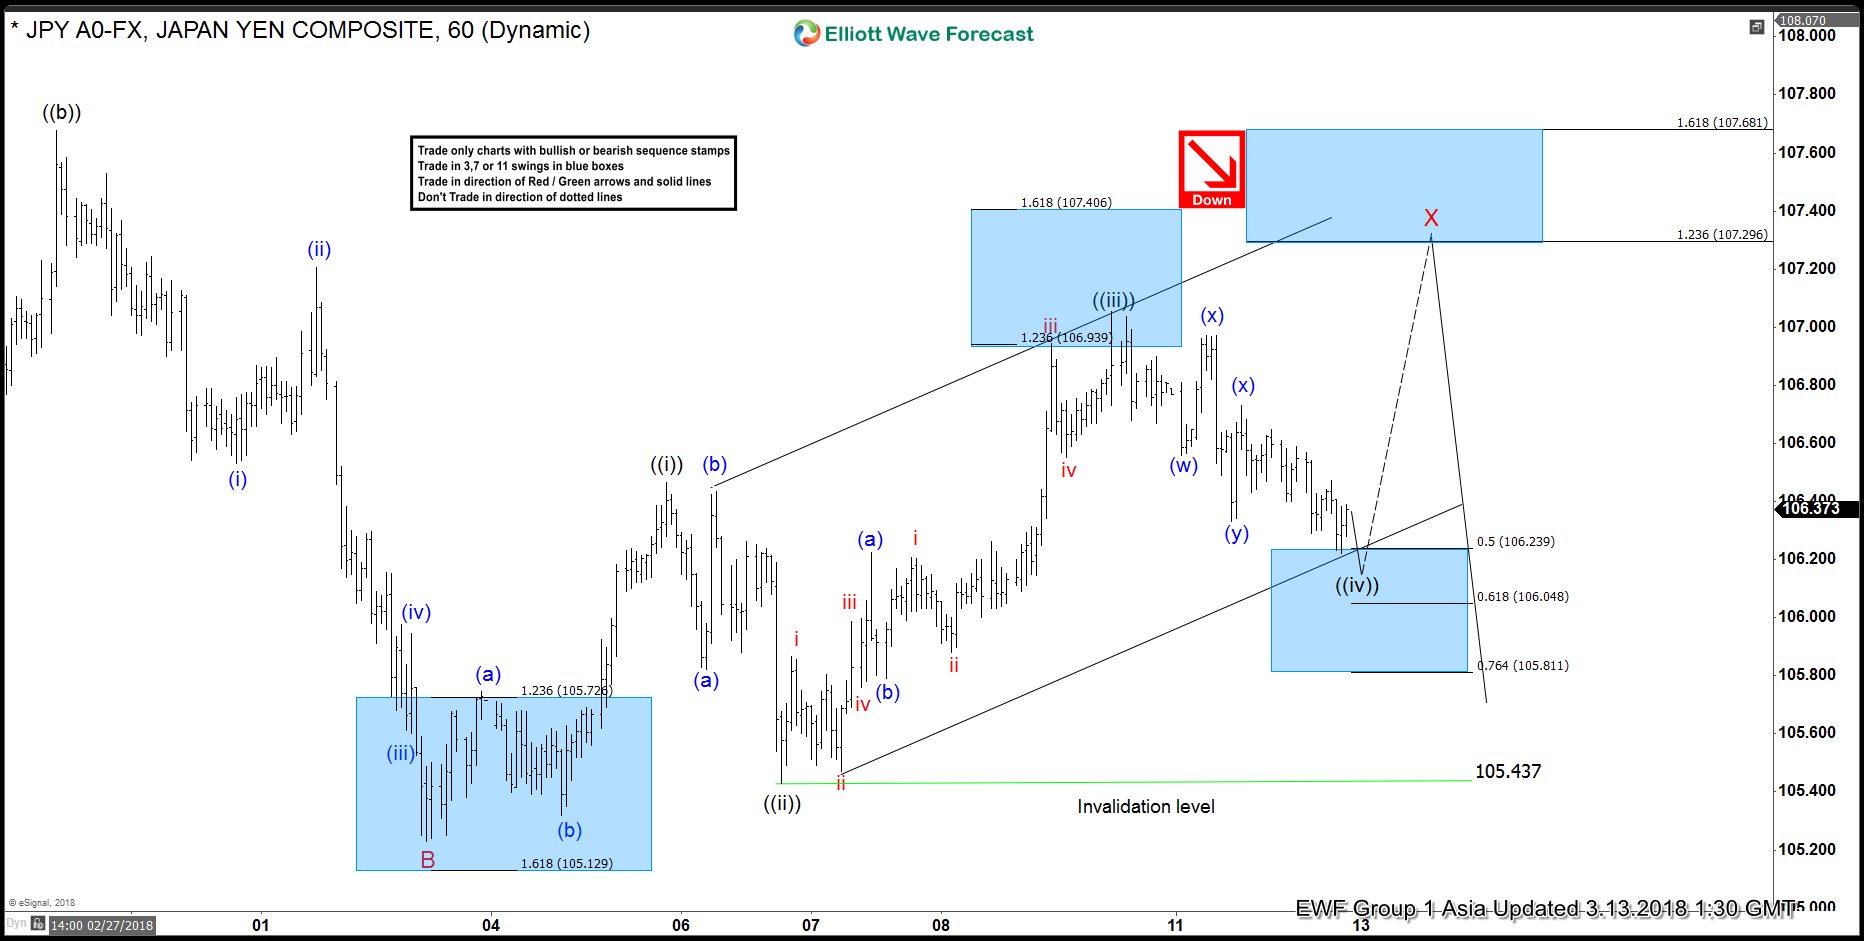
Read MoreShort Term Elliott wave View suggests USDJPY is correcting cycle from 2/2 peak (110.5) as an Expanded Flat Elliott Wave Structure. Flat is a corrective Elliott Wave structure with ABC label, and it has a subdivision of 3-3-5. In the case of USDJPY, Minor wave A ended at 197.9 on Feb 21 and Minor wave […]
-
Bitcoin BTCUSD Elliott Wave View Calling for Rally toward $15,000
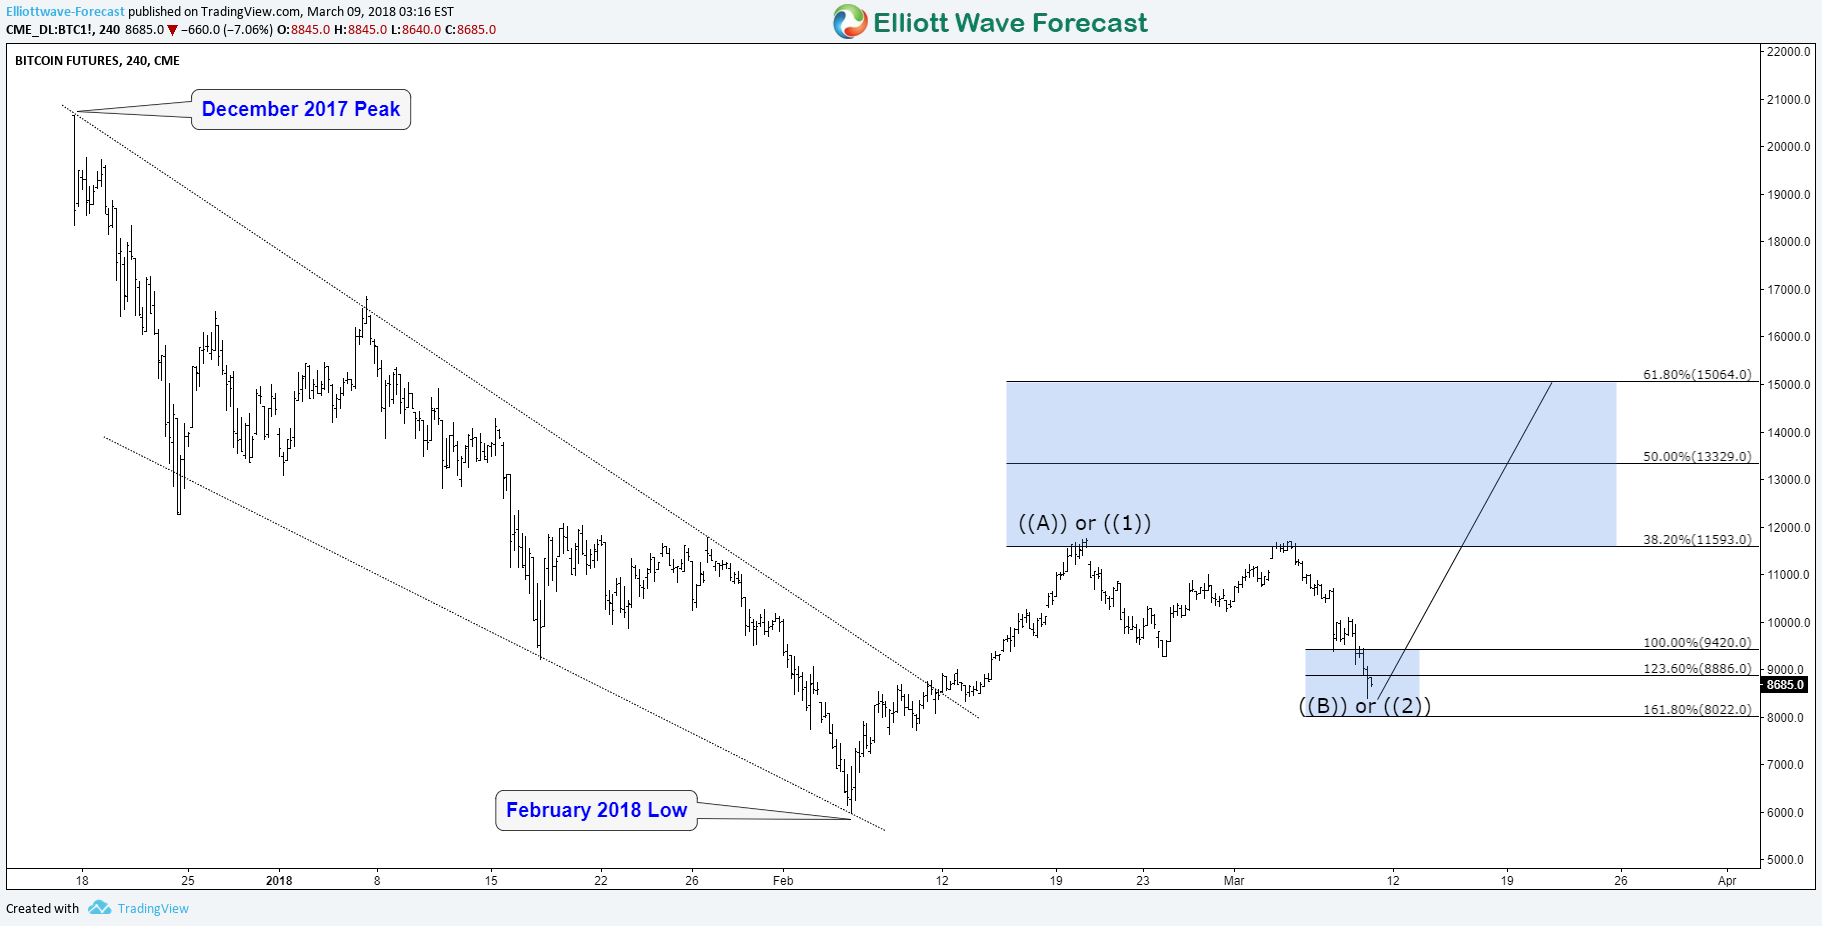
Read MoreSince all time high in December 2017, Bitcoin BTCUSD ( Value in US Dollar ) dropped 70% before finally bottoming around $6590 on the 6th of February 2018. The big decline drove fear into the digital market as many new investors / traders lost their money during that period so they decided to stay away […]
-
Canadian Dollar Relief Rally After Tariff Exemption
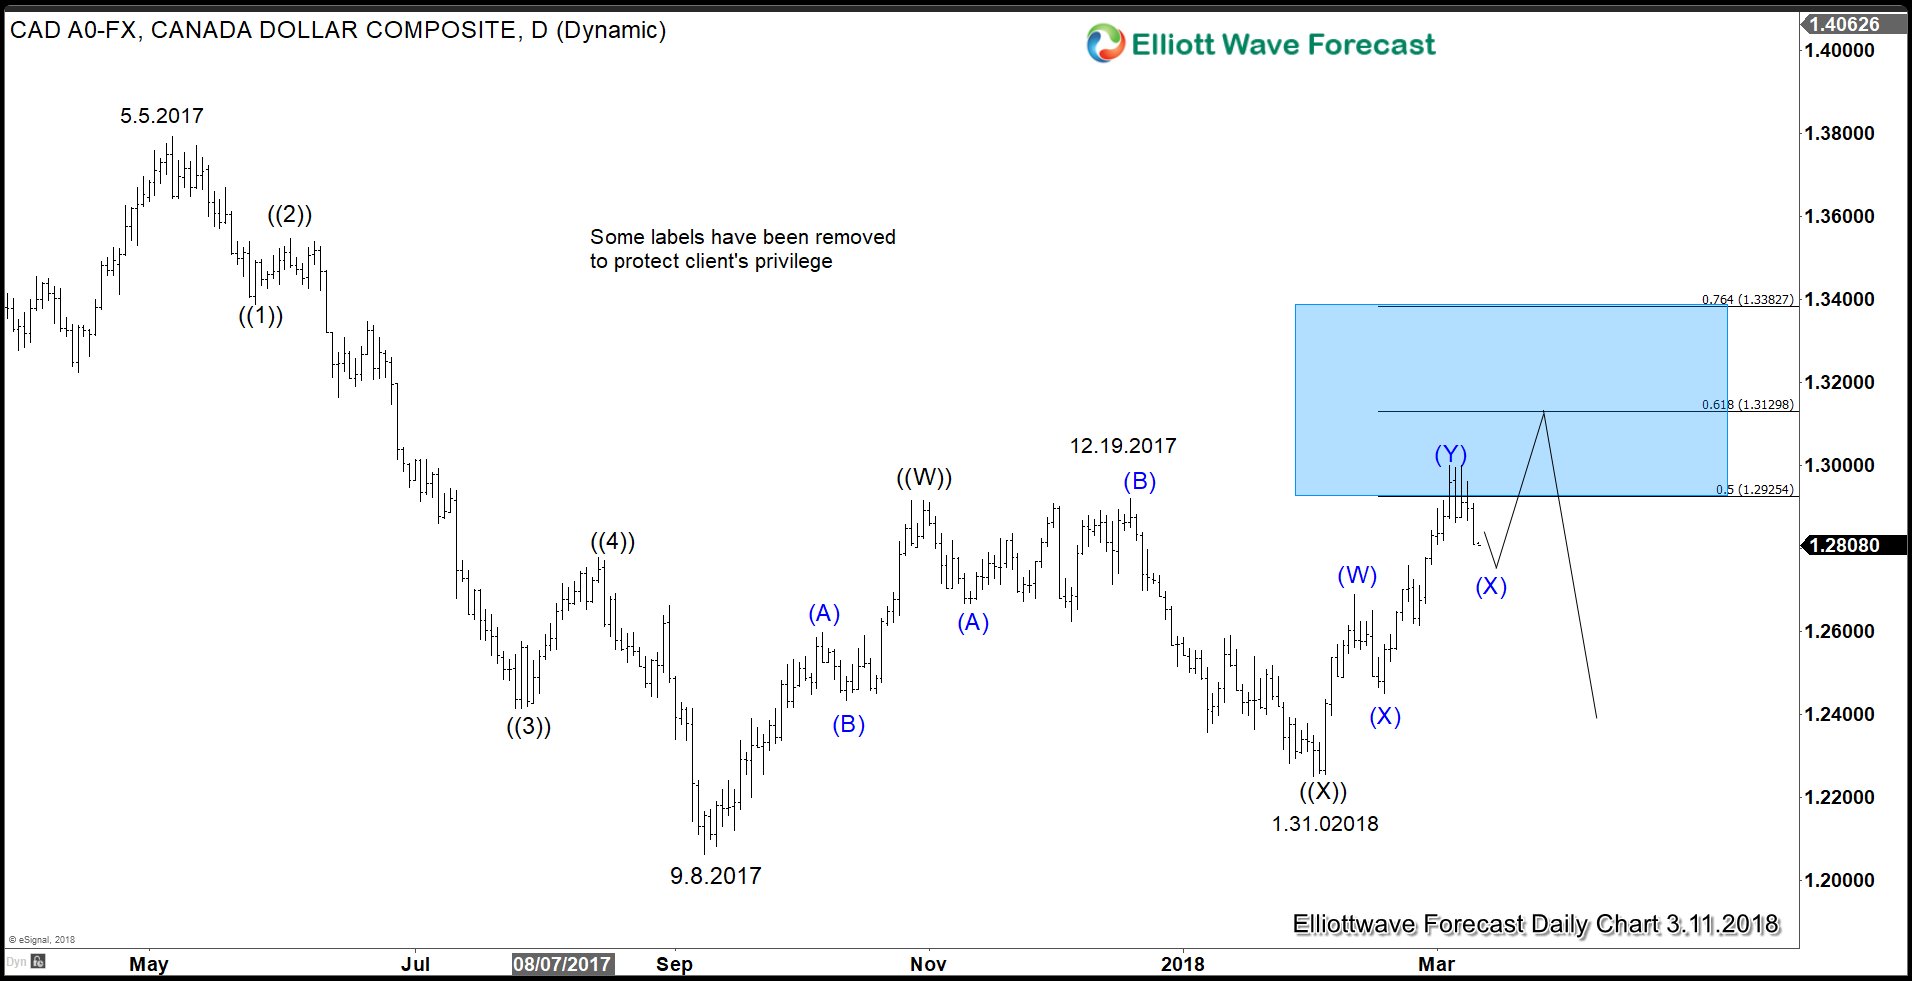
Read MoreCanadian Dollar had a relief rally last week after the U.S. excluded Canada and Mexico from steel and aluminum tariffs. President Trump’s administration enacted these tariffs under section 232 Trade Expansion Act of 1982 on the ground of national security. President Trump said that the importation of steel and aluminum was “in such quantities and […]
-
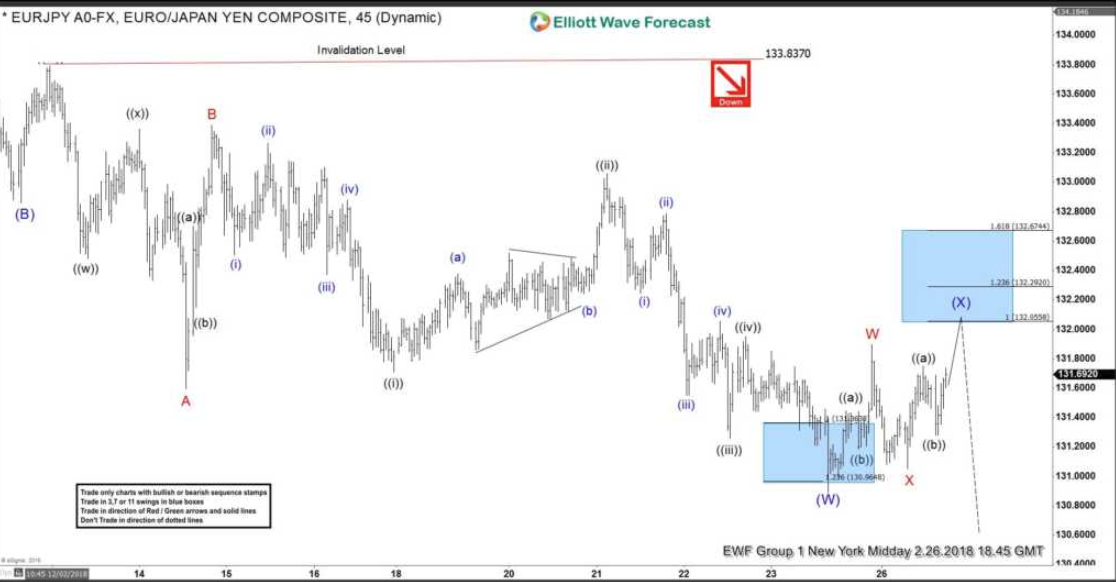
Elliott Wave Analysis: EURJPY Calling the Decline
Read MoreIn this short blog, we will have a look at a past Elliott wave short-term structures of the EURJPY presented to members last month. In the chart below, you can see the 1 hour new York midday update presented to members on the 02/26/18. Calling for a double correction in Minor Red W-X-Y. EURJPY shorter […]
-
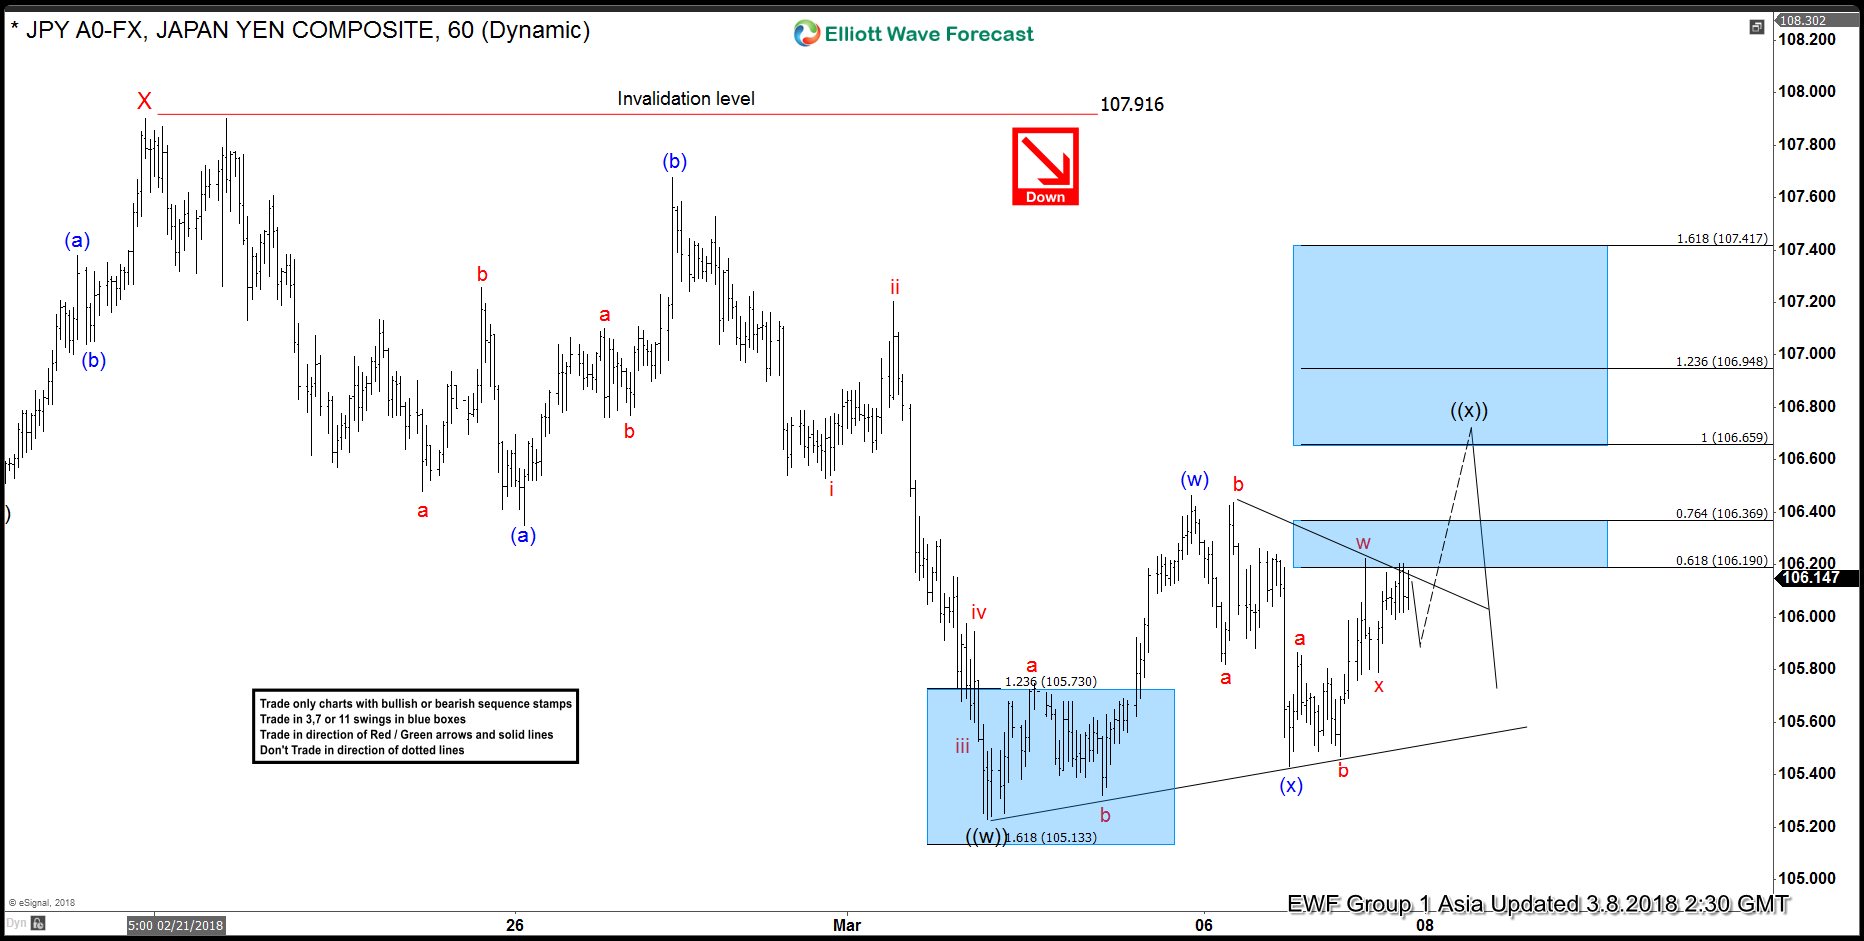
Elliott Wave Analysis: USDJPY Correction Should Fail Below 107.9
Read MoreShort Term USDJPY Elliott Wave view suggests that the rally to 107.9 ended Minor wave X. Pair is expected to resume lower while bounces stay below this level. Down from Minor wave X at 107.91, Minor wave Y is in progress as a double three Elliott Wave Structure. Minute wave ((w)) of Y ended at 105.23 […]
-
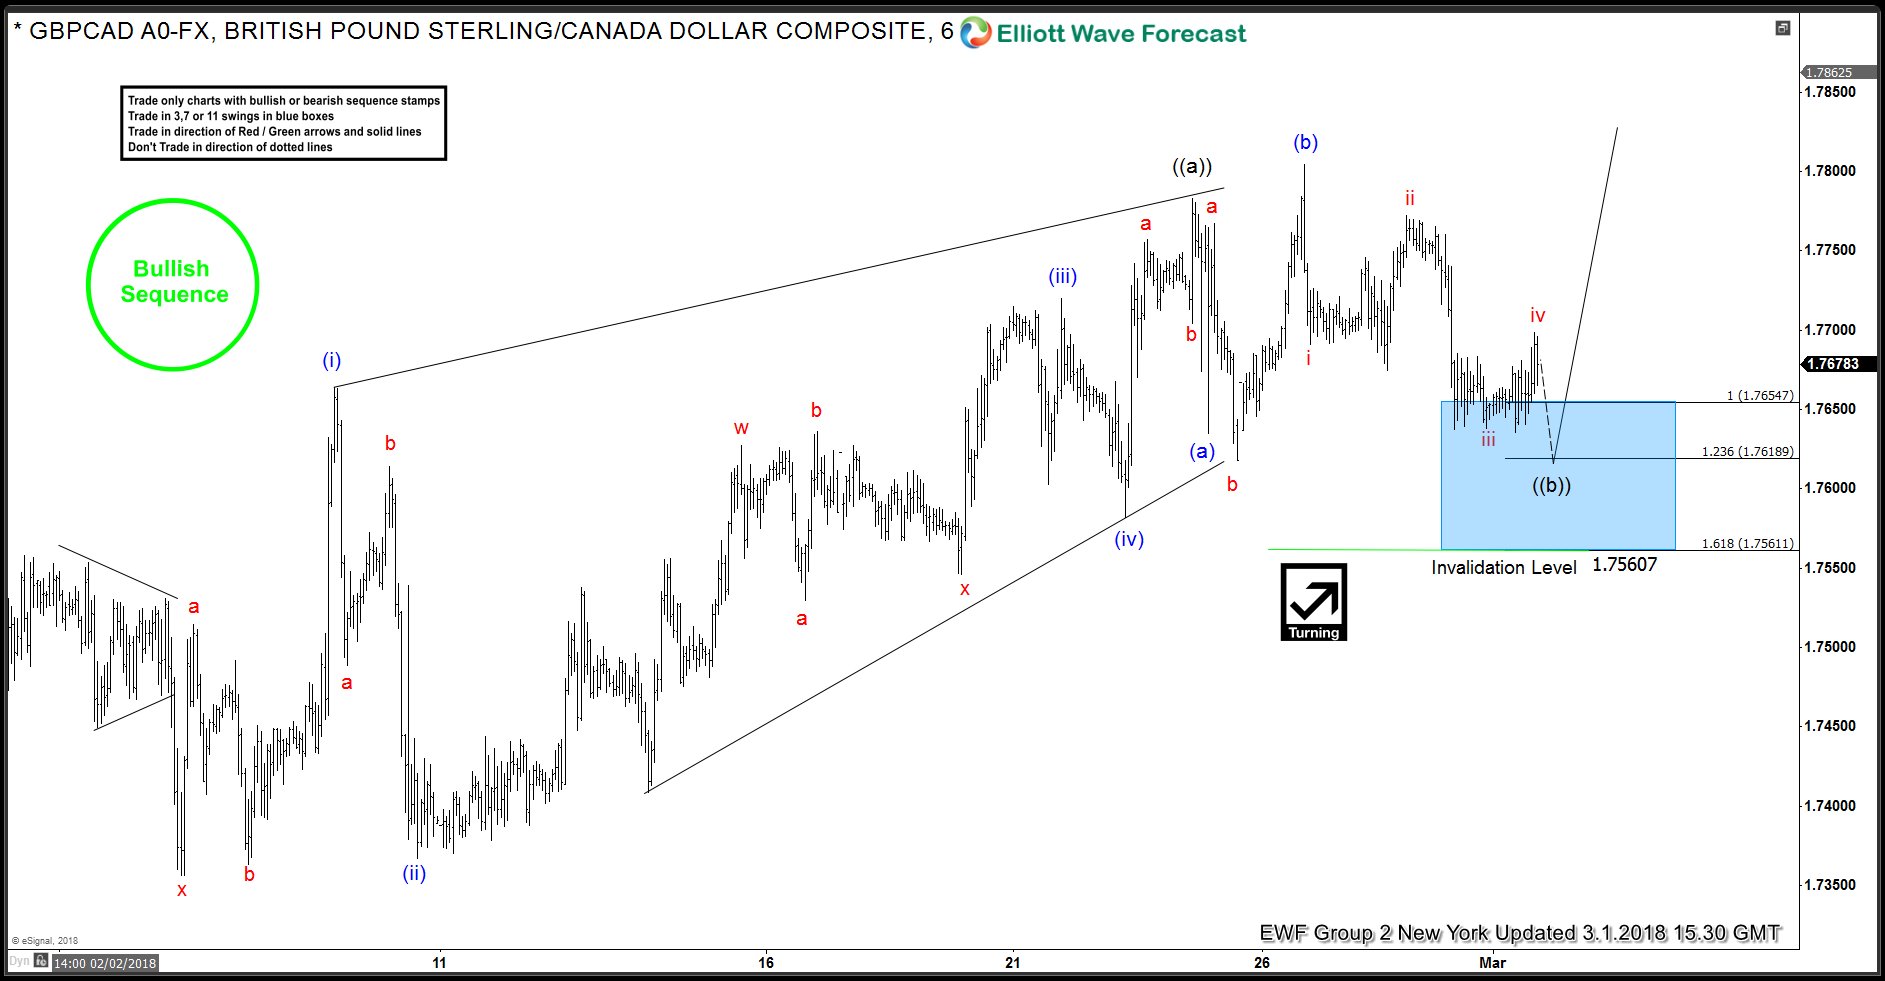
GBPCAD: Forecasting the rally after Flat
Read MoreHello fellow traders. In this technical blog we’re going to take a look at the past Elliott Wave charts of GBPCAD published in members area of the website. As our members know, GBPCAD have had incomplete bullish sequences in the 1 Hour cycle, suggesting further rally. Consequently, we advised clients to avoid selling the pair […]