
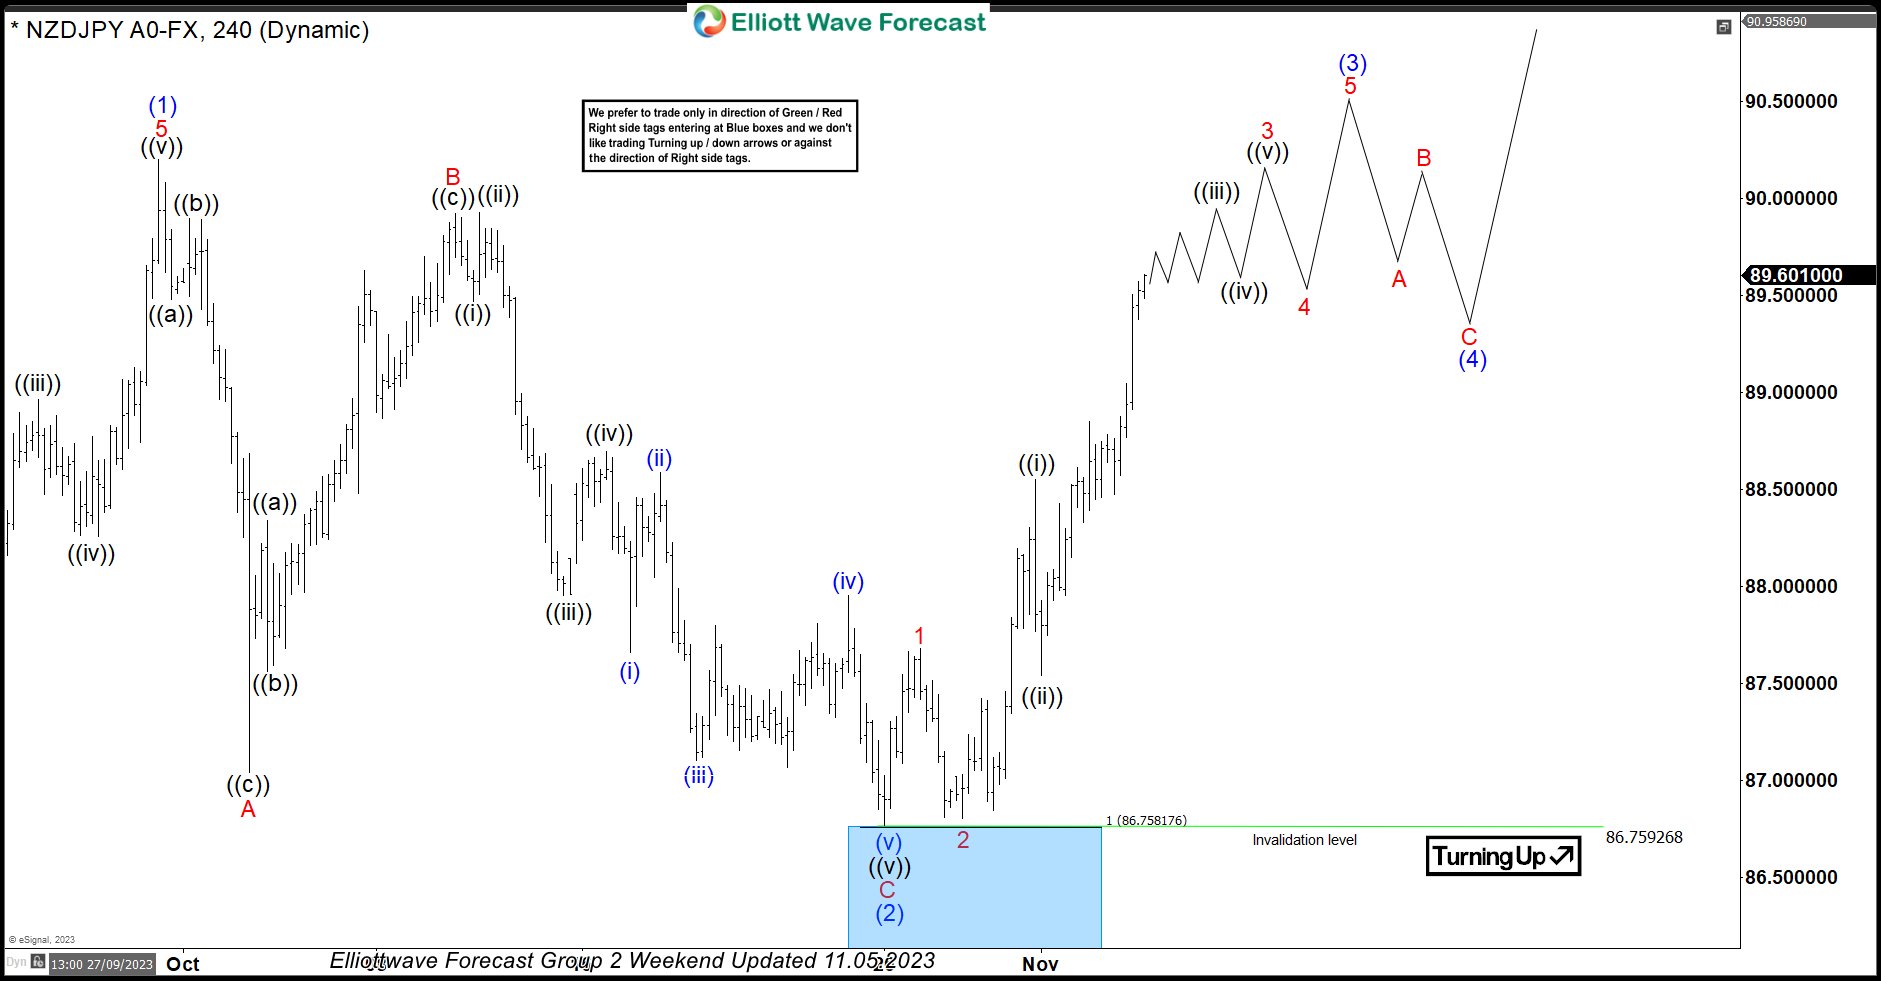
In this technical blog, we will look at the past performance of the 4-hour Elliott Wave Charts of NZDJPY. In which, the rally from 24 March 2023 low unfolded as an impulse sequence and showed a higher high sequence. Therefore, we knew that the structure in NZDJPY is incomplete to the upside & should extend higher. So, […]
-
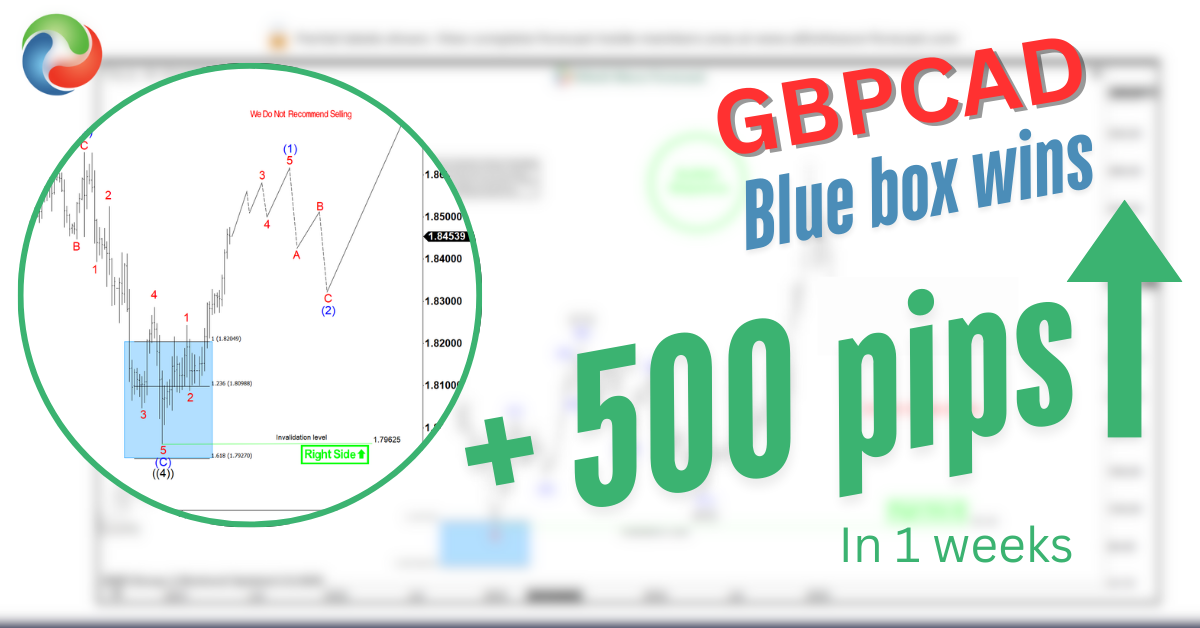
GBPCAD Trade Setup: Bulls Re-Enter from Blue Box
Read MoreHello traders and welcome to another ‘blue box’ blog post. In a blog post like this, we discuss most recent trade setups that the Elliottwave-Forecast members took. The spotlight will be on the GBPCAD again in this post. In the last update on GBPCAD, we discussed a bullish trade setup from the blue box. The […]
-
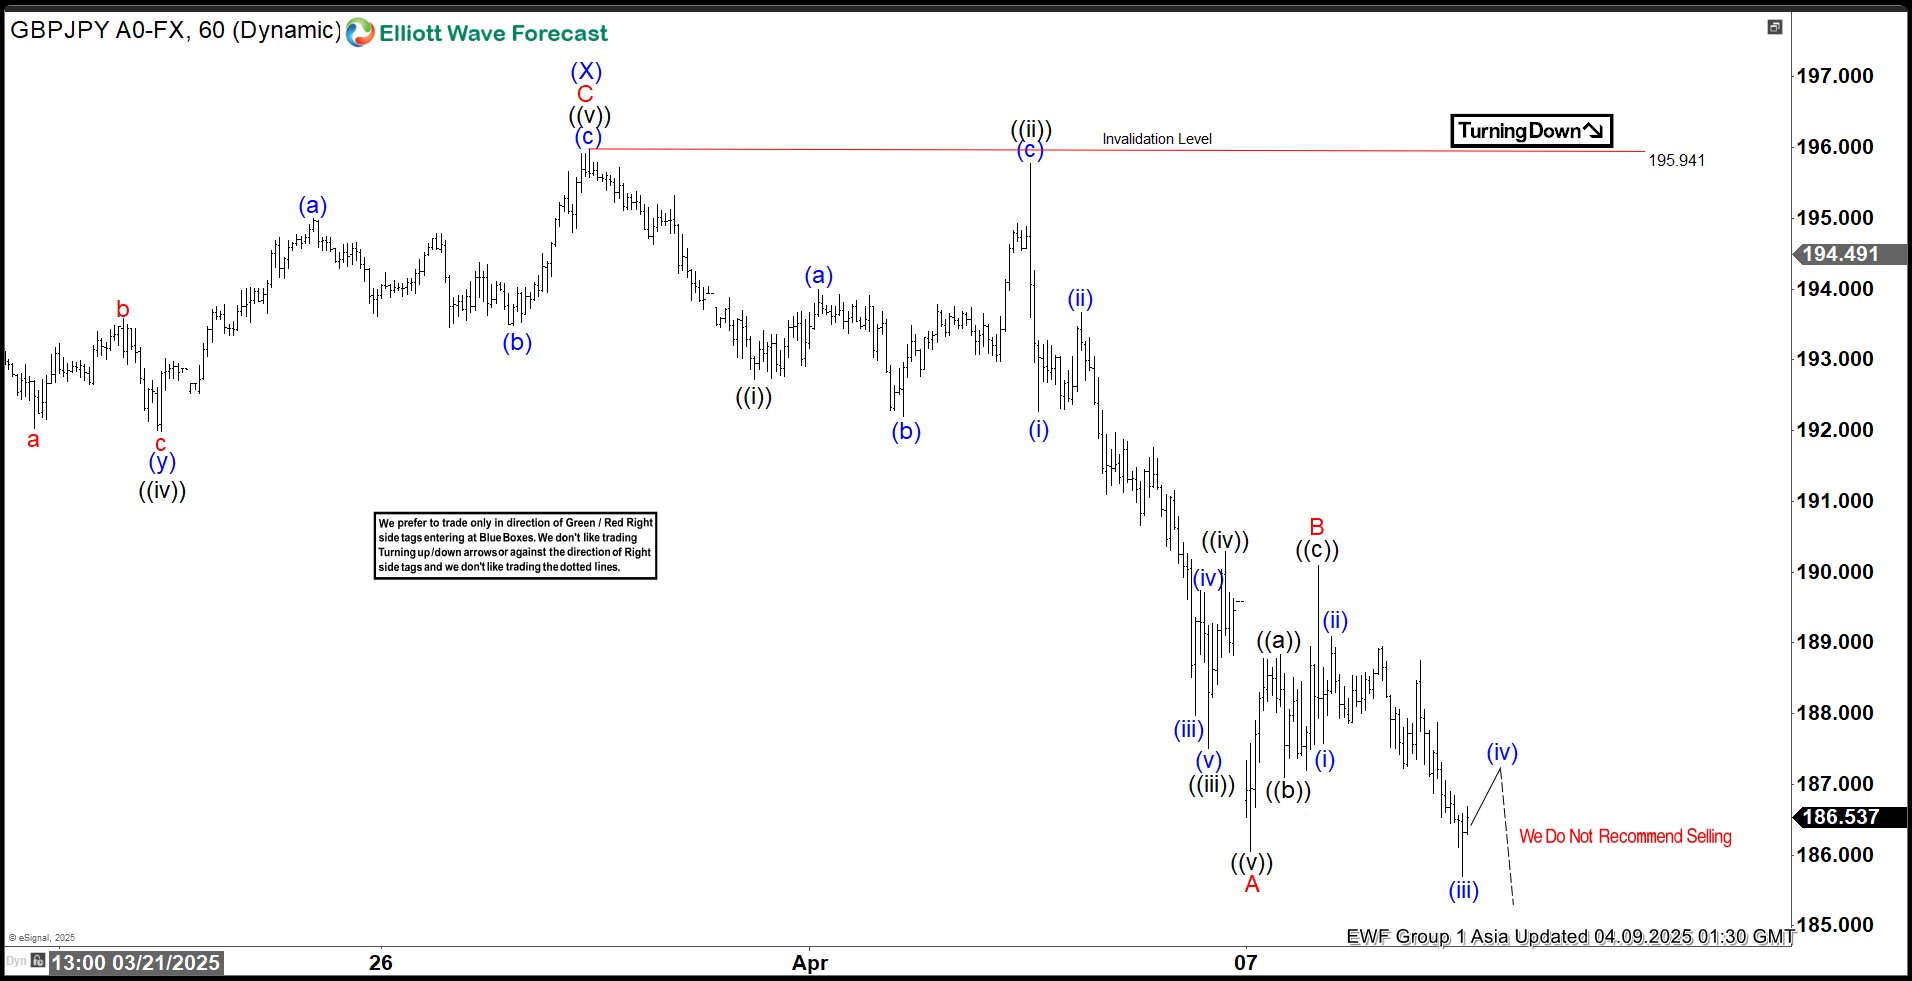
Elliott Wave Indicates Bearish Sequence for GBPJPY, Favoring a Downward Trajectory
Read MoreThe GBPJPY pair exhibits a bearish sequence, indicating potential for further declines. This article and video explore the Elliott Wave for the pair.
-
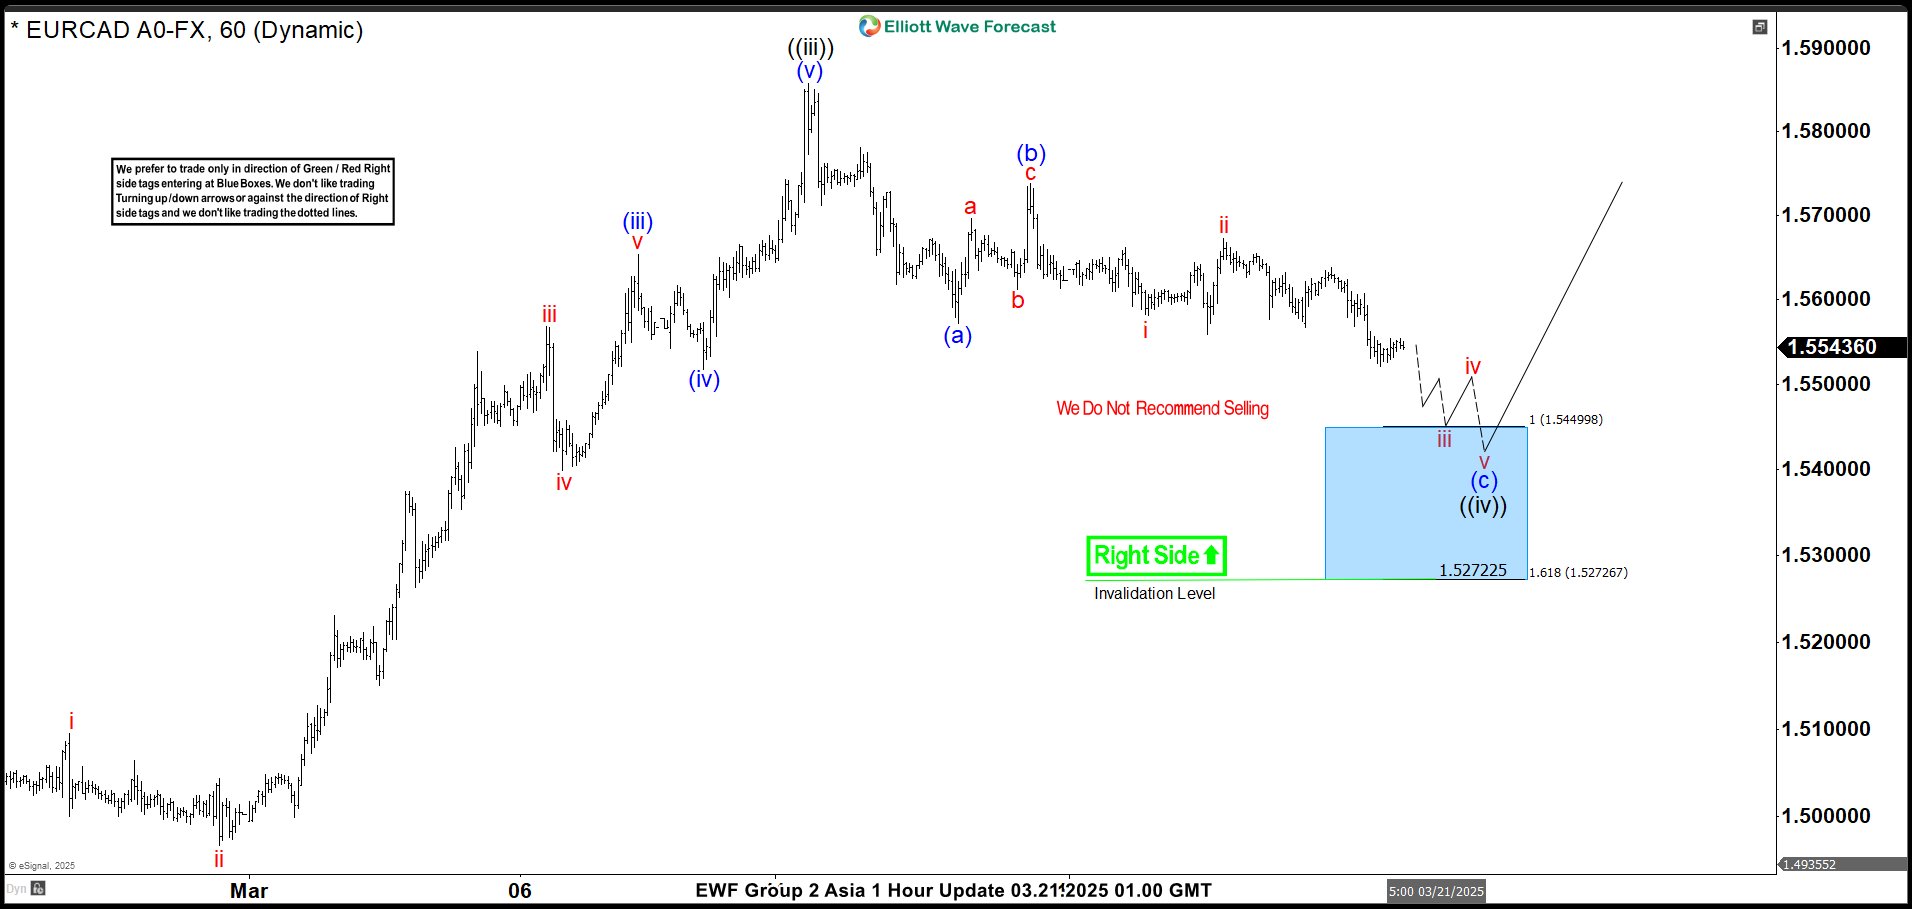
EURCAD: Precise Reaction Higher from the Blue Box—What’s Next?
Read MoreIn this blog, we take a look at the past 1 hour Elliott wave charts of EURCAD. In which, precise reaction from the blue box area is taking place.
-
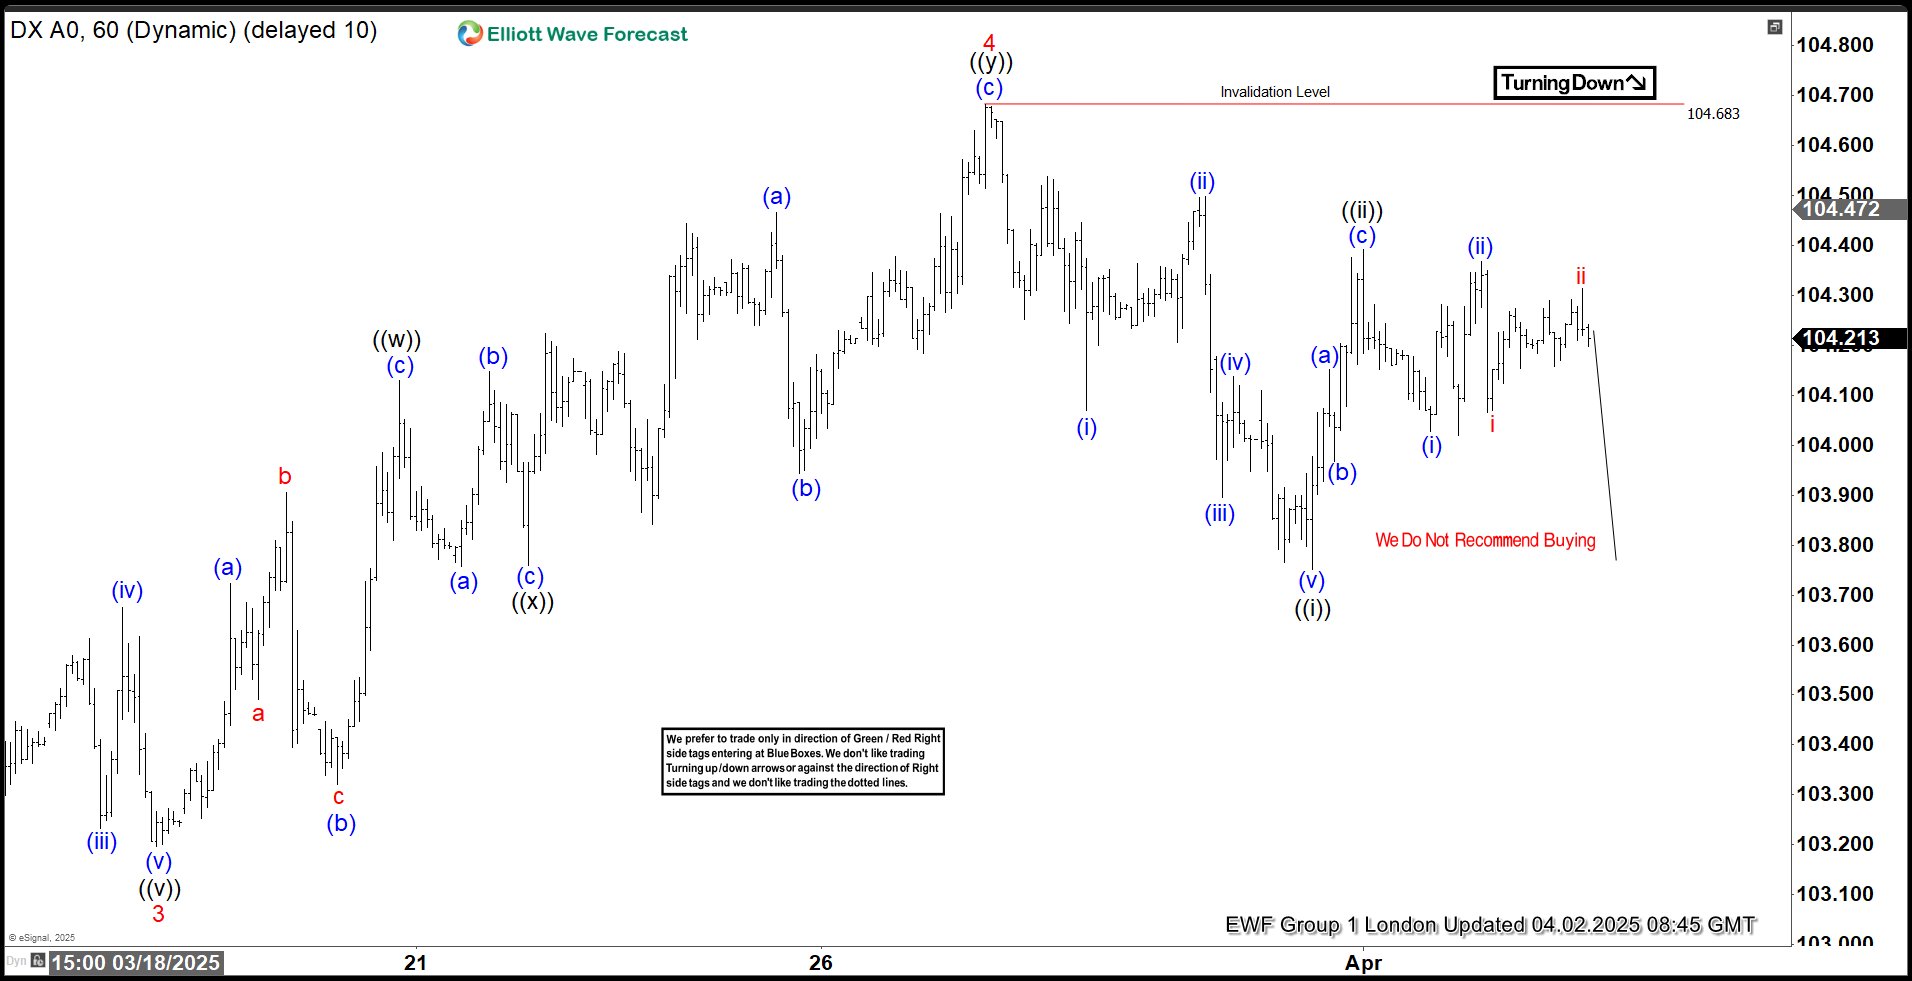
Dollar Index (DXY) Elliott Wave : Forecasting the Decline
Read MoreHello fellow traders. In this technical article we’re going to look at the Elliott Wave charts of Dollar Index DXY published in members area of the website. As our members know , Dollar shows bearish sequences in the cycle from the 110.157 peak. In the following text, we will explain the Elliott Wave forecast in more […]
-
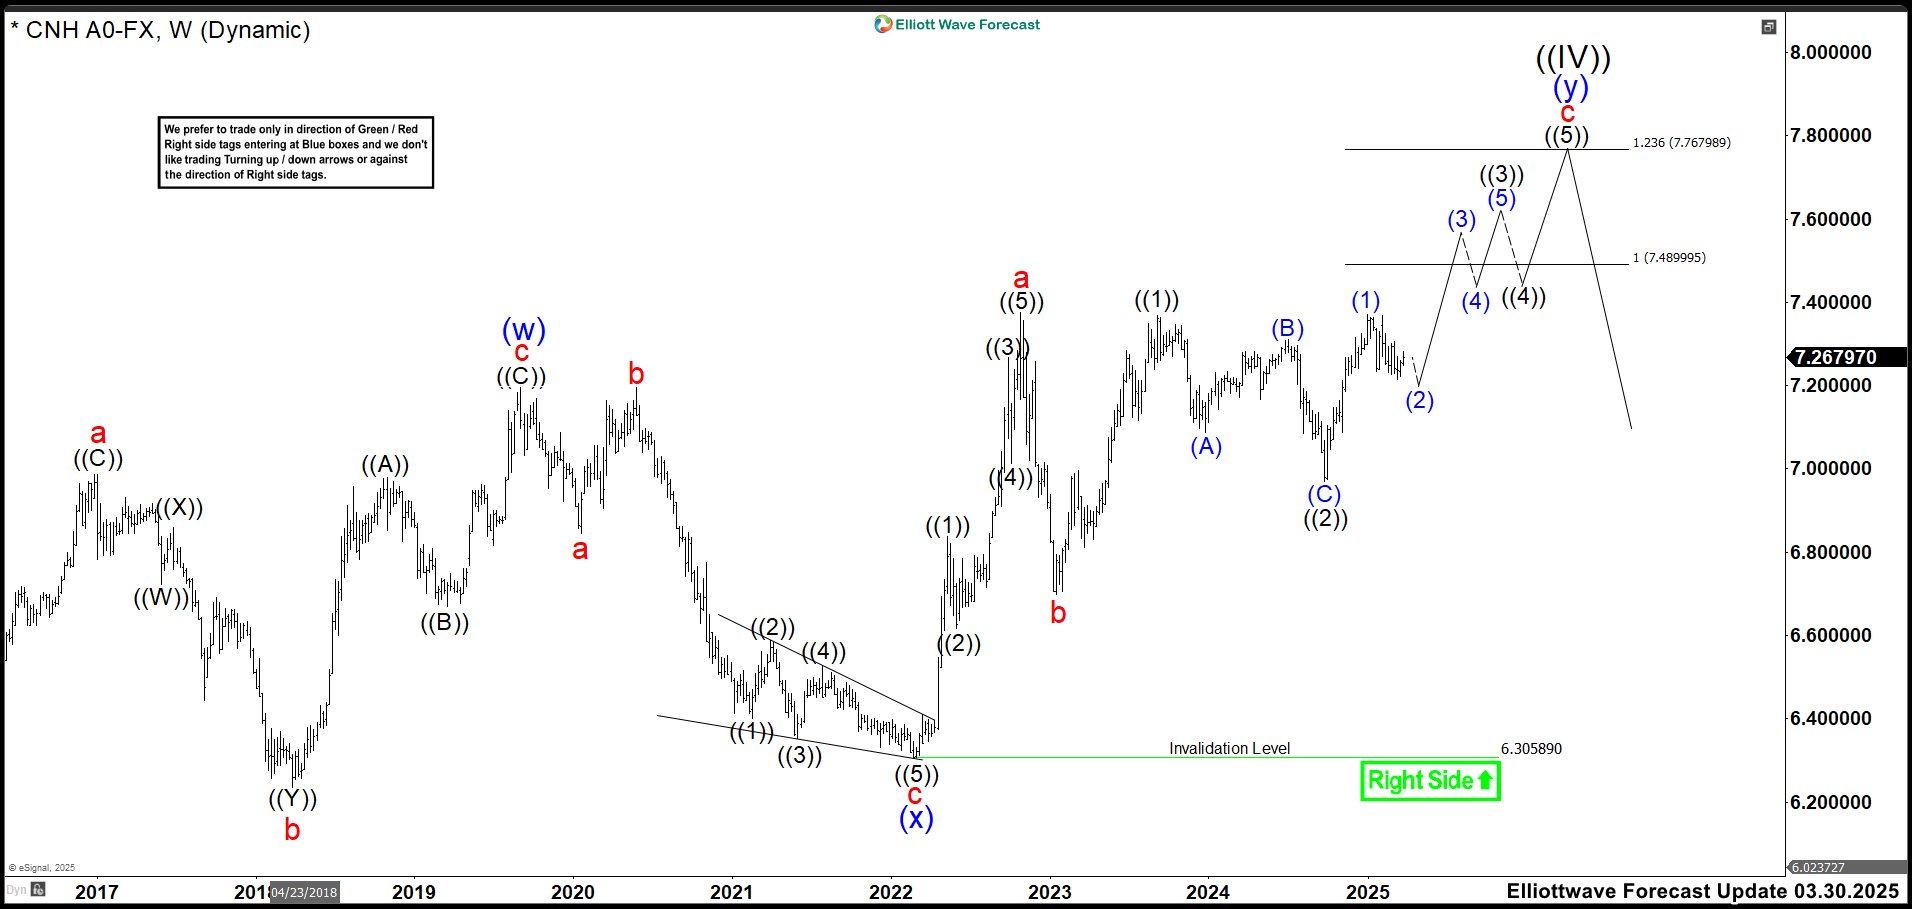
Riding the Trend: USDCNH Shows Dollar Strength Set to Persist
Read MoreIn recent years, the renminbi paused its attempt to strengthen against the USD. In February 2014, the renminbi found support at 6.0153 as wave ((III)). From there, it formed a perfect zig-zag corrective structure, reaching equal legs at the 7.1964 high in September 2019. Following these three swings, USDCNH was expected to continue its downtrend. […]
-
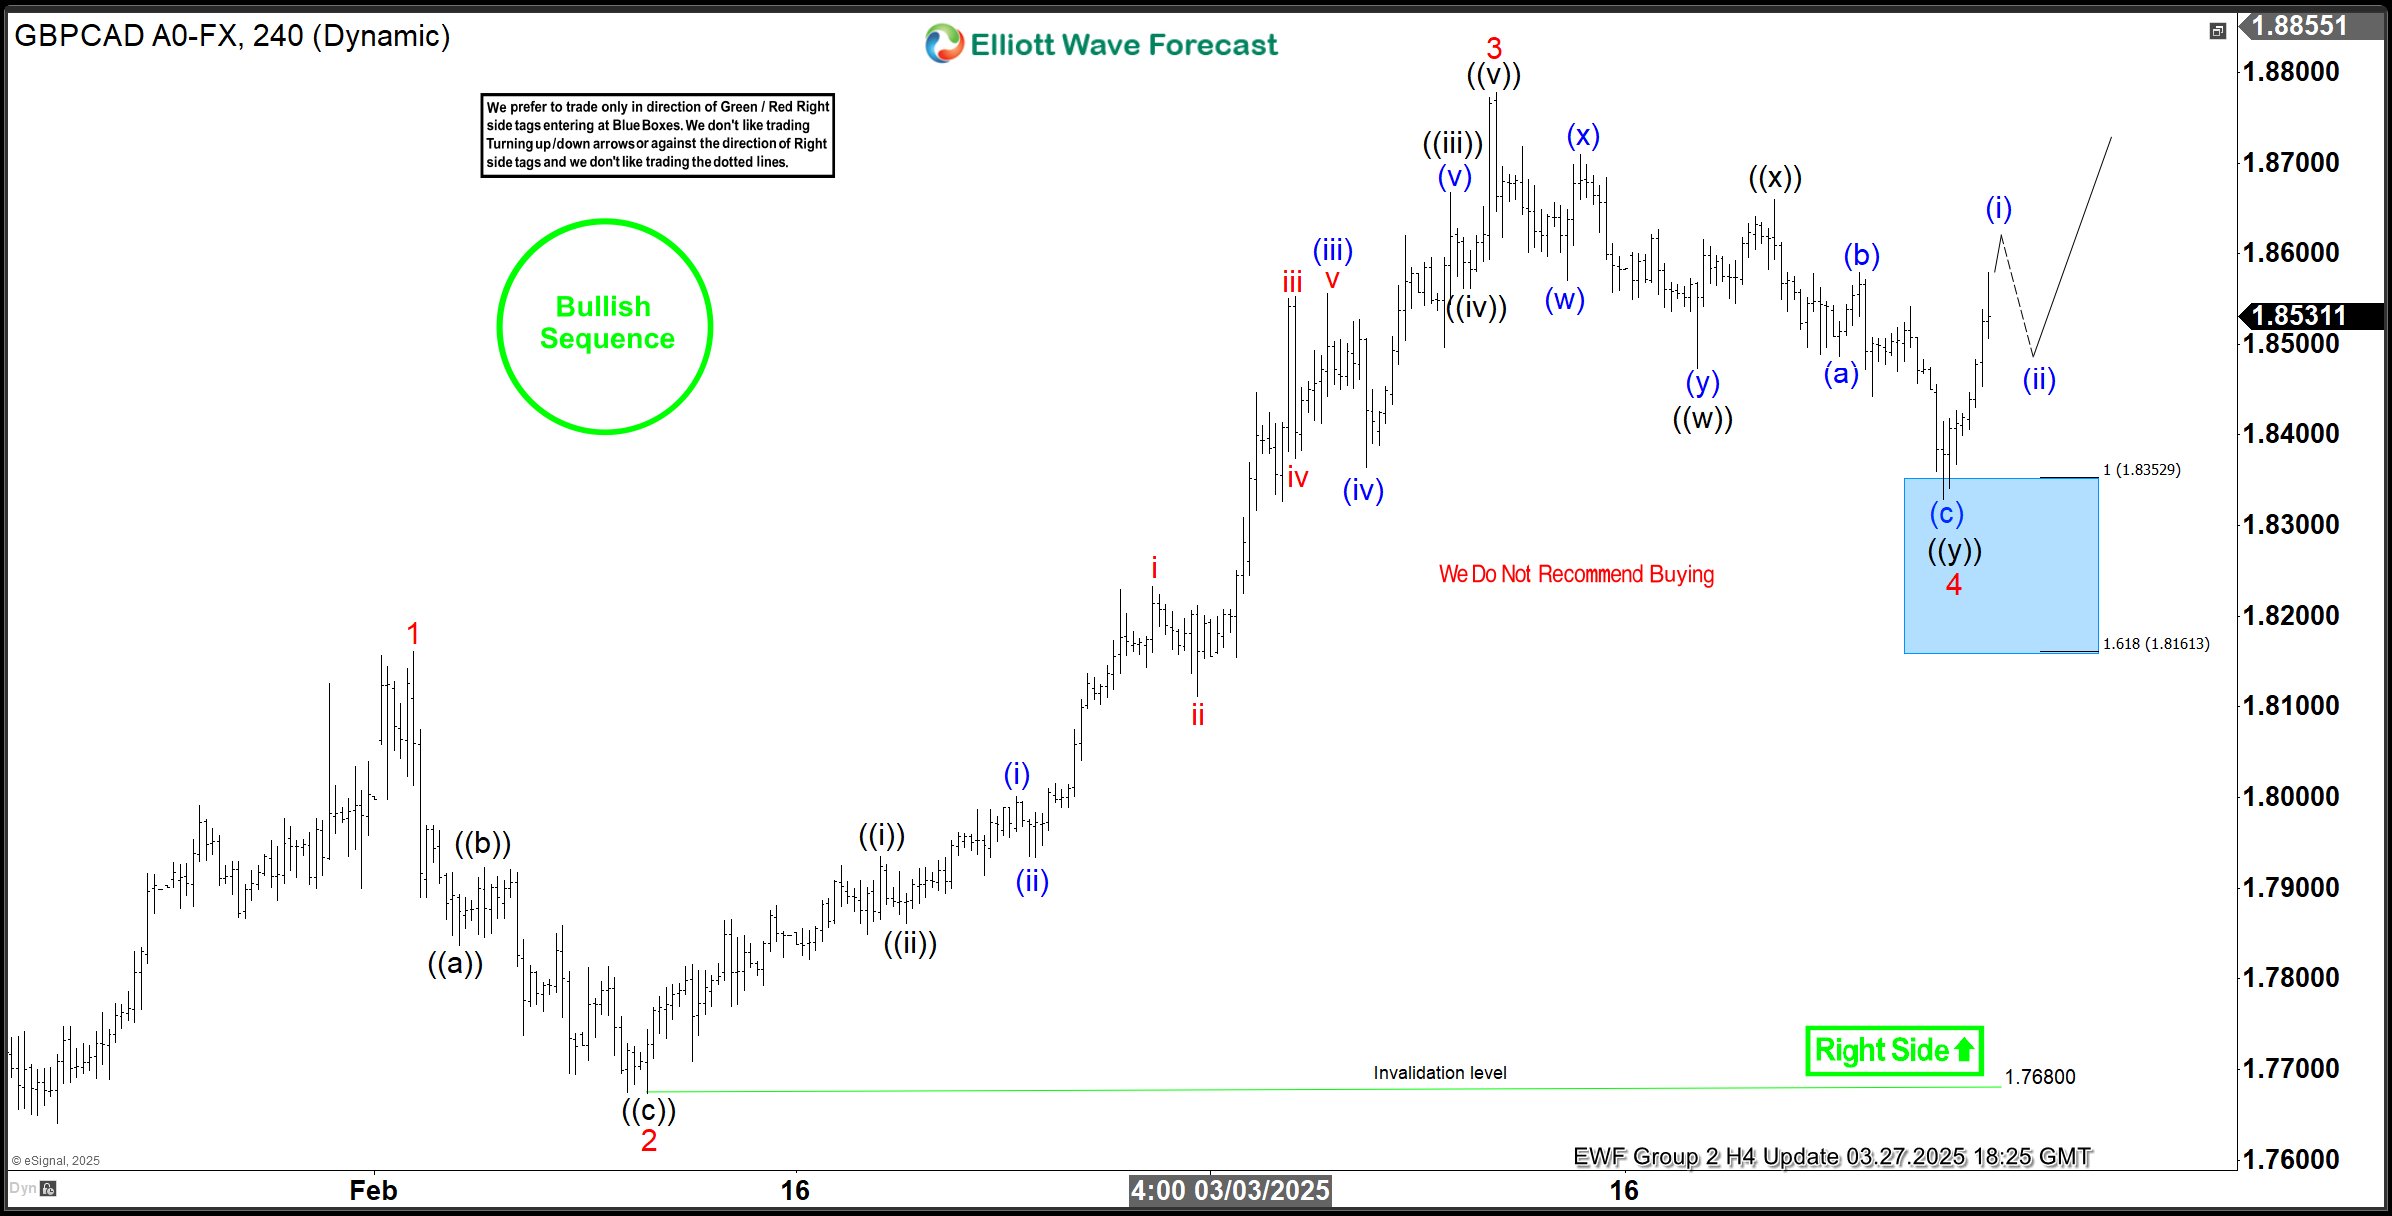
GBPCAD Finds Support in Blue Box, Buyers Achieve First Target
Read MoreHello traders. Welcome to another ‘blue box’ post where we discuss the recent trade setup that Elliottwave-forecast members traded. In this post, the spotlight will be on the GBPCAD currency pair. In the long term, GBPCAD is developing as a bearish market within a proposed diagonal structure. The Supercycle degree wave (I) was completed in […]