
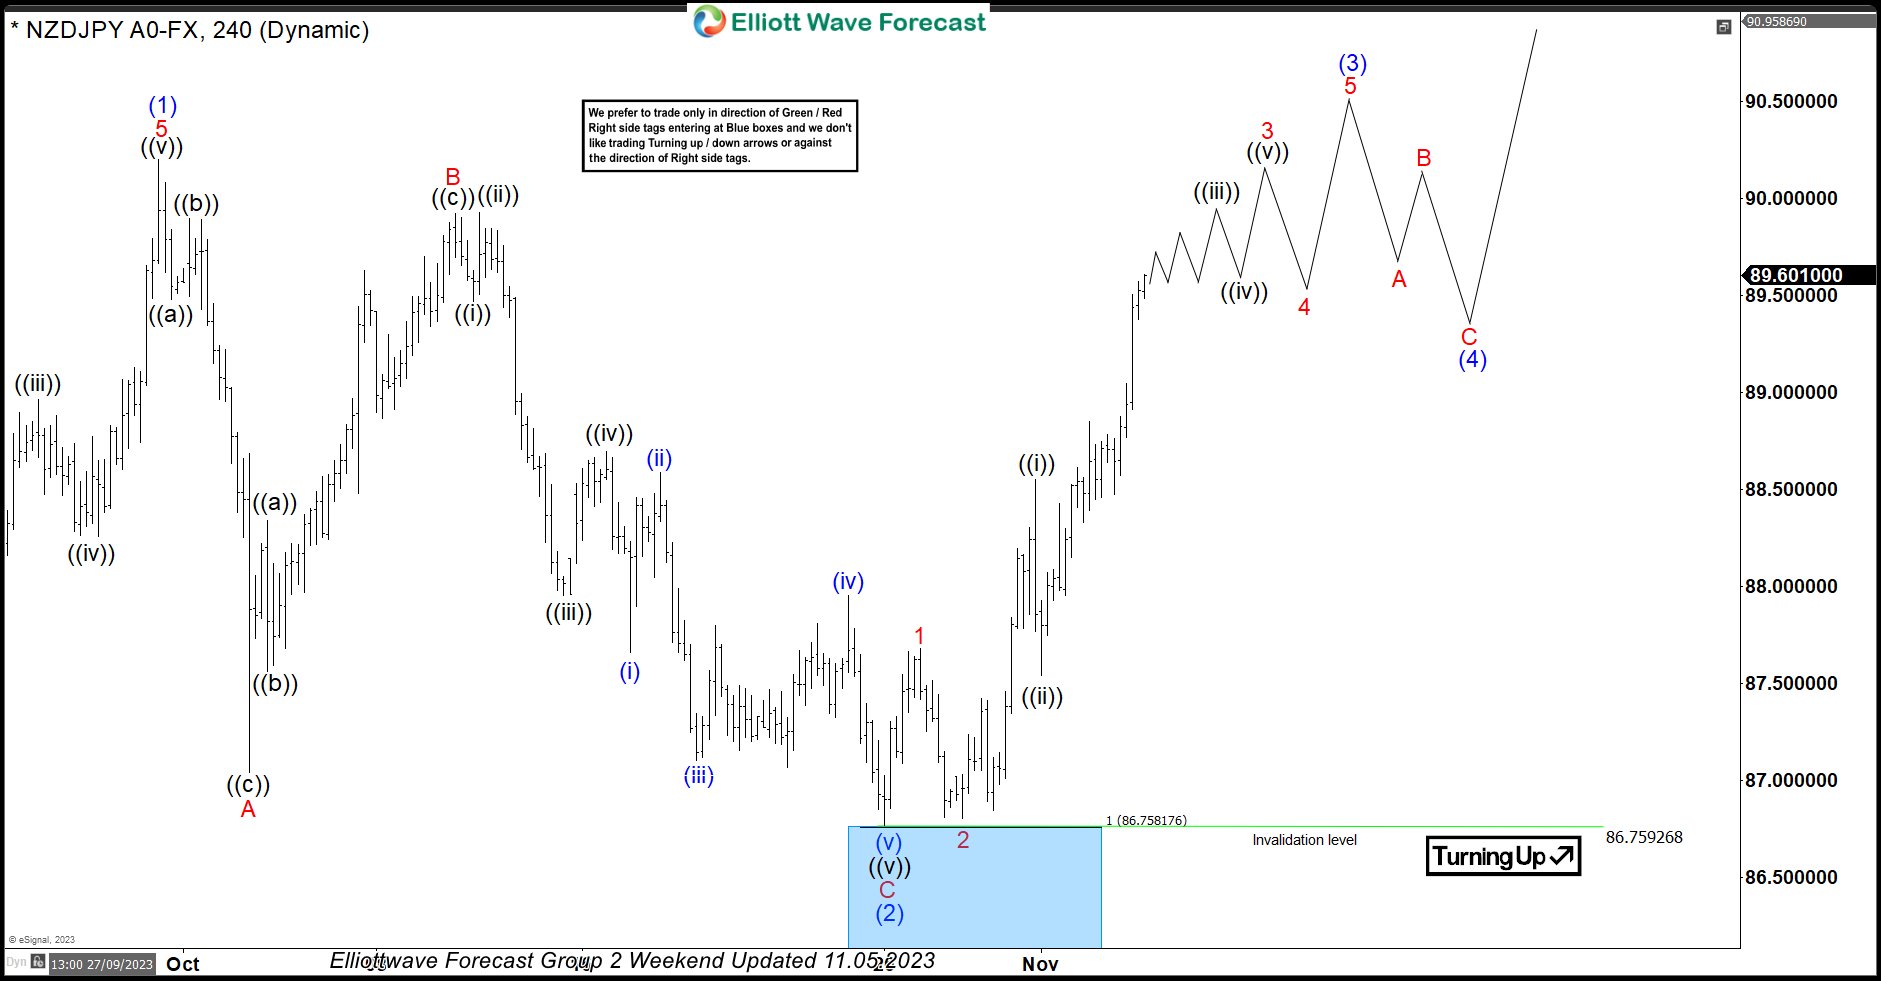
In this technical blog, we will look at the past performance of the 4-hour Elliott Wave Charts of NZDJPY. In which, the rally from 24 March 2023 low unfolded as an impulse sequence and showed a higher high sequence. Therefore, we knew that the structure in NZDJPY is incomplete to the upside & should extend higher. So, […]
-
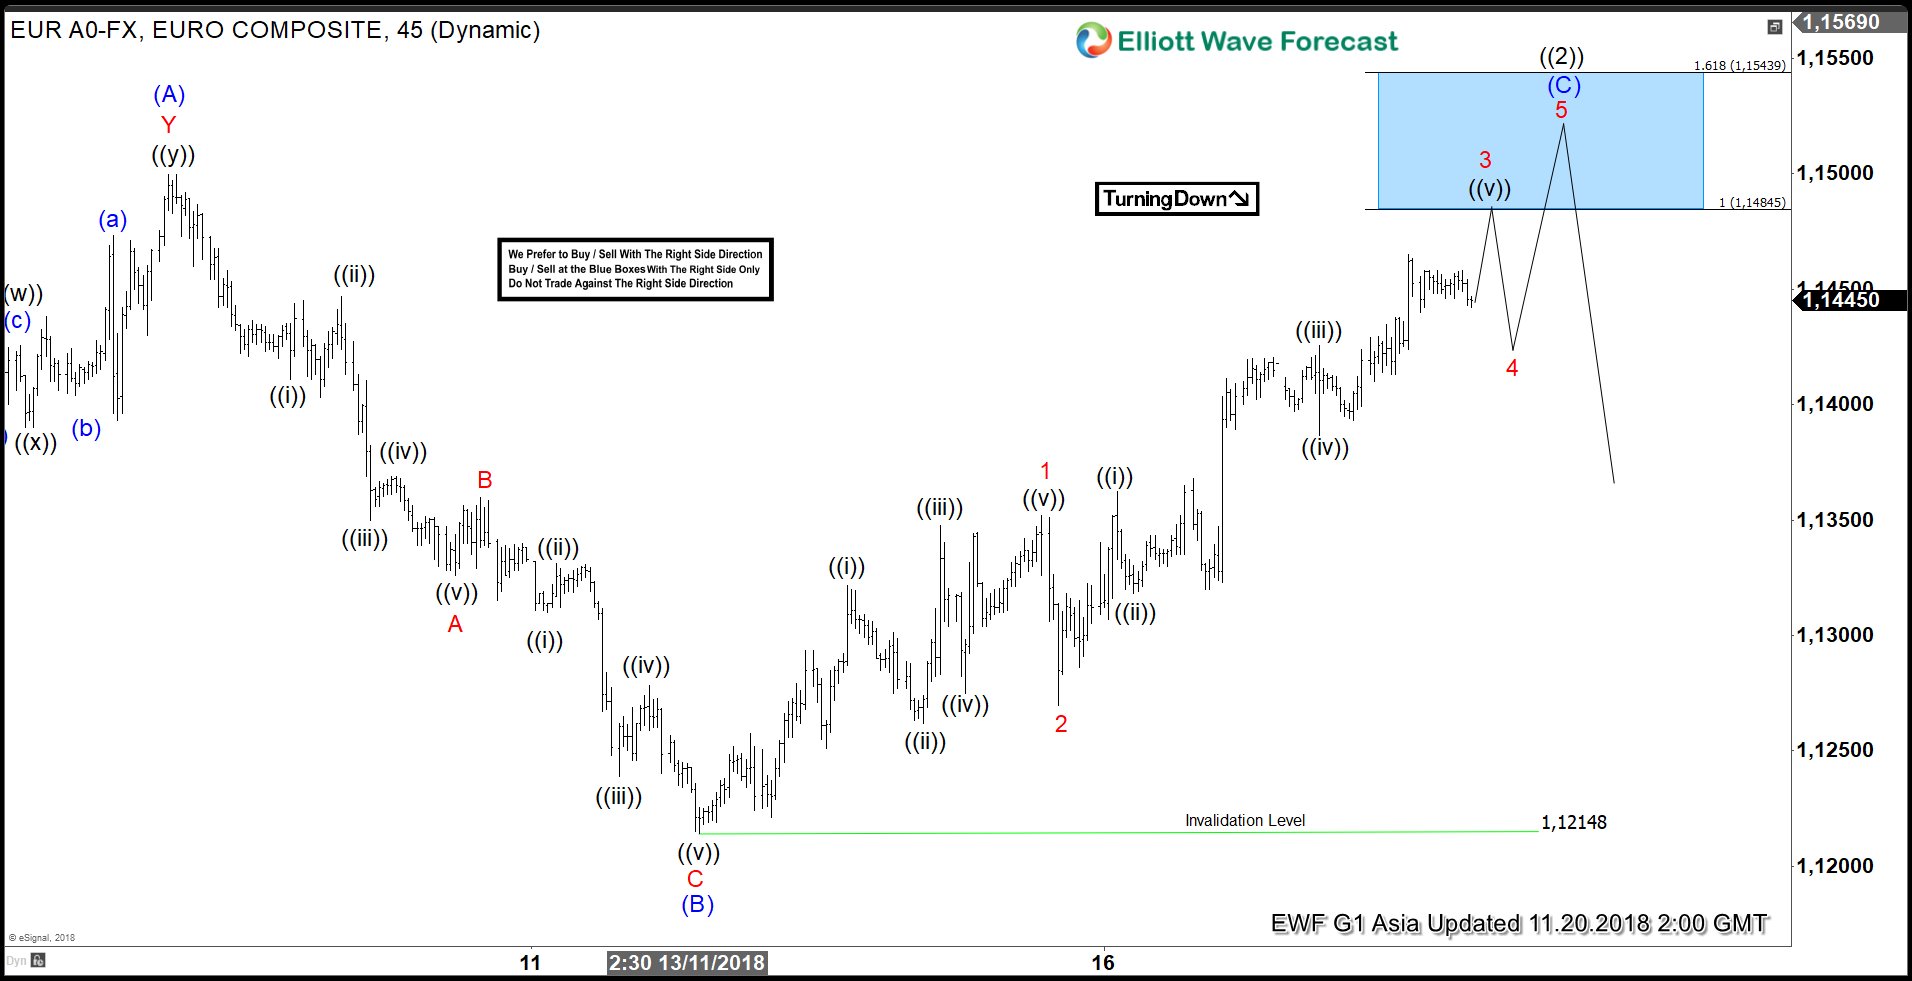
Elliott Wave analysis calling EURUSD to resume lower after Flat correction
Read MoreShort Term Elliott Wave View on EURUSD suggests that pair is currently in Primary wave ((2)) rally to correct cycle from Sept 24 high (1.1815) before the decline resumes. Internal of Primary wave ((2)) is unfolding as a Flat Elliott Wave structure where Intermediate wave (A) ended at 1.15 and Intermediate wave (B) ended at […]
-
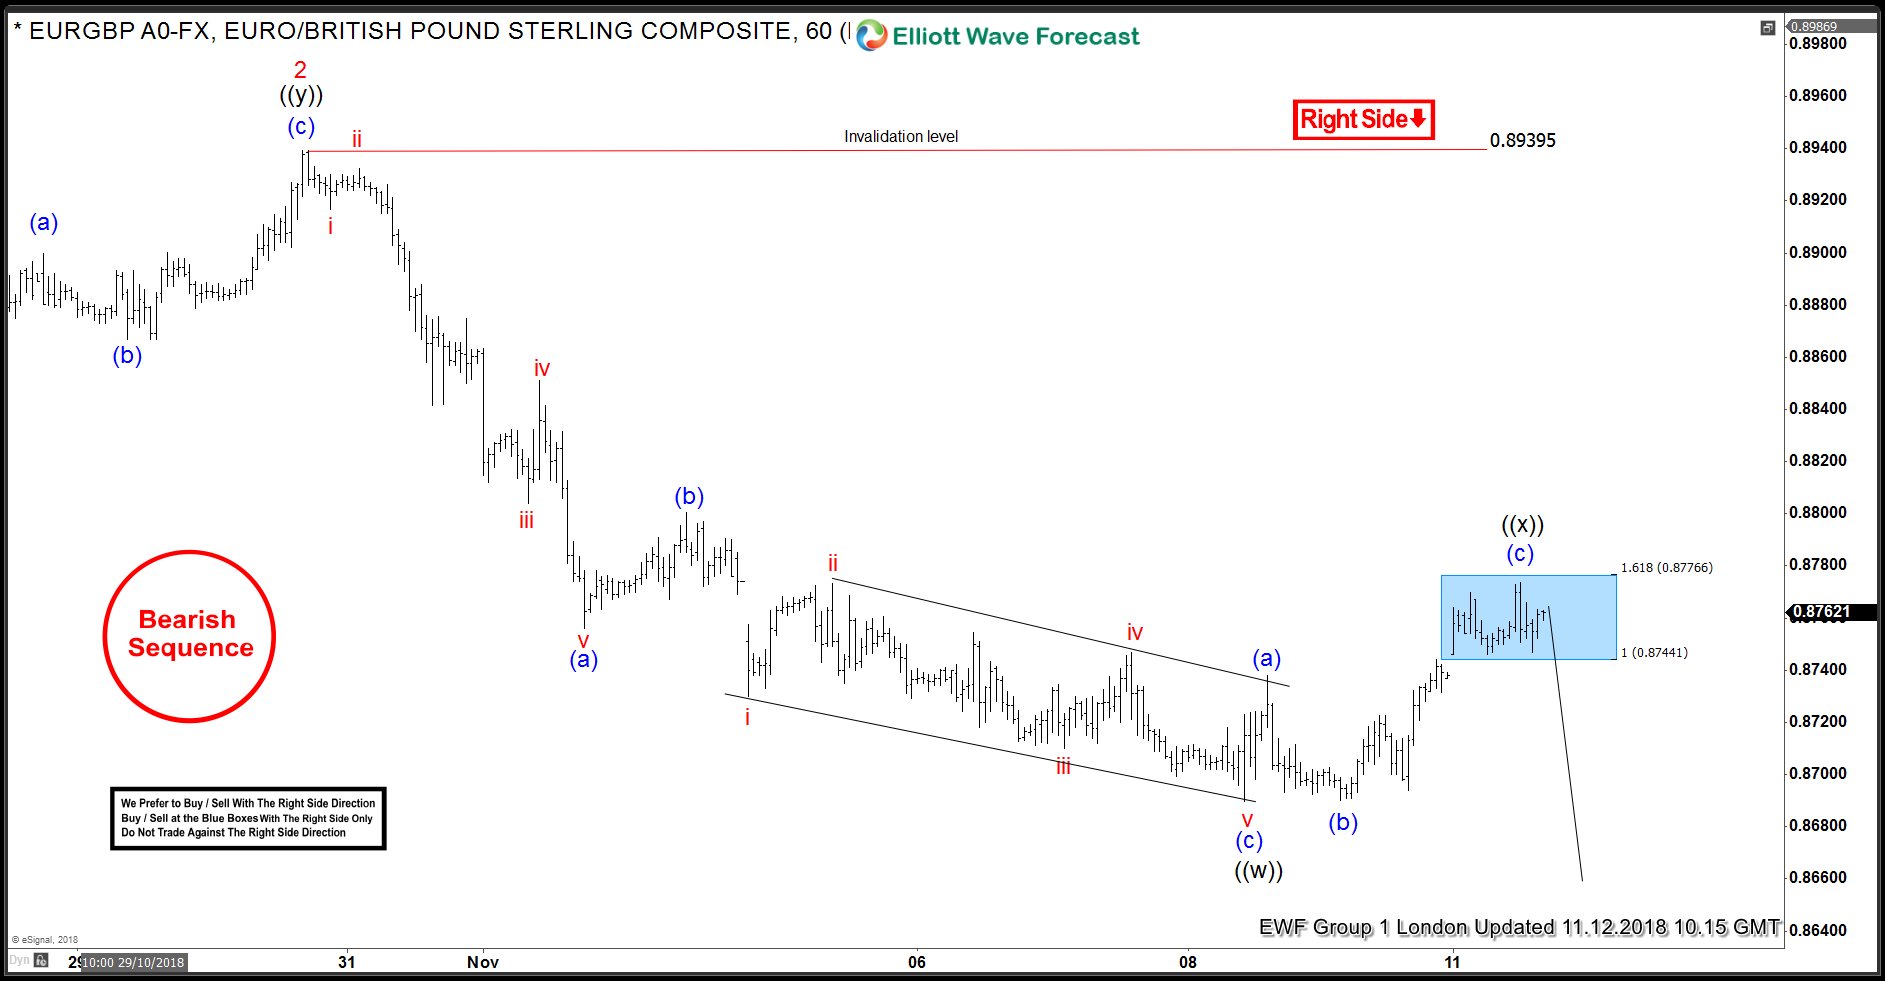
EURGBP Opened Further Extension Down in 7th Swing
Read MoreHello fellow traders. Another instrument that we have been trading lately is EURGBP . In this technical blog we’re going to take a quick look at the Elliott Wave charts of EURGBP , published in members area of the website. As our members know, EURGBP has incomplete bearish sequences in the cycle from the 08/28 […]
-
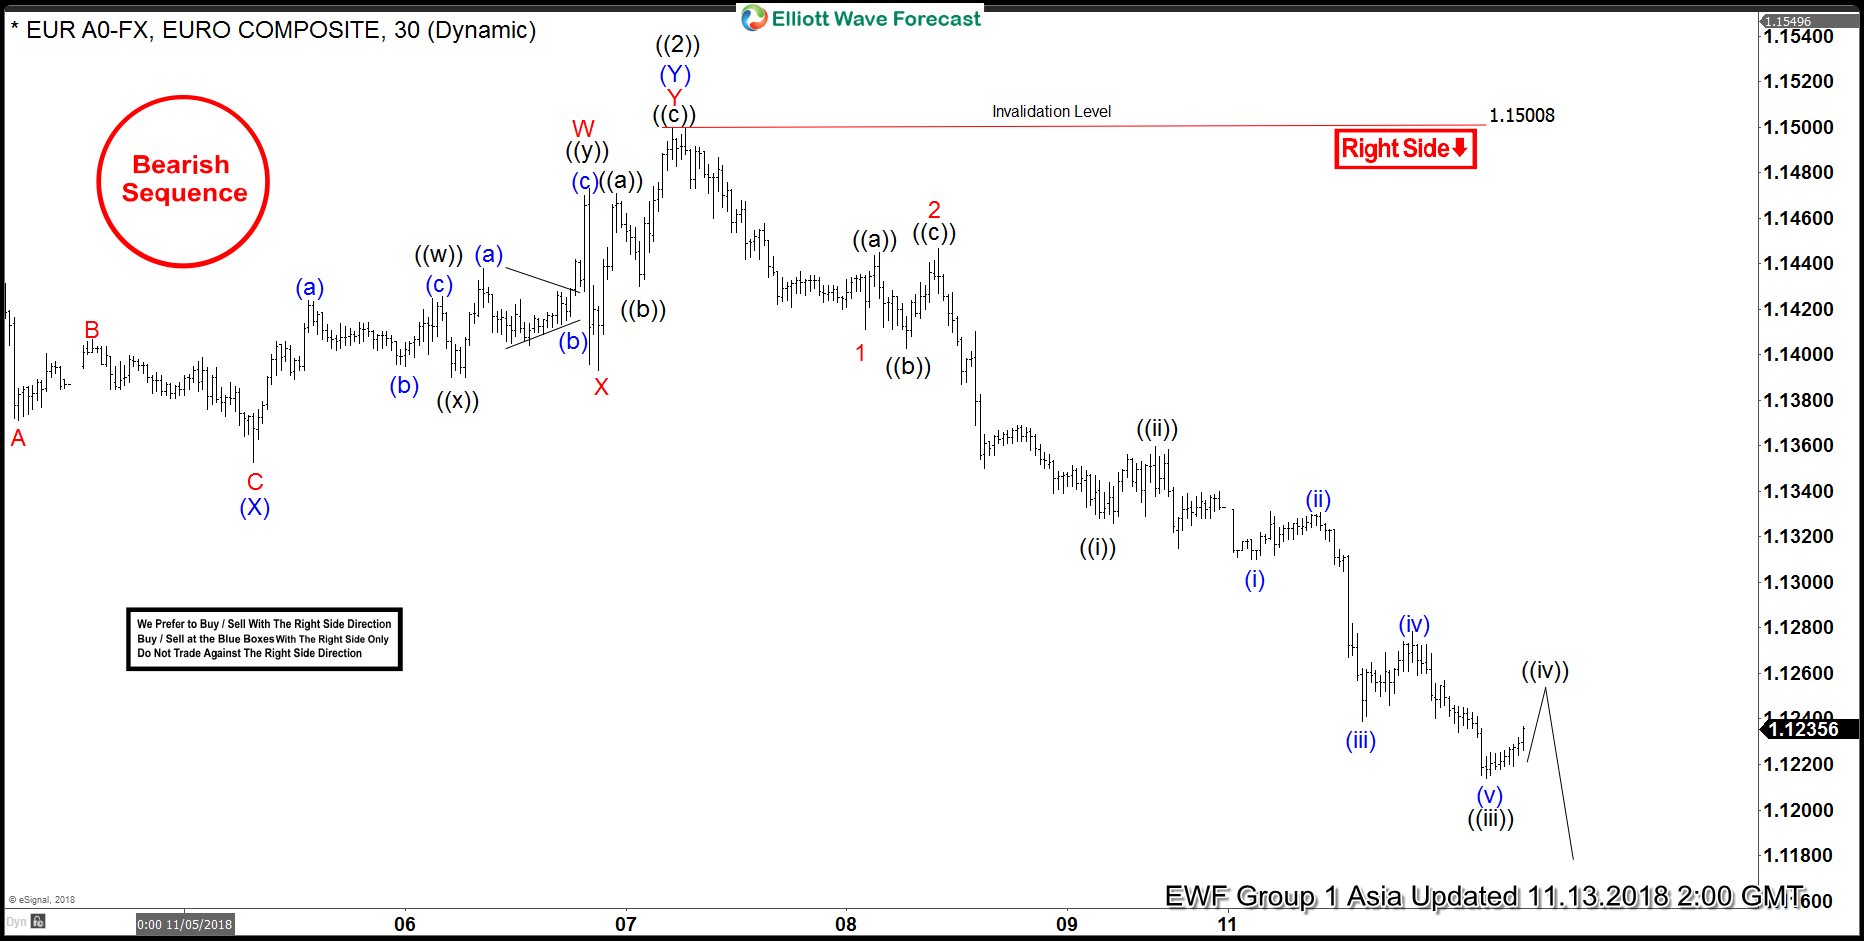
Elliott Wave Analysis: Further Downside Expected in EURUSD
Read MoreEURUSD has broken below Nov 1 low (1.13) and now the pair shows a 5 swing bearish sequence from Sept 24 high (1.1815), favoring further downside. Short term Elliott Wave view suggests that the move higher to 1.15 ended wave ((2)) in Primary degree. Internal of wave ((2)) unfolded as a double three Elliott Wave […]
-

Elliott Wave Analysis: GBPJPY in Correction Before Next Leg Higher
Read MoreShort Term Elliott wave view in GBPJPY suggests that the decline to 142.77 ended wave (2) in Intermediate degree. Up from there, the pair rallies as an impulse and ended Minor wave A at 149.49. Minor wave B pullback is currently in progress to correct cycle from Oct 26 low (142.77) before the next leg […]
-
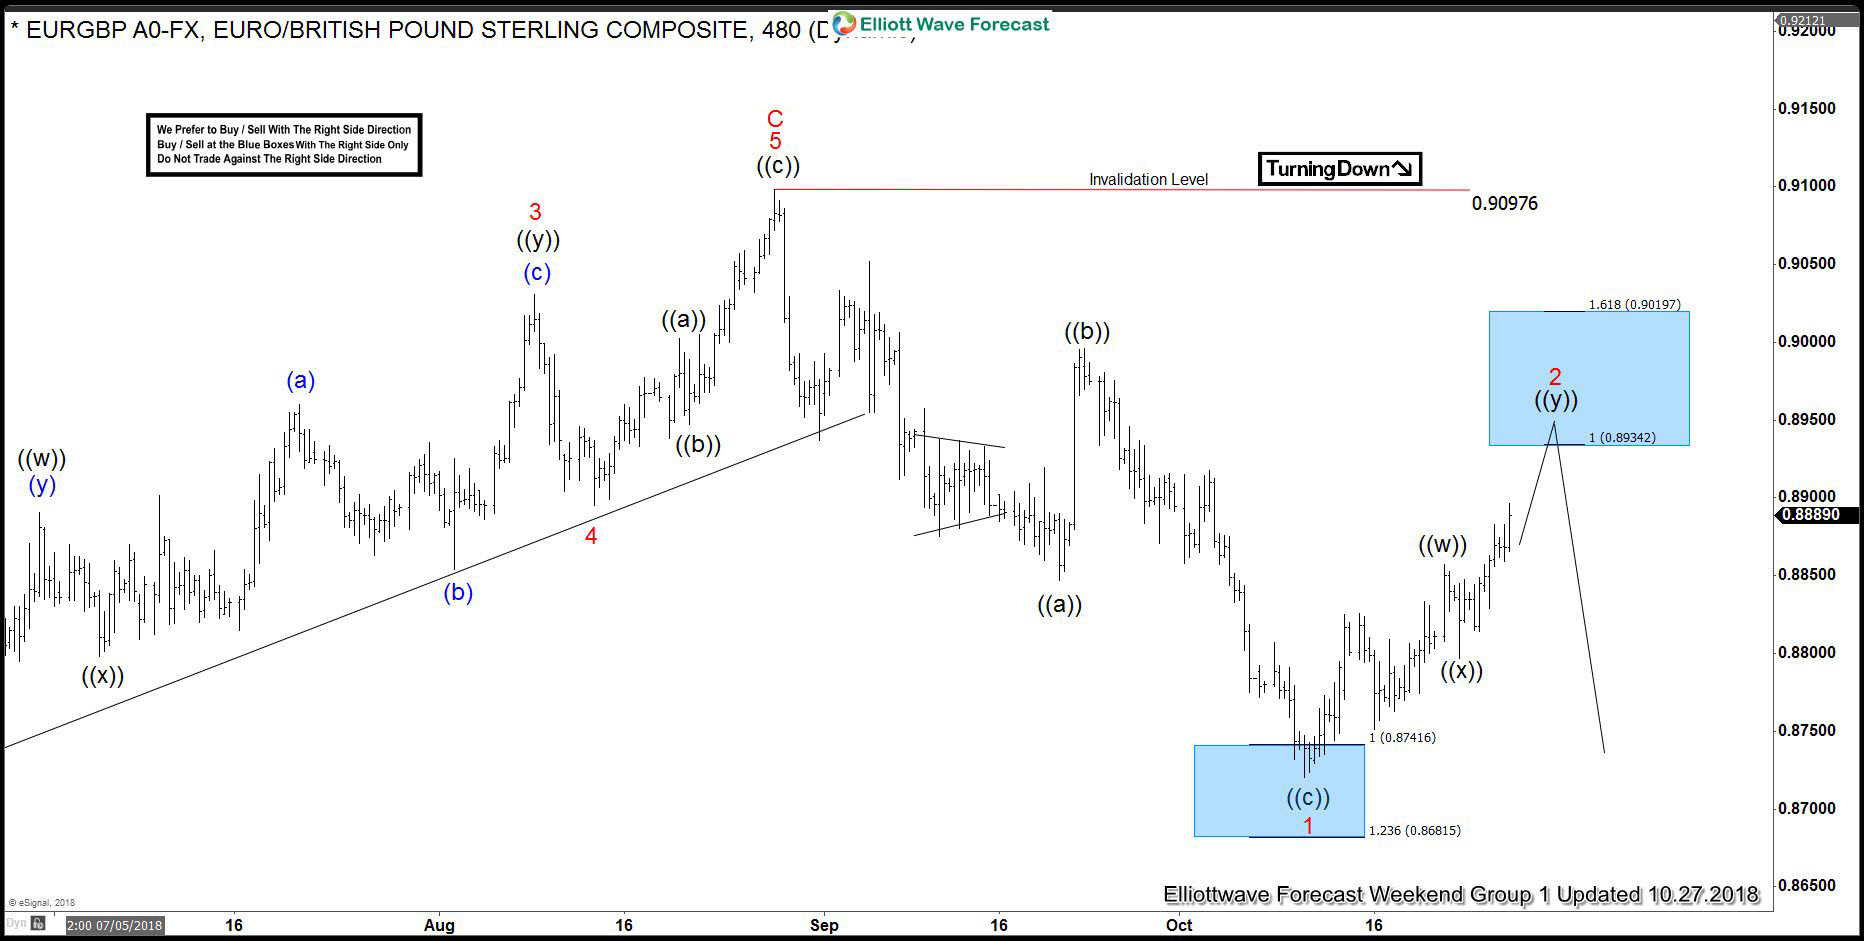
EURGBP Found Sellers After Double Three Pattern
Read MoreIn this technical blog we’re going to take a quick look at the past Elliott Wave charts of EURGBP published in members area of the website. We’ll explain the Forecast and the Price Structure. As our members know EURGBP has ended April 2018 cycle at the 0.90976 peak. We were calling for pottential turn lower […]
-
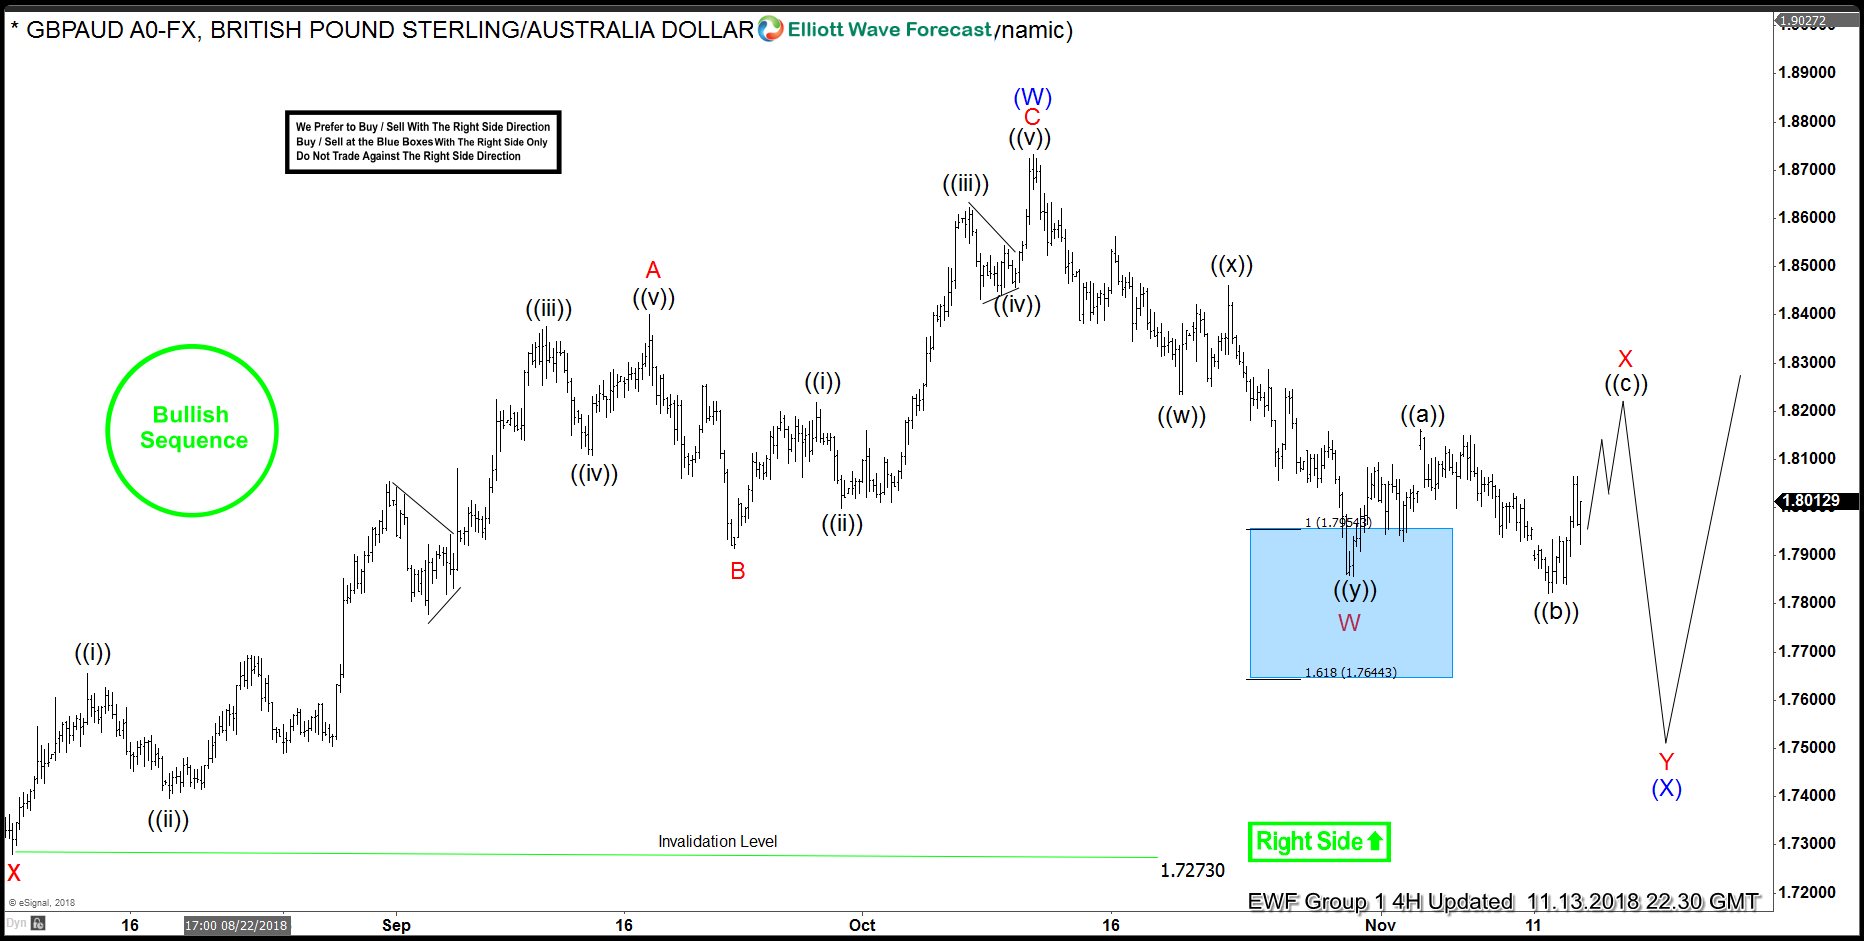
Brexit Progress May Turbocharge Poundsterling
Read MoreThere’s no question the most important risk event and near term key driver for Poundsterling remains to be Brexit. This month may shape up to be an important week for Poundsterling as Prime Minister Theresa May’s Cabinet discusses about it throughout the month of November. The Sunday Times reports last weekend that Mrs. May has […]