
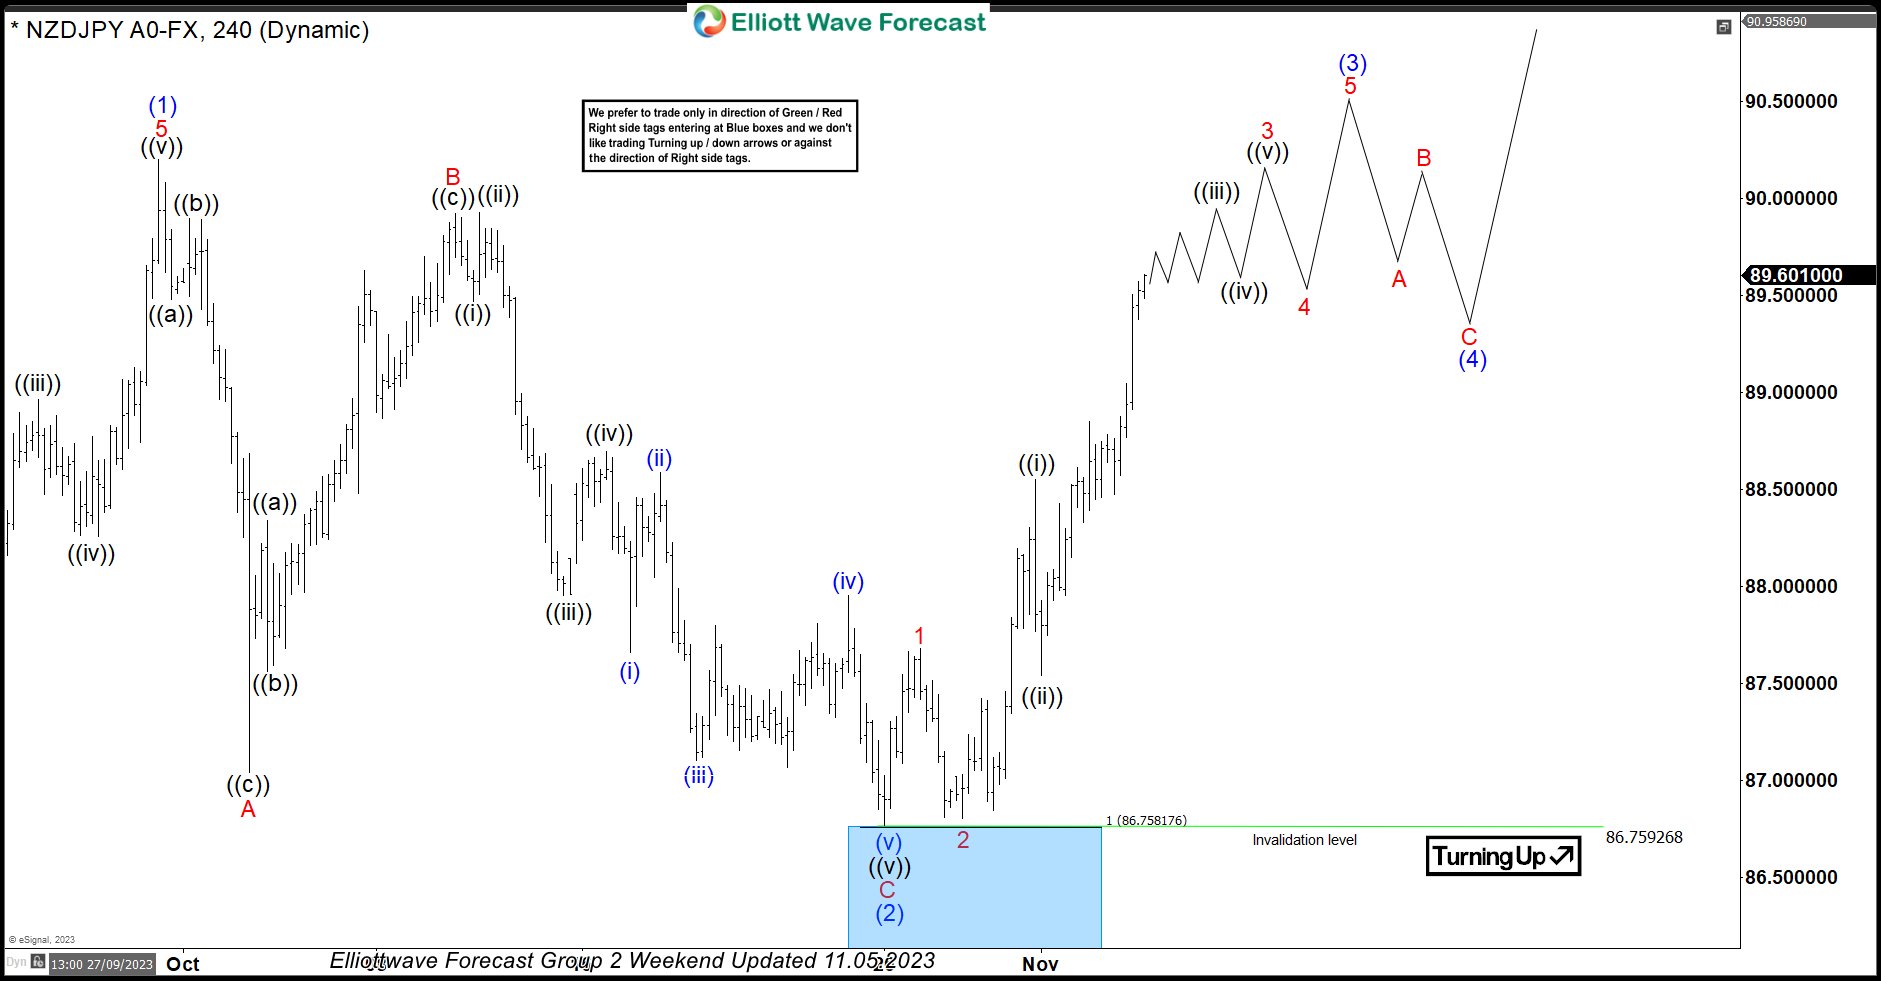
In this technical blog, we will look at the past performance of the 4-hour Elliott Wave Charts of NZDJPY. In which, the rally from 24 March 2023 low unfolded as an impulse sequence and showed a higher high sequence. Therefore, we knew that the structure in NZDJPY is incomplete to the upside & should extend higher. So, […]
-
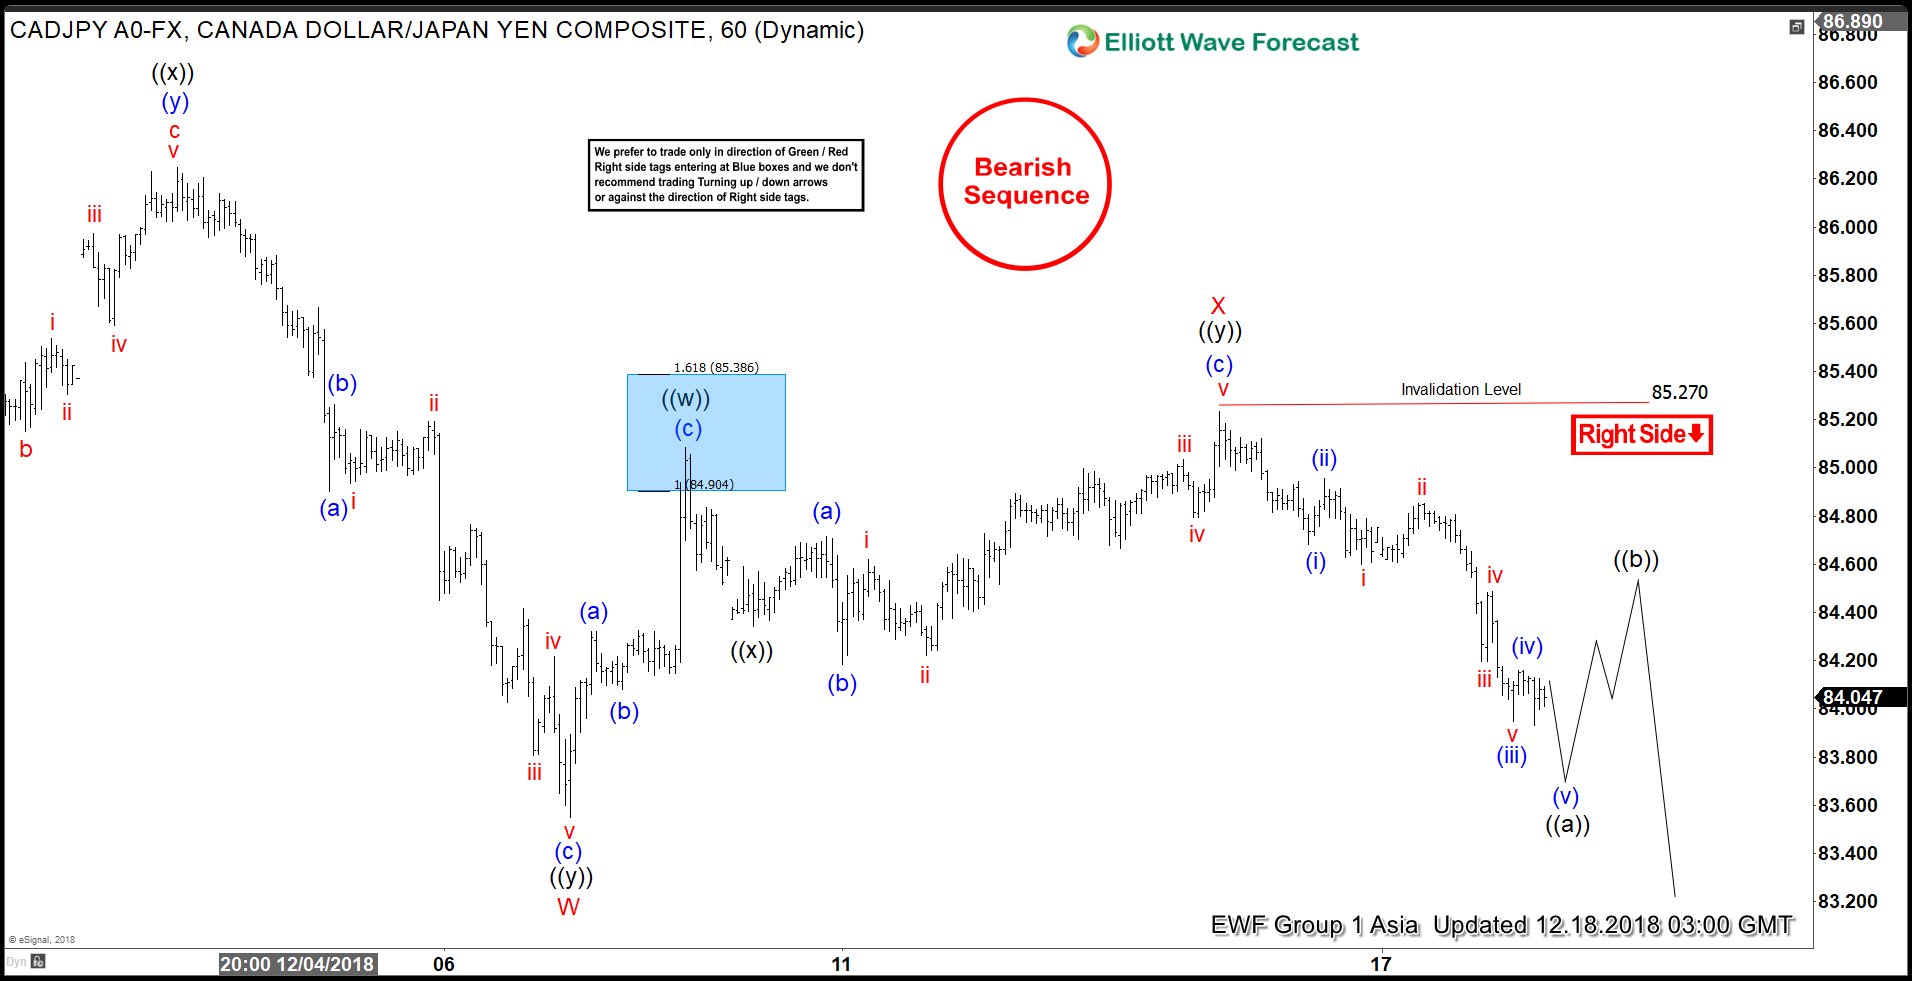
Elliott Wave View: CADJPY Selloff To Resume
Read MoreShort Term Elliott Wave view suggests that cycle from 11.8.2018 high (87) ended at 83.55 in Minor wave W and bounce to 85.27 ended Minor wave X. Pair has resumed lower in Minor wave Y, but it needs to break below Minor wave W at 83.55 for confirmation and to avoid double correction in Minor wave […]
-
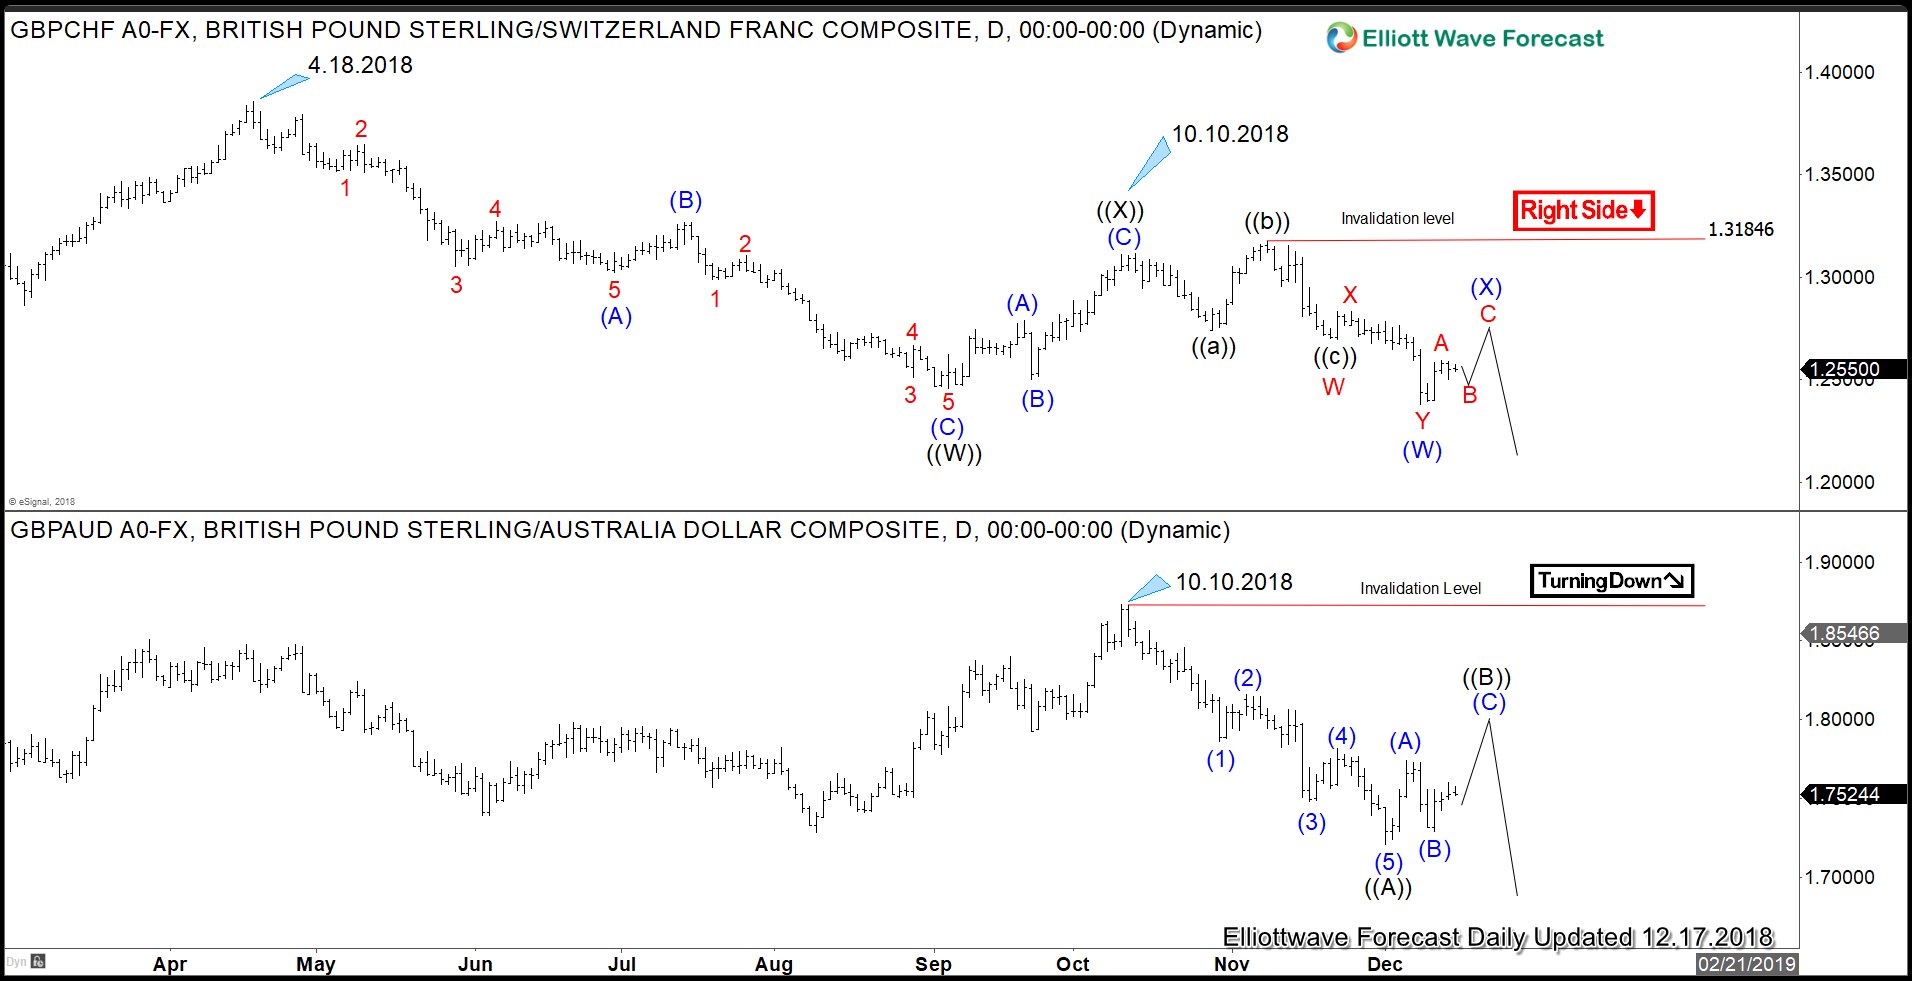
Brexit Uncertainty to Continue Put Pressure on Poundsterling
Read MoreThe Brexit saga continues to unfold as Prime Minister Theresa May postponed Brexit deal vote in U.K Parliament last week. The cancellation happened after it becomes clear that May will lose the vote by large margin if she forces it through the Commons. Subsequently, Ms. May survived a confidence vote in her own party and […]
-
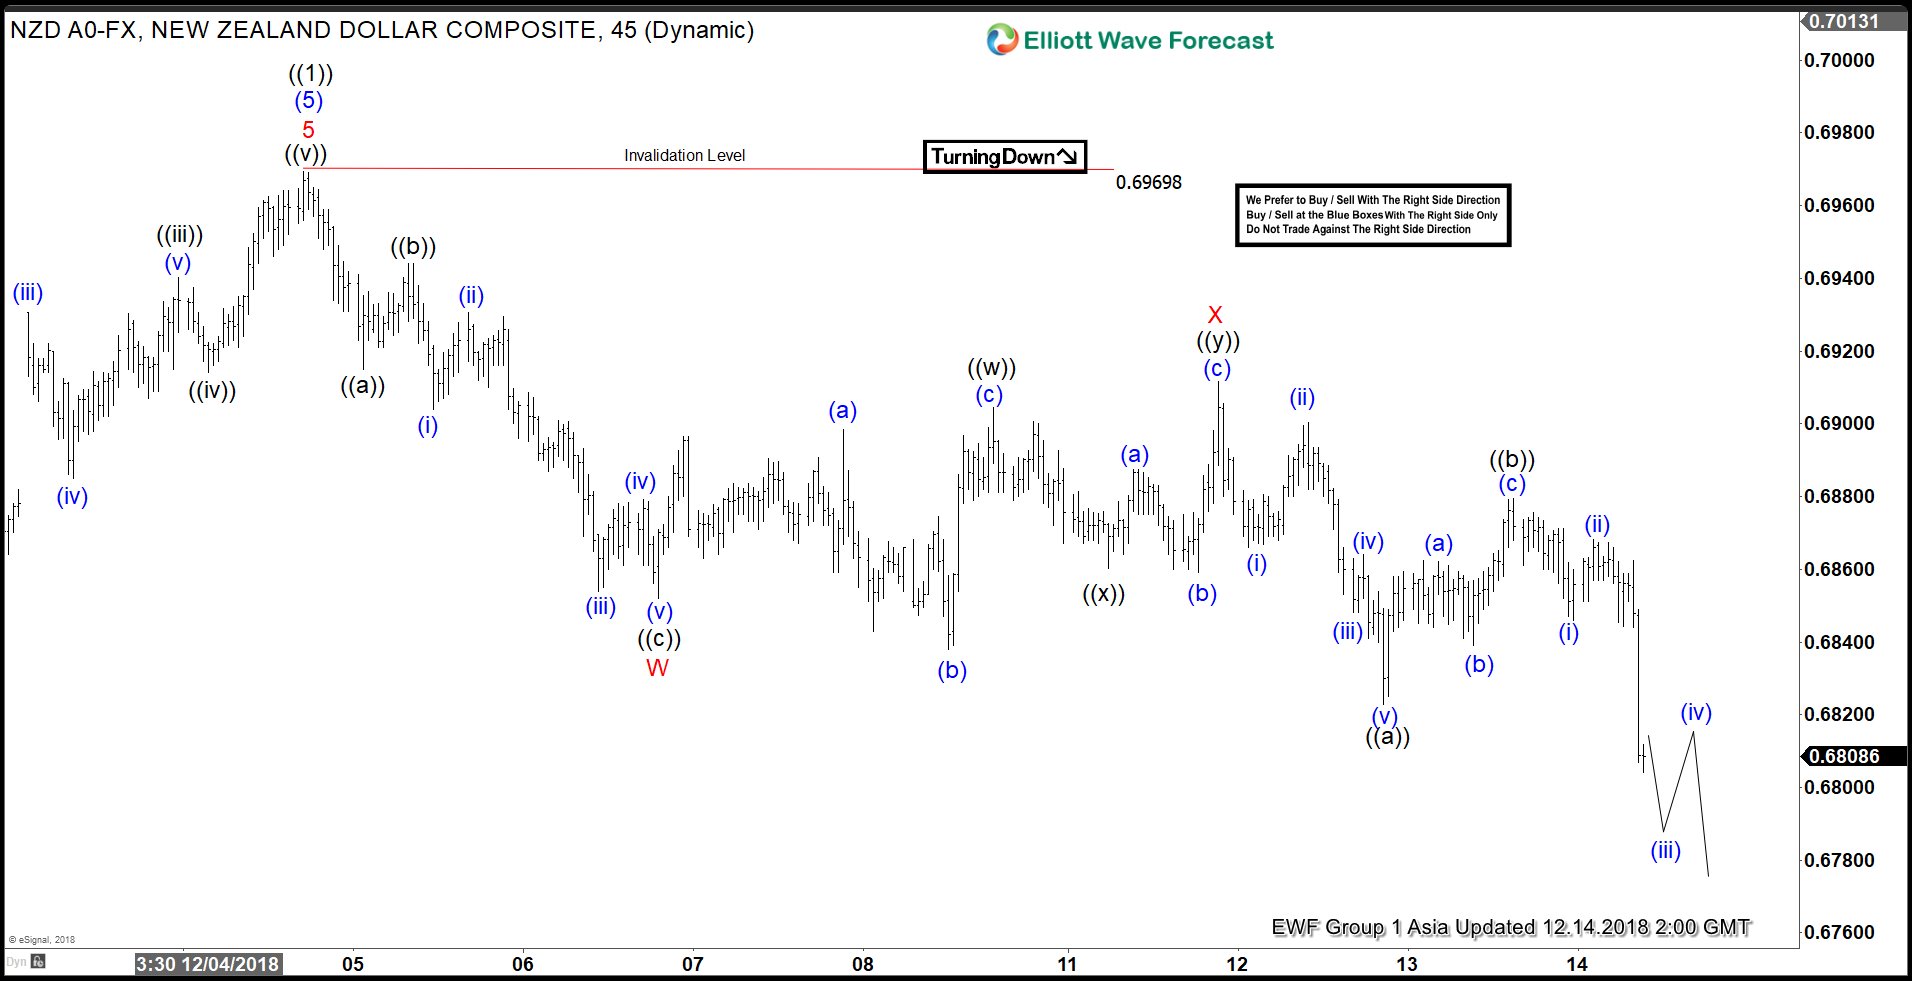
Elliott Wave View: NZDUSD Pullback In Progress
Read MoreShort Term Elliott Wave view suggests that cycle from Oct 8 low (0.642) has ended at 0.697 high as Primary wave ((1)). Pair is now in the process of correcting the rally from Oct 8 low in 3, 7, or 11 swing within Primary wave ((2)). Decline from 0.6968 is unfolding as a double three […]
-
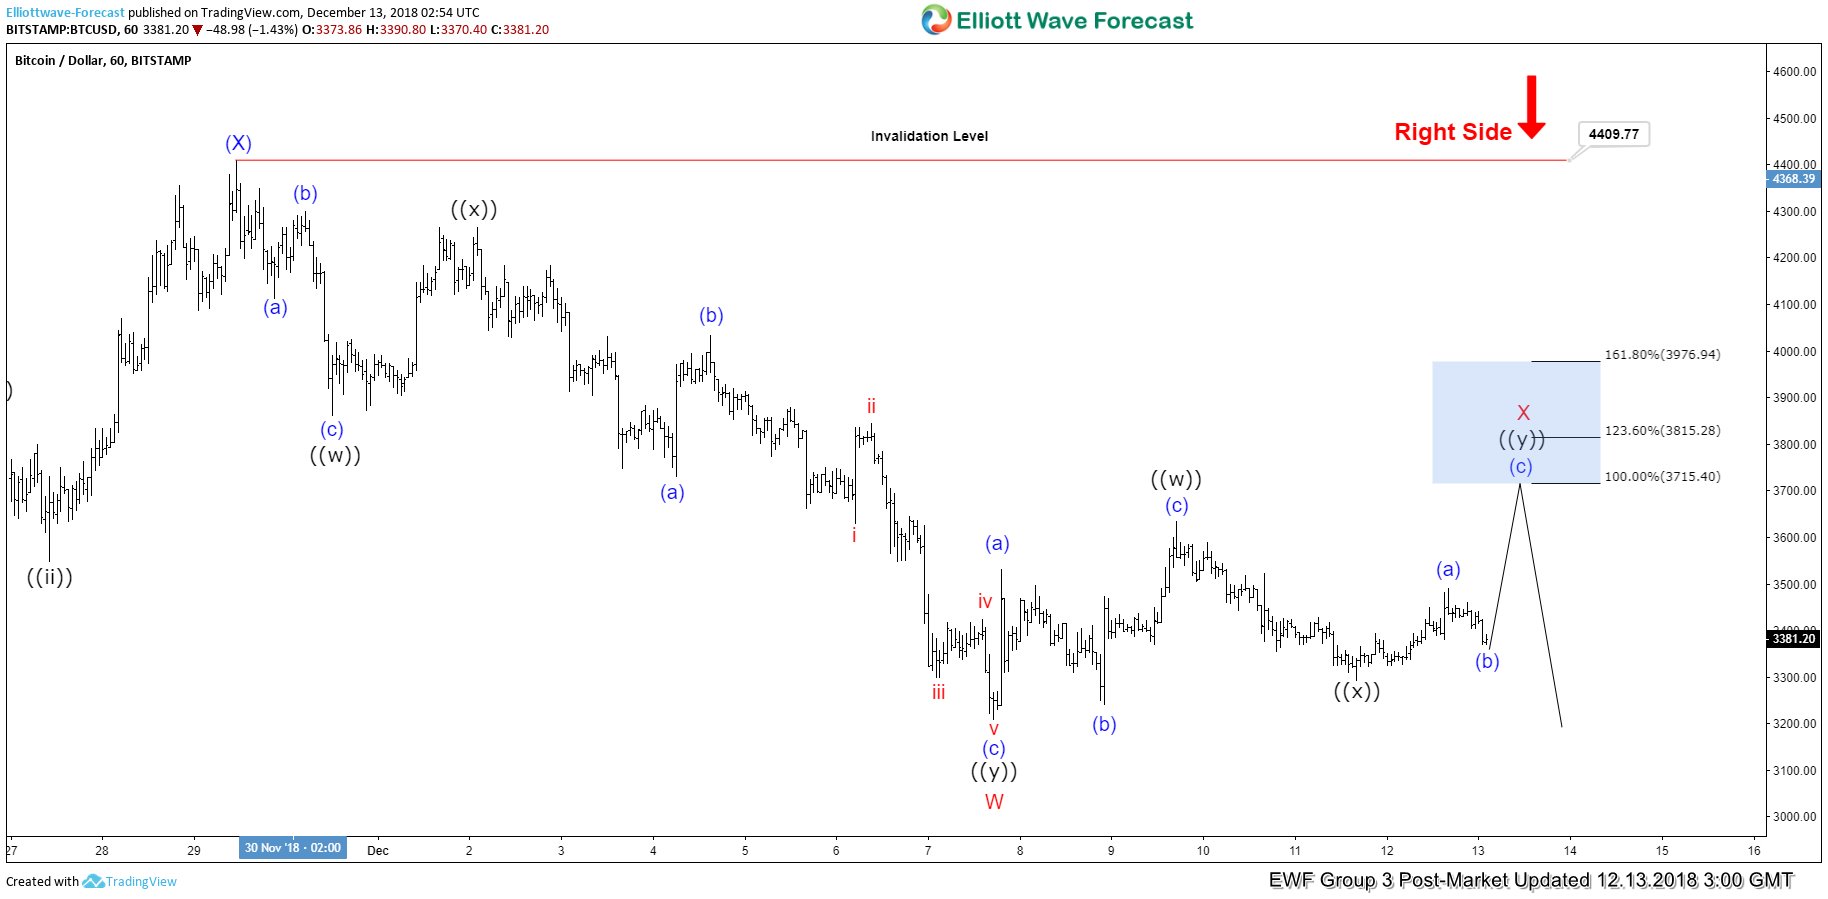
Elliott Wave View Suggests Bitcoin Selloff Not Over
Read MoreShort Term Elliott Wave view suggests that the selloff in Bitcoin is not yet over. Rally to $4409.77 ended Intermediate wave (X). Down from there, the decline is unfolding as a double three Elliott Wave structure where Minor wave W ended at $3210. Internal of Minor wave X unfolded also as a double three Elliott […]
-
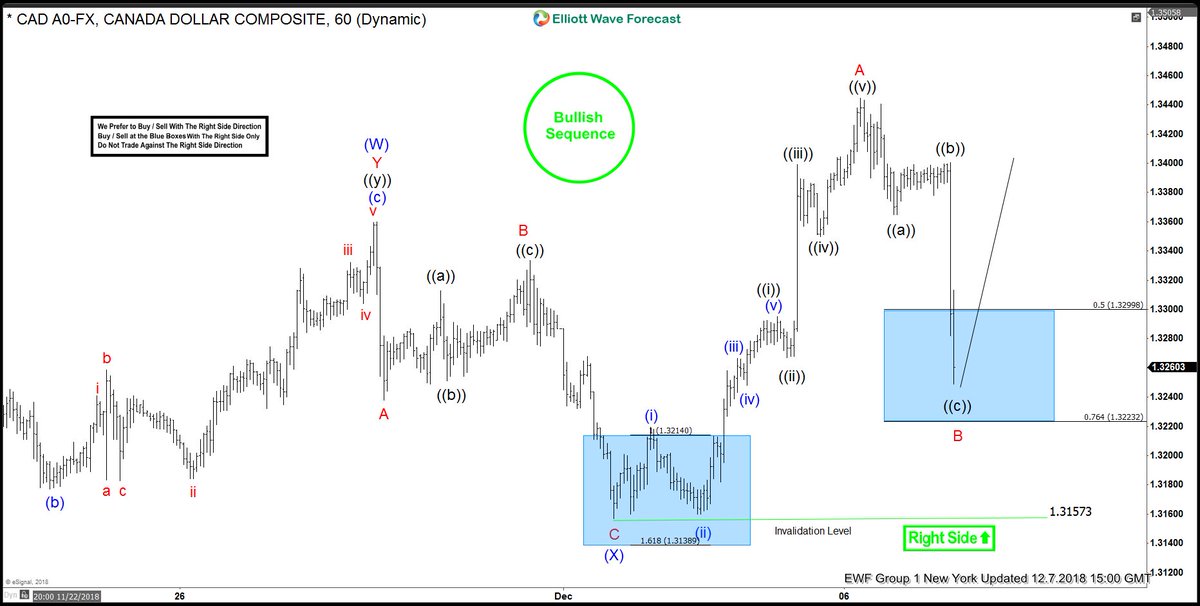
USDCAD Buying The Elliott Wave Dips
Read MoreIn this technical blog, we are going to take a look at the past performance of USDCAD, 1 hour Elliott Wave charts that we presented to our clients. We are going to explain the structure and the forecast below. USDCAD 1 Hour Elliott Wave Chart From 12/06/2018 Above is the 1 hour Chart from 12/06/2018 Asia update, […]
-
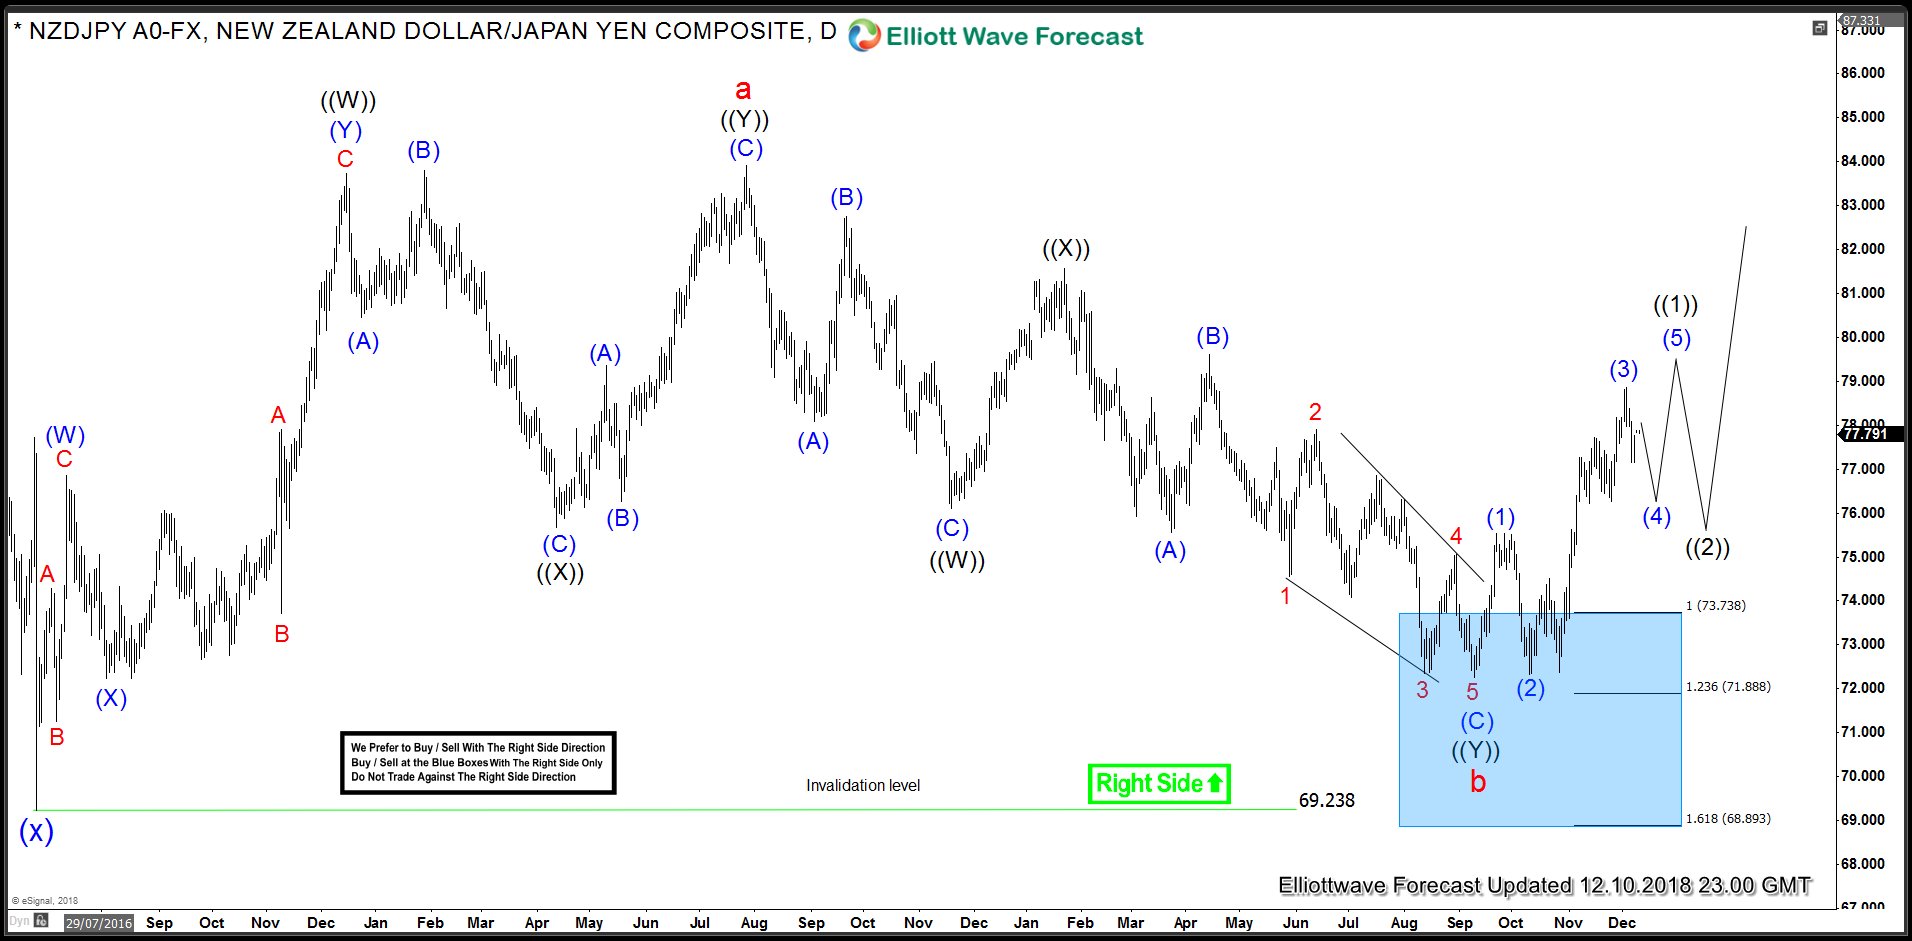
NZDJPY Blue Box Generates 600 Pips
Read MoreNZDJPY has put in a strong rally over the past couple of months gain 9.14% from a low of 72.25 to a high of 78.86. Earlier this year, we advised clients and followers that pair was reaching an inflection area between 73.70 – 68.86 and pair should find a low in this area and start […]