
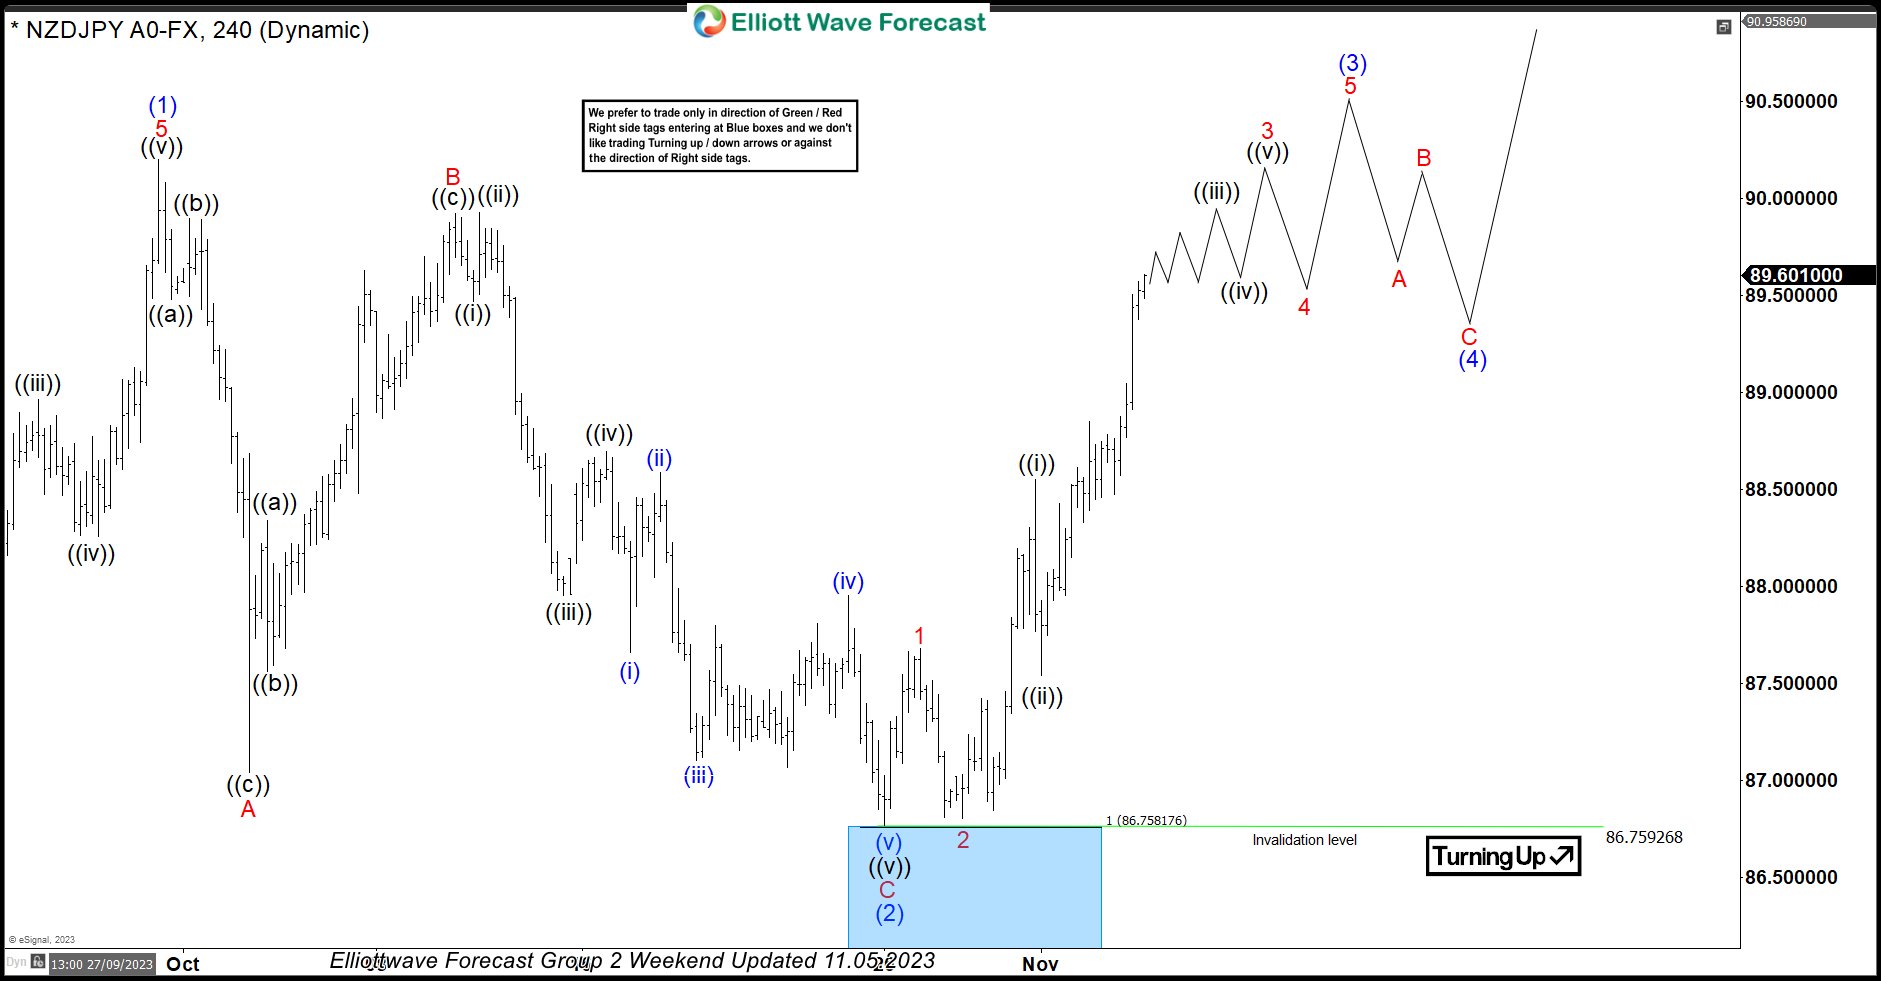
In this technical blog, we will look at the past performance of the 4-hour Elliott Wave Charts of NZDJPY. In which, the rally from 24 March 2023 low unfolded as an impulse sequence and showed a higher high sequence. Therefore, we knew that the structure in NZDJPY is incomplete to the upside & should extend higher. So, […]
-
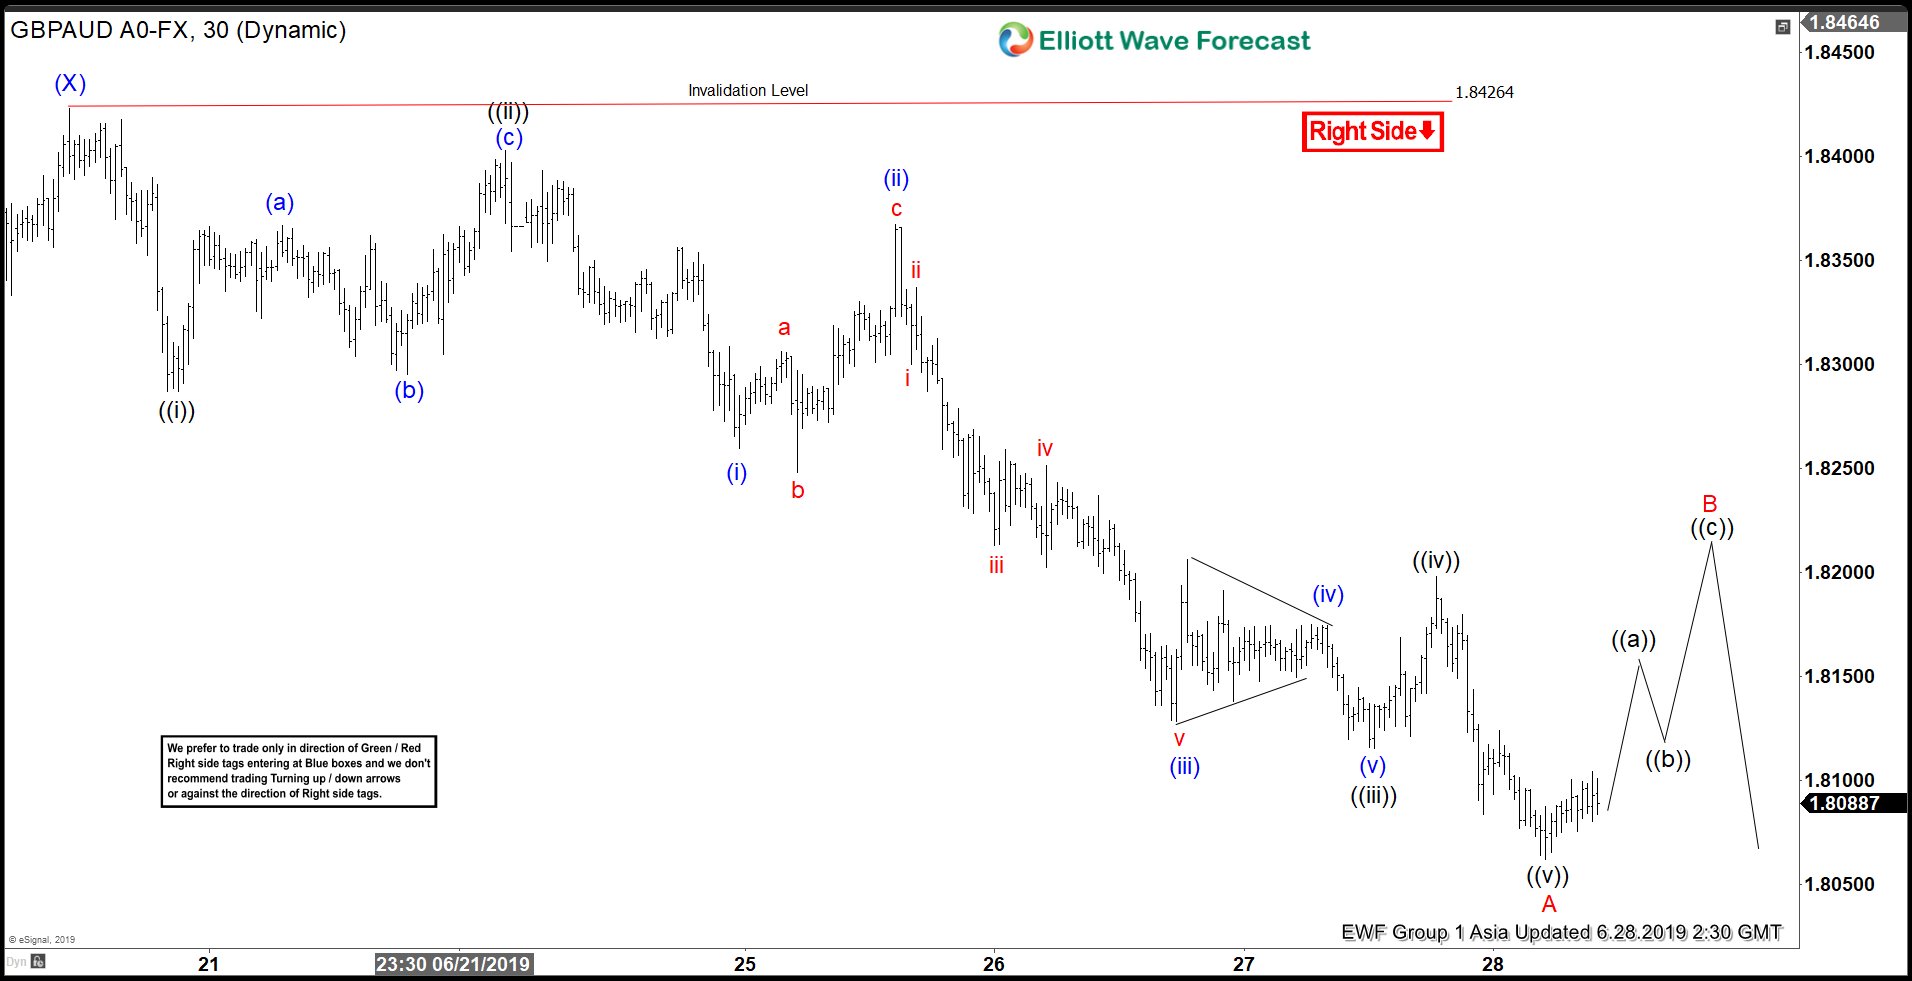
Elliott Wave View: GBPAUD Rally Should Find Sellers
Read MoreGBPAUD shows 5 swing bearish sequence from May 6 high, favoring more downside. This article and video show the Elliott Wave path.
-
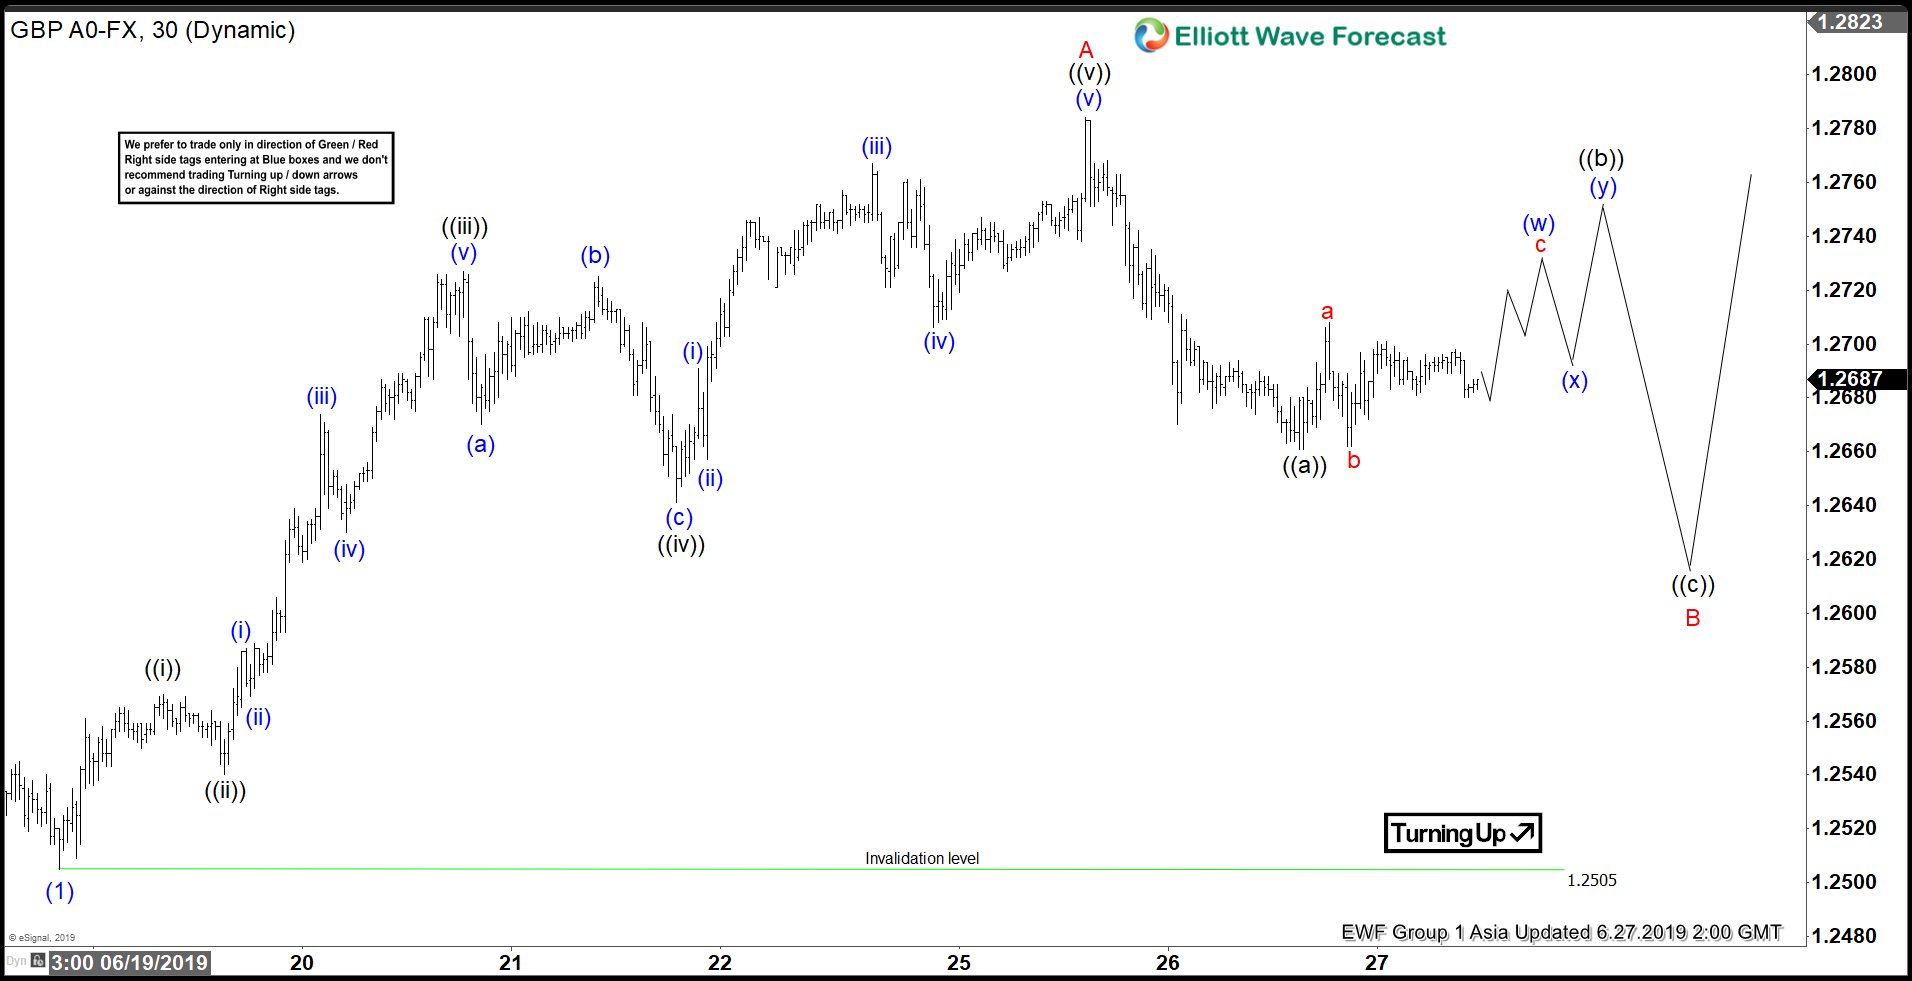
Elliott Wave View: GBPUSD Impulse Looking for Further Upside
Read MoreGBPUSD shows a 5 waves impulse structure from June 18 low favoring more upside. This article and video shows the short term Elliott Wave path.
-
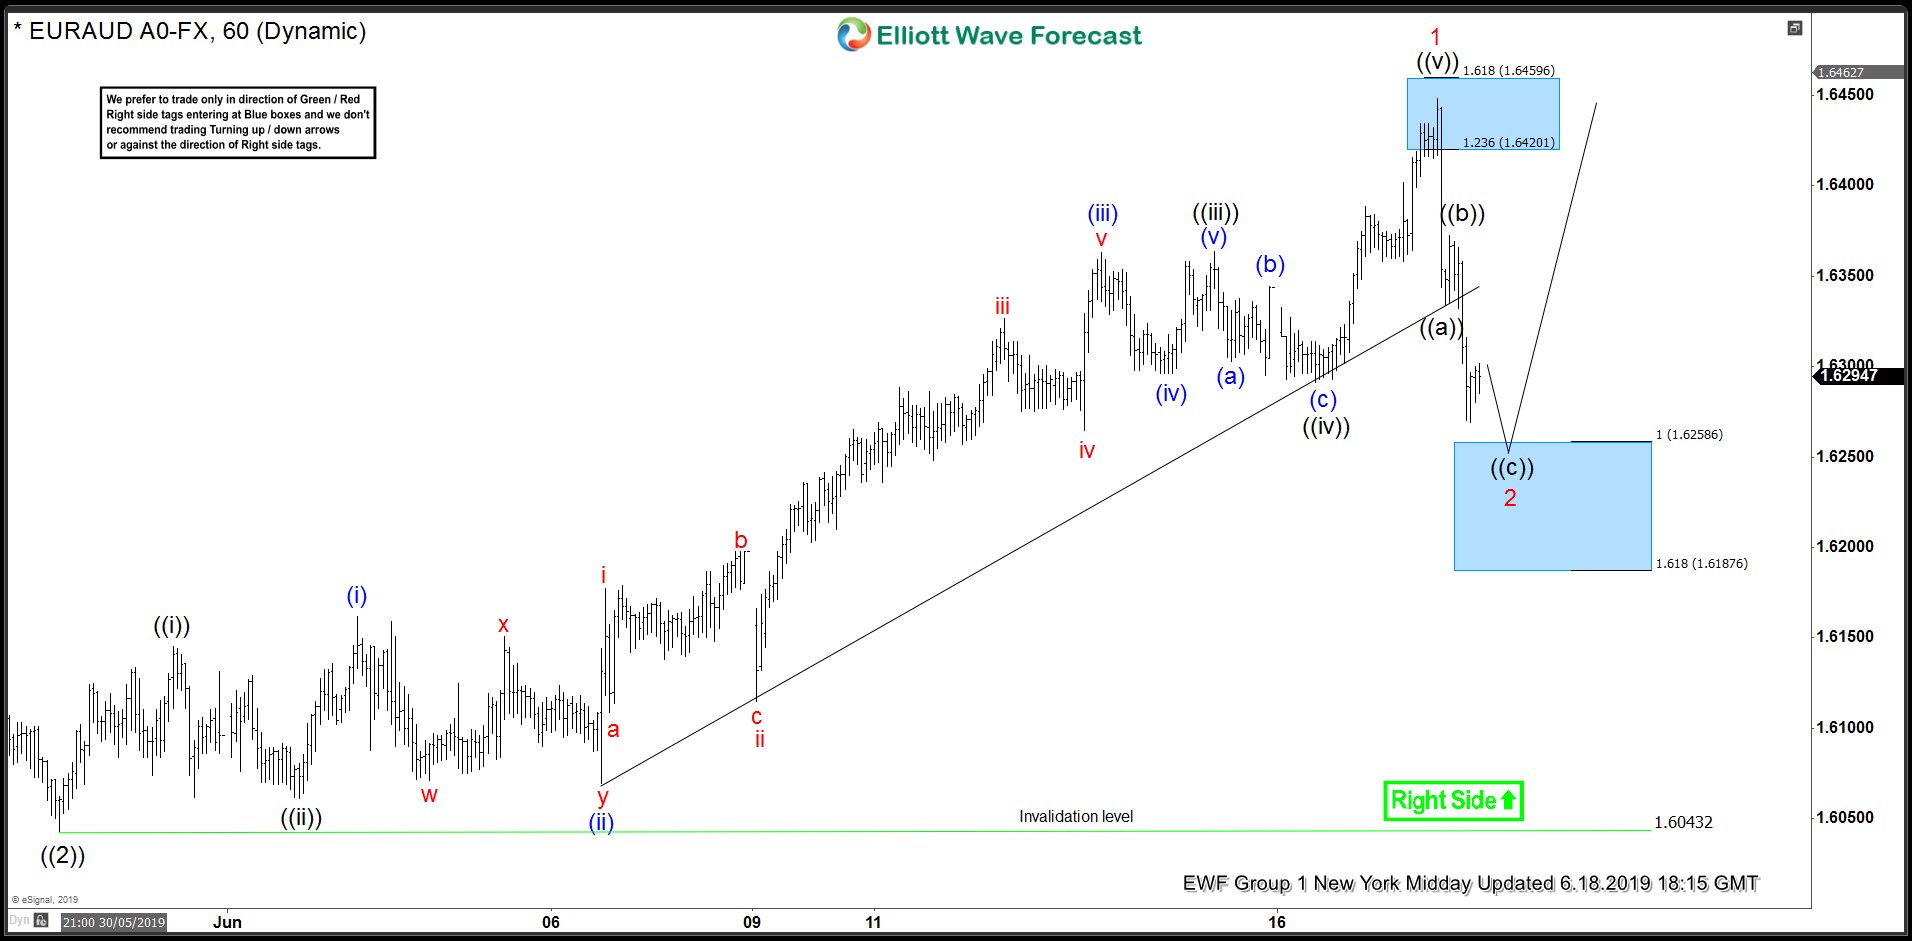
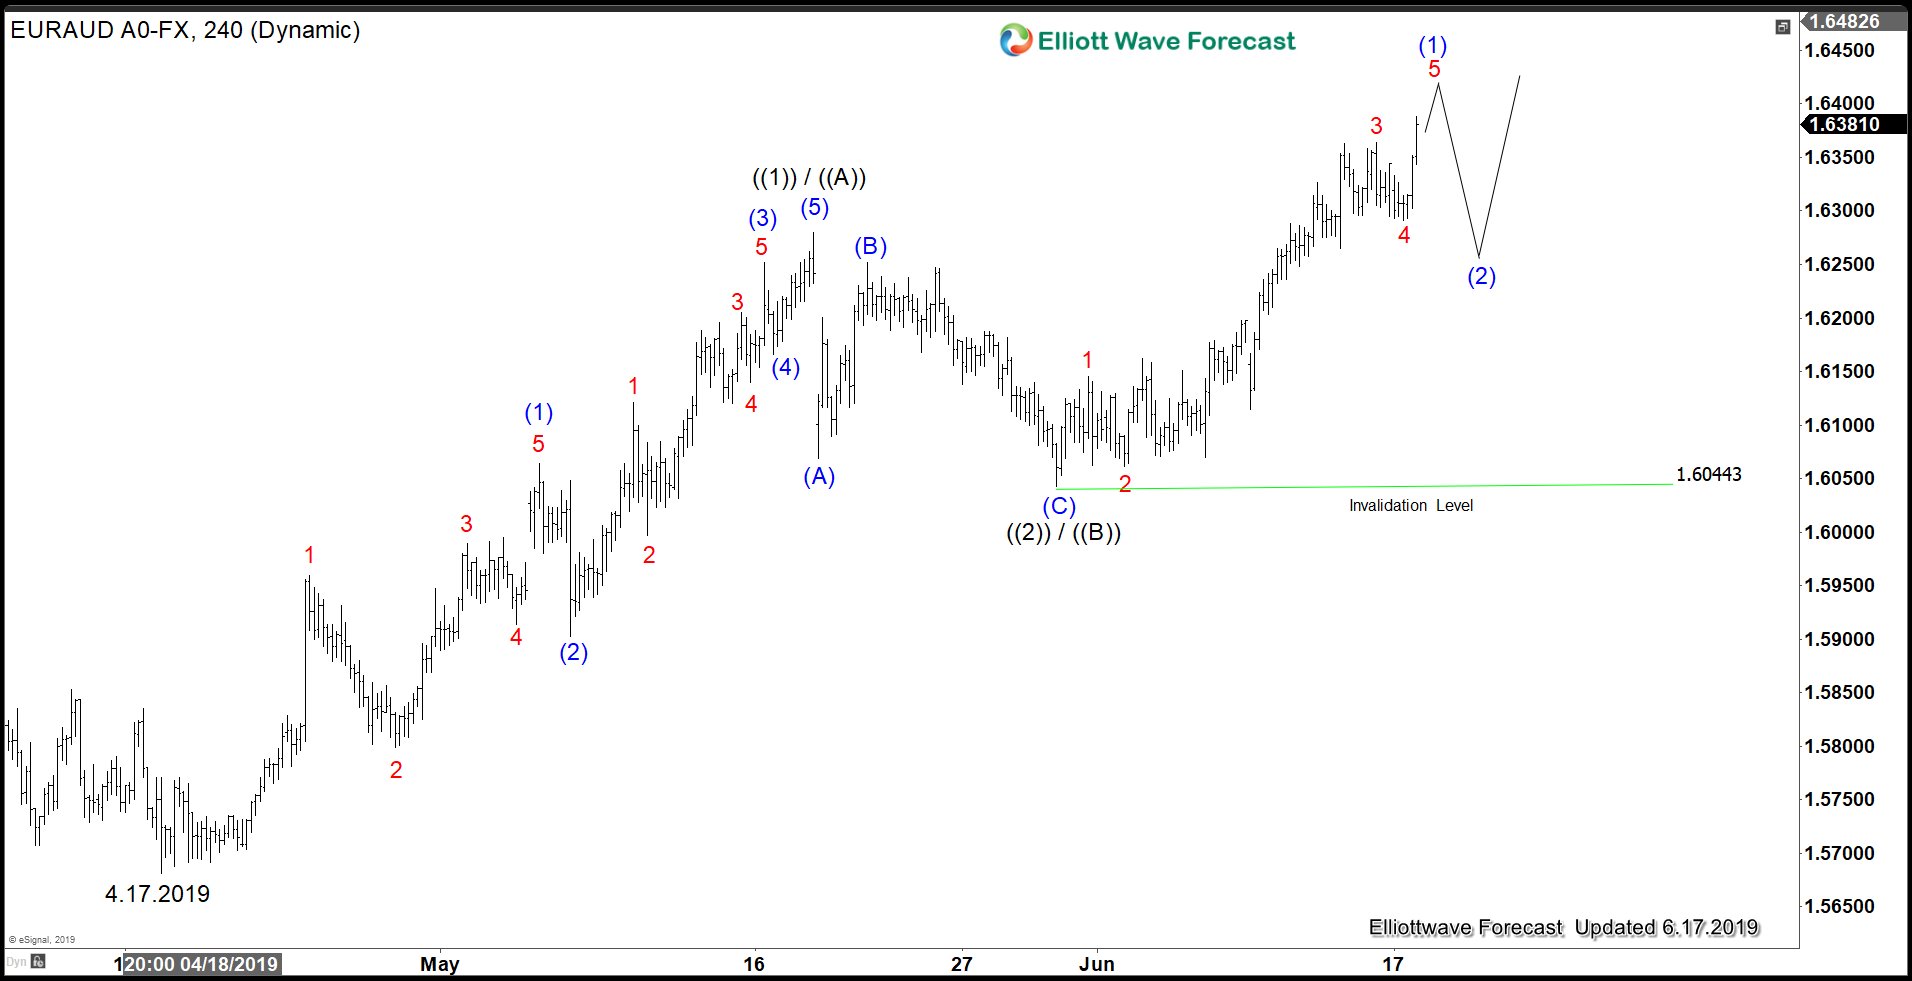
EURAUD Found Buyers In Blue Box And Rallied
Read MoreHello fellow traders. In this technical blog we’re going to take a quick look at the Elliott Wave charts of EURAUD. As our members know EURAUD has incomplete bullish sequences in the cycle from the 04/17 low. Break of the 05/17 peak made the pair bullish against the 1.6043 low, calling for further strength. Consequently, […]
-
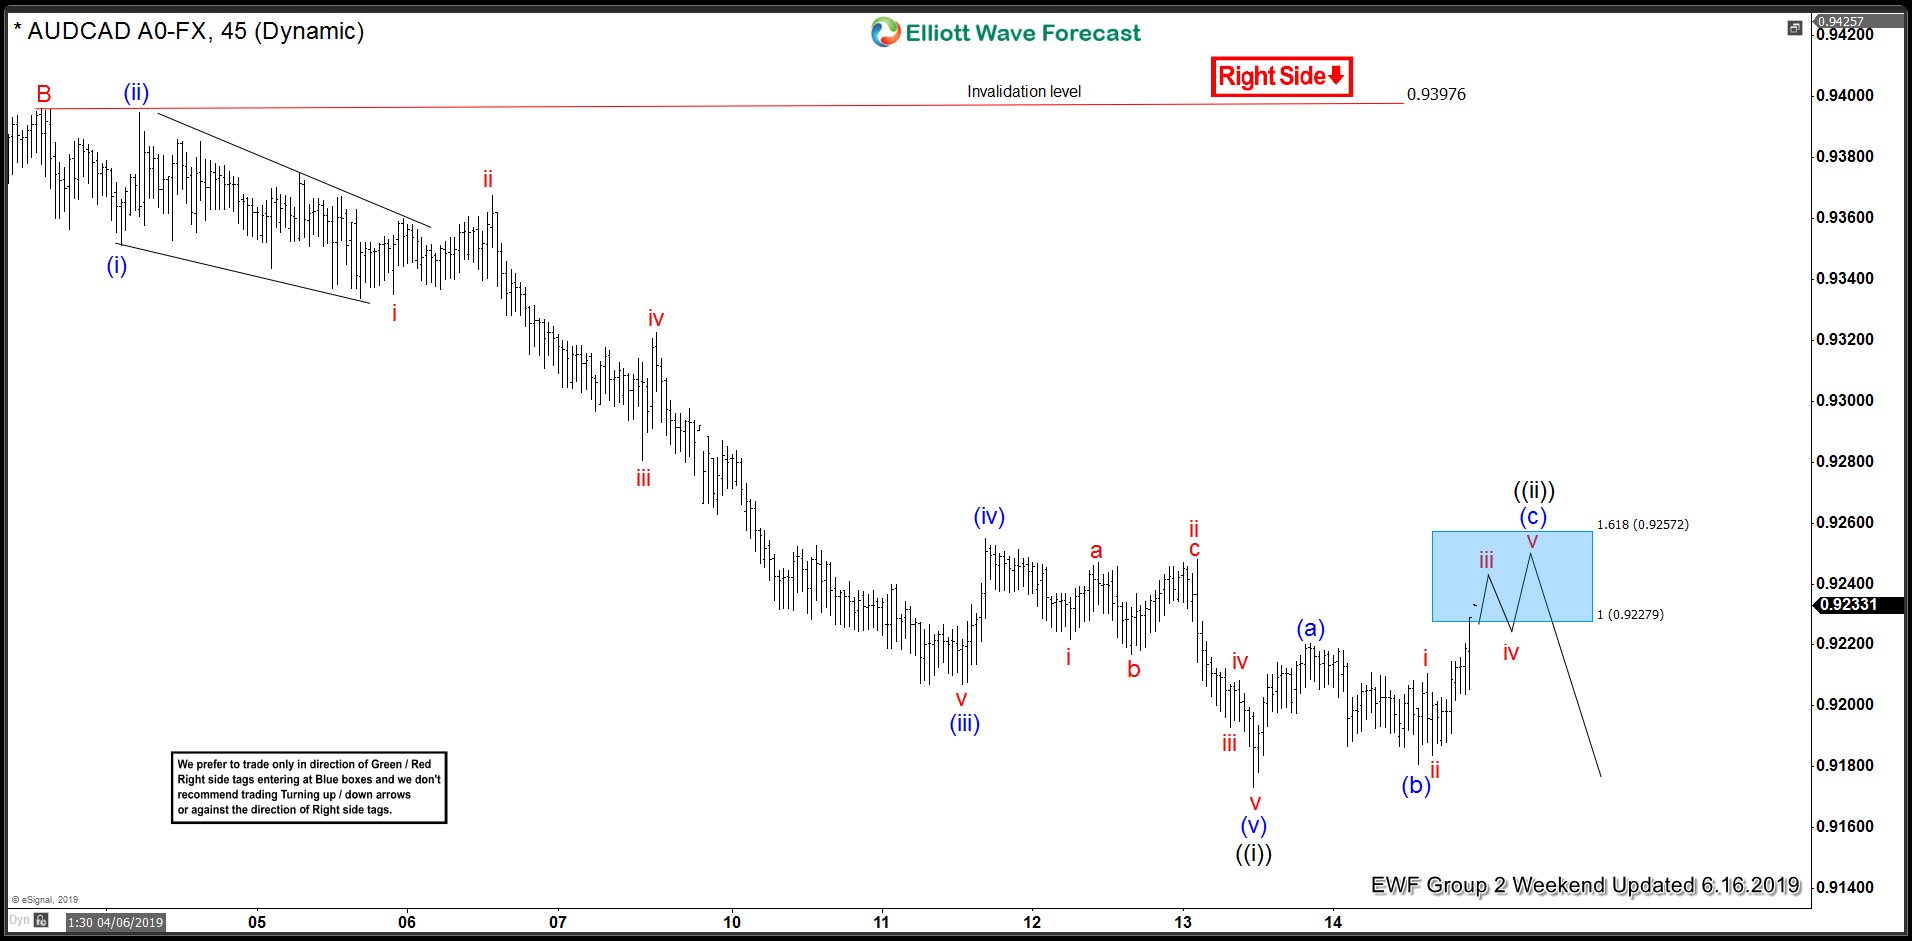
Elliott Wave: High Frequency Box Suggested AUDCAD Sell Off
Read MoreI want to share with you an Elliott Wave chart of AUDCAD which we presented on the weekend update in the past. You see the 1-hour updated chart presented to our clients on the 6/16/19. AUDCAD had a 1-hour right side tag against 0.9397 peak suggesting more downside. The pair ended the cycle from 06/04/19 peak in black […]
-
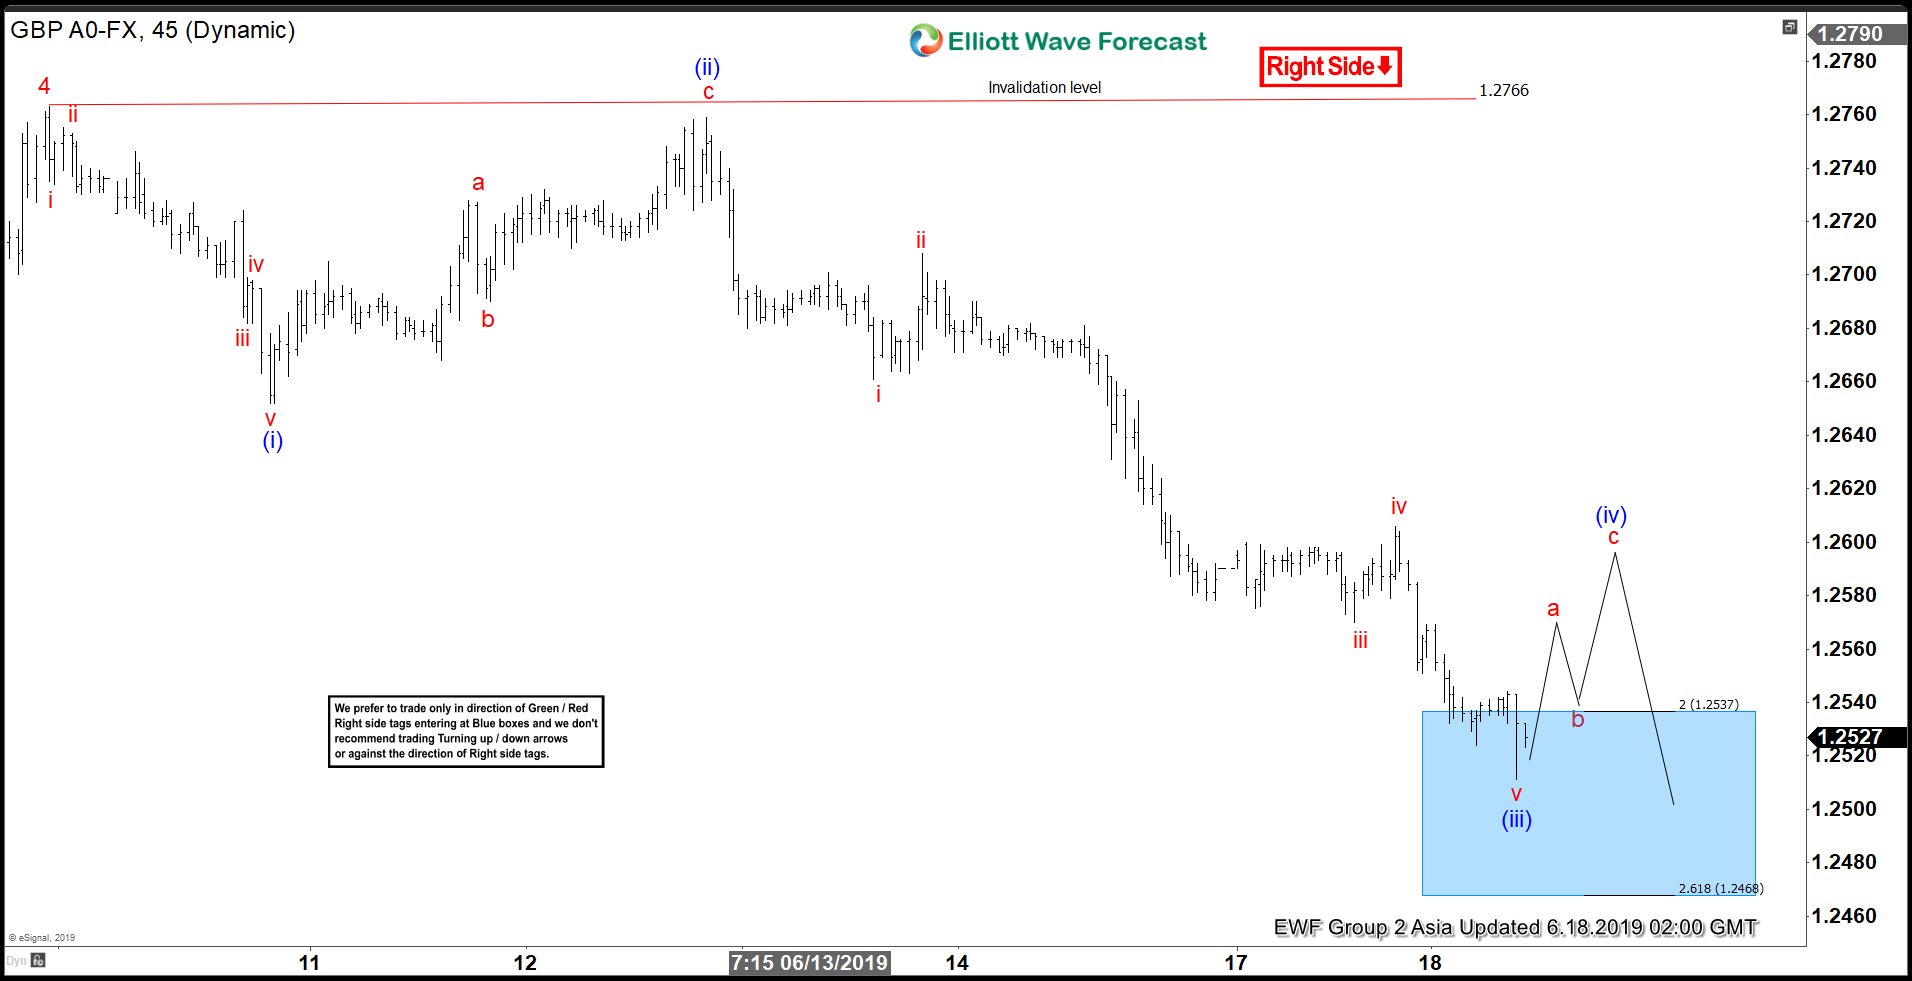
Elliott Wave View: Further Weakness in GBPUSD Expected
Read MoreShort Term Elliott wave view in GBPUSD suggests the decline from June 7 high is unfolding as an impulse Elliott Wave structure. Down from 1.276, wave (i) ended at 1.265 with internal as an impulse in lesser degree. Wave (ii) bounce ended at 1.276 as a zigzag Elliott Wave structure. Pair has now reached 200% […]
-
Australian Dollar Extends Weaknesses
Read MoreAustralian Dollar dropped further last week as unemployment figure came out higher than expected at 5.2%. The consensus has been for a dip to 5.1%. Australian unemployment rate has now risen 0.3% since February. The official number has raised speculation that further interest rate cut will come. RBA (Reserve Bank of Australia) has been fighting […]