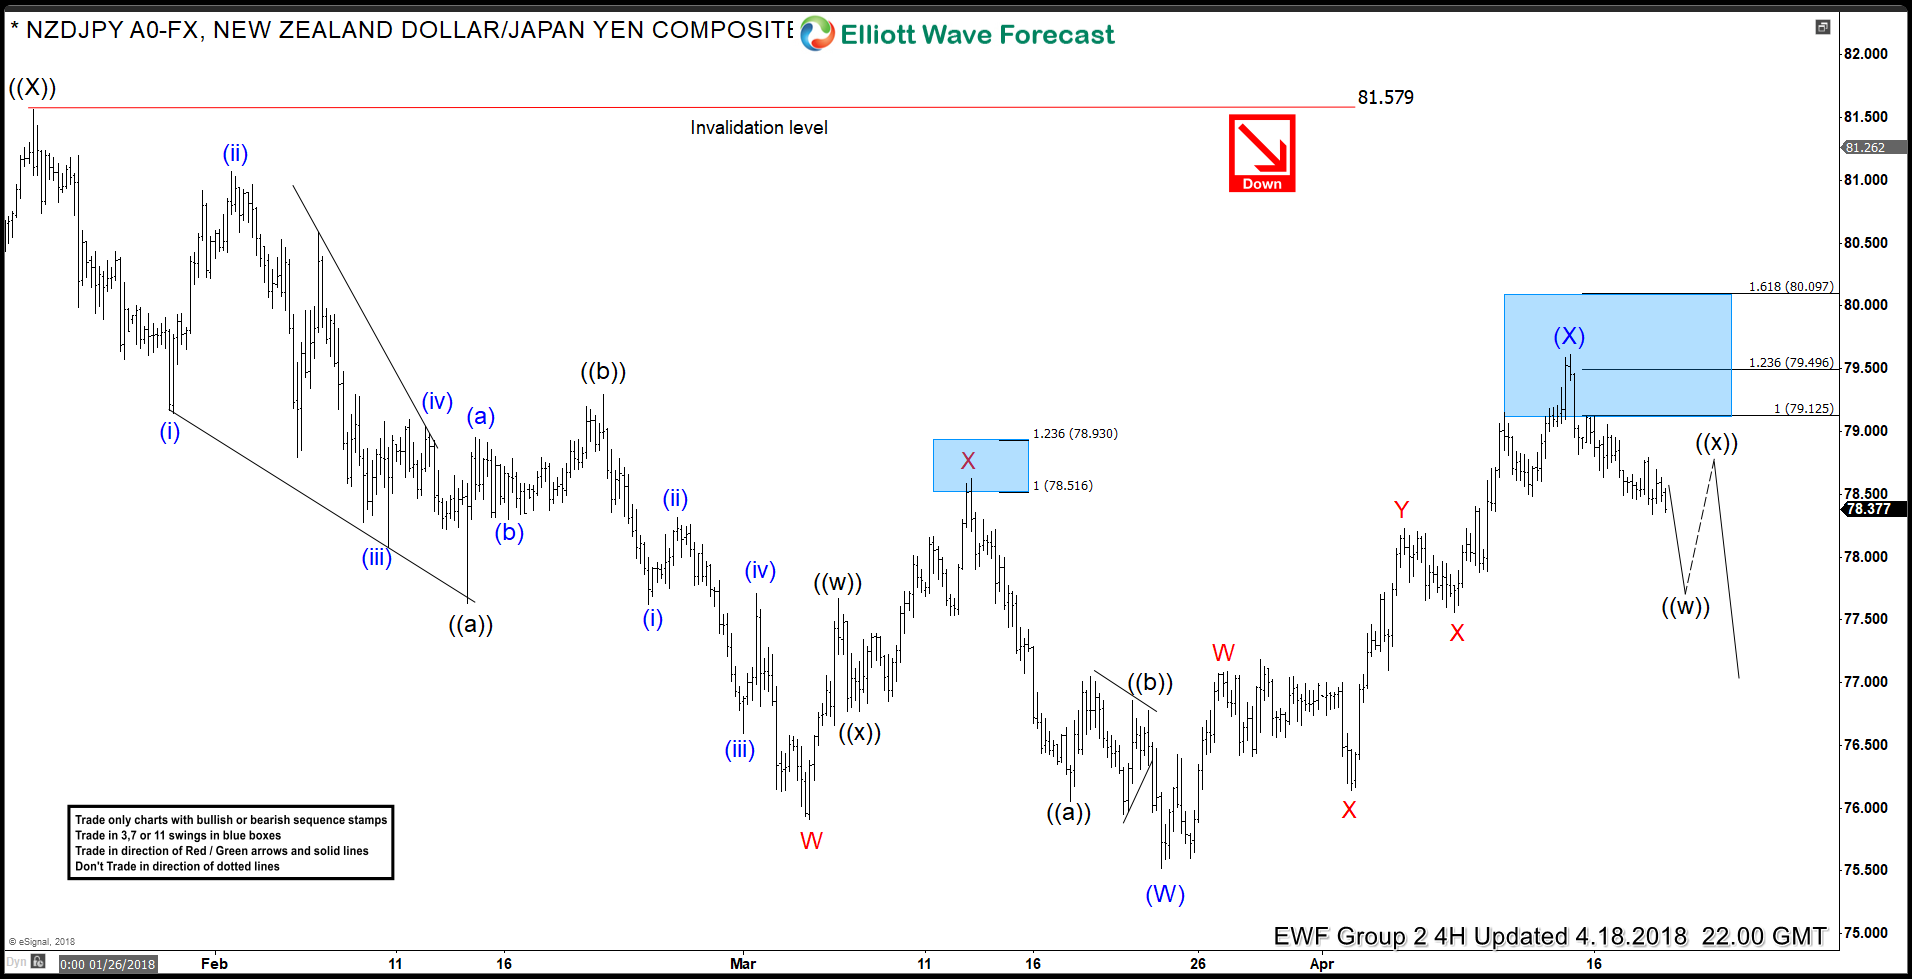
NZDJPY decline from 7.27.2017 (83.91) is so far in 5 swings which is an incomplete bearish sequence. In Elliott wave terms, decline is taking the form of a double three (WXY) structure where wave (A) of ((W)) ended at 78.09, wave (B) of ((W)) ended at 82.75 and wave ((W)) completed at 76.09. Rally to 81.56 completed wave ((X)) after which pair made a new low to 75.54 on 3.23.2018, this completed wave (W) of ((Y)) and pair then bounced to correct the decline from 81.56 peak. The bounce took the form of a triple three 11 swings structure and failed just above 123.6 extension of Z related to W.
NZDJPY 18 April 4 Hour Elliott Wave Analysis
In our Live Trading Room, we sold the pair at 79.05 and closed it at 76.28 for a profit of +277 pips as pair looks to be completing a 5 waves decline from 79.63 peak and could now see a bounce in wave B before resuming the decline. Another reason to close the trade was CADJPY breaking above 4.13.2018 peak and creating an incomplete bullish sequence higher from 3.18.2018 low.
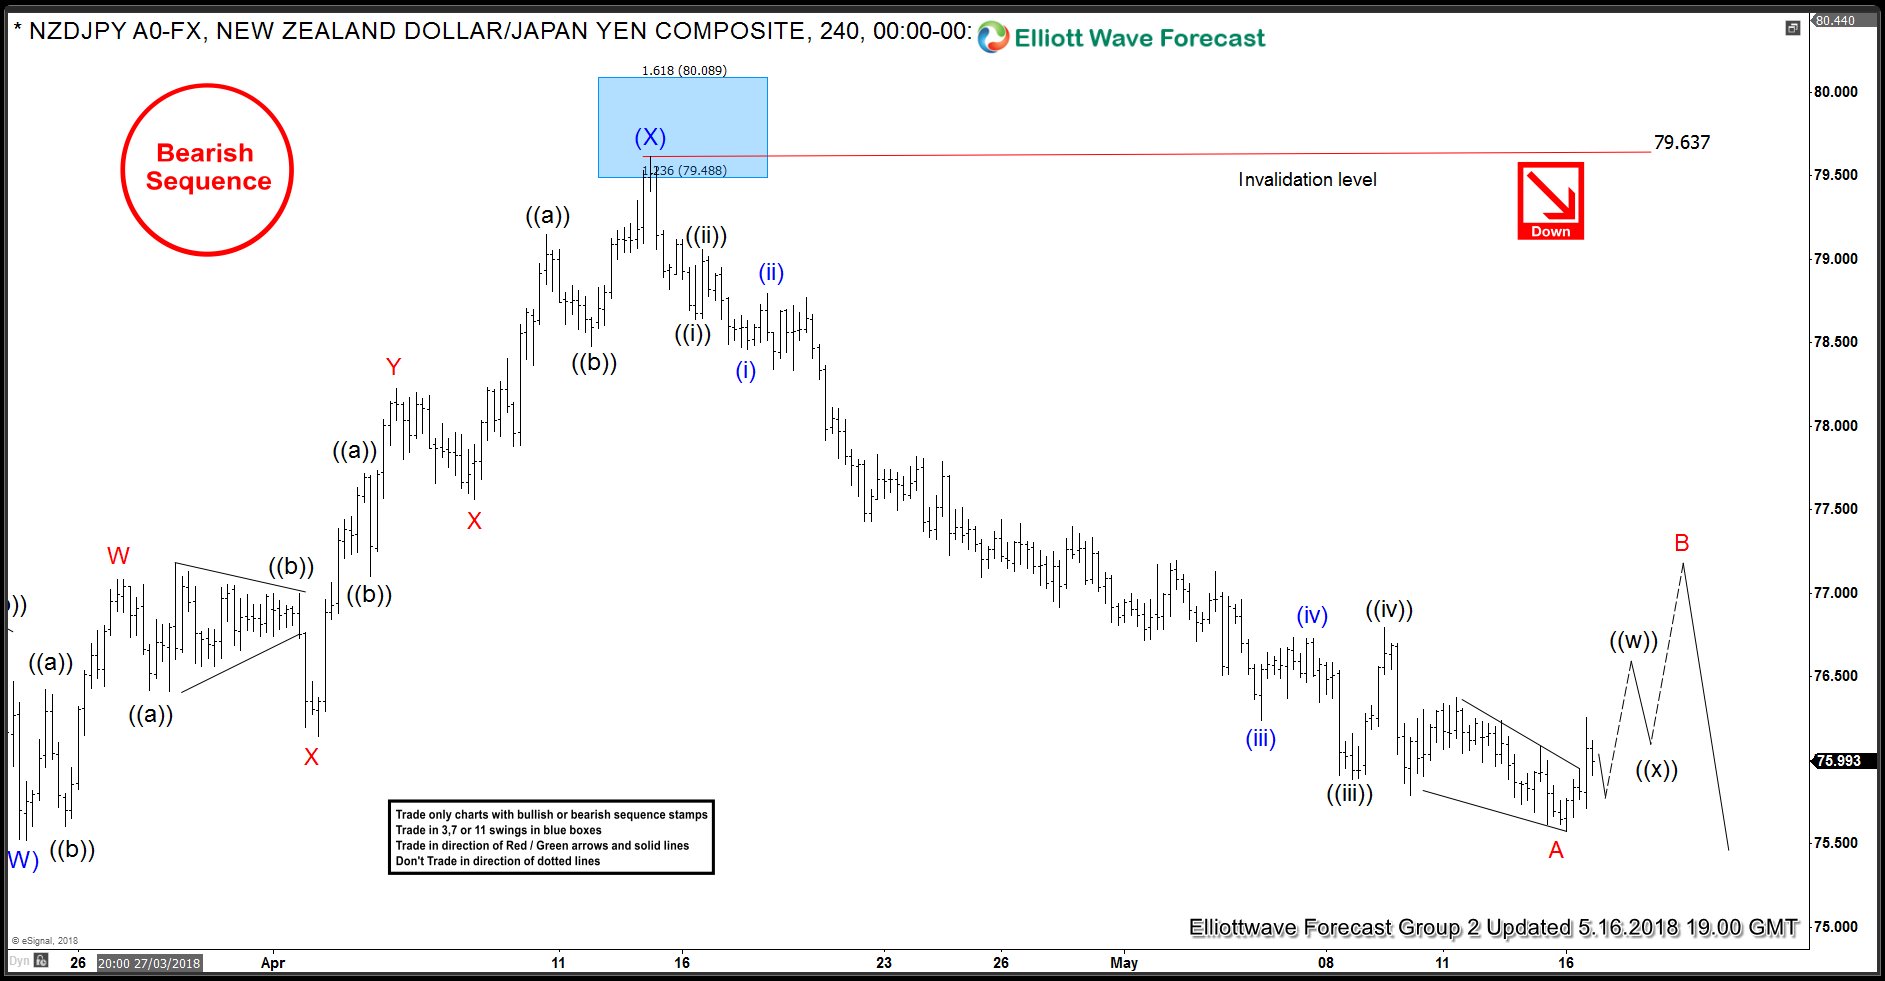
NZDJPY 4 Hour Elliott Wave Analysis 5.16.2018
NZDJPY decline from 79.63 peak could be viewed as a 5 waves impulse that we have labelled as wave A ending at 75.57. As this level holds, pair can bounce in wave B in 3, 7 or 11 swings but as far as 79.63 high holds, we expect the bounce to fail for another extension lower towards 73.67 – 71.83 area. Below is the daily chart which shows the structure of the decline from July 2017 peak.
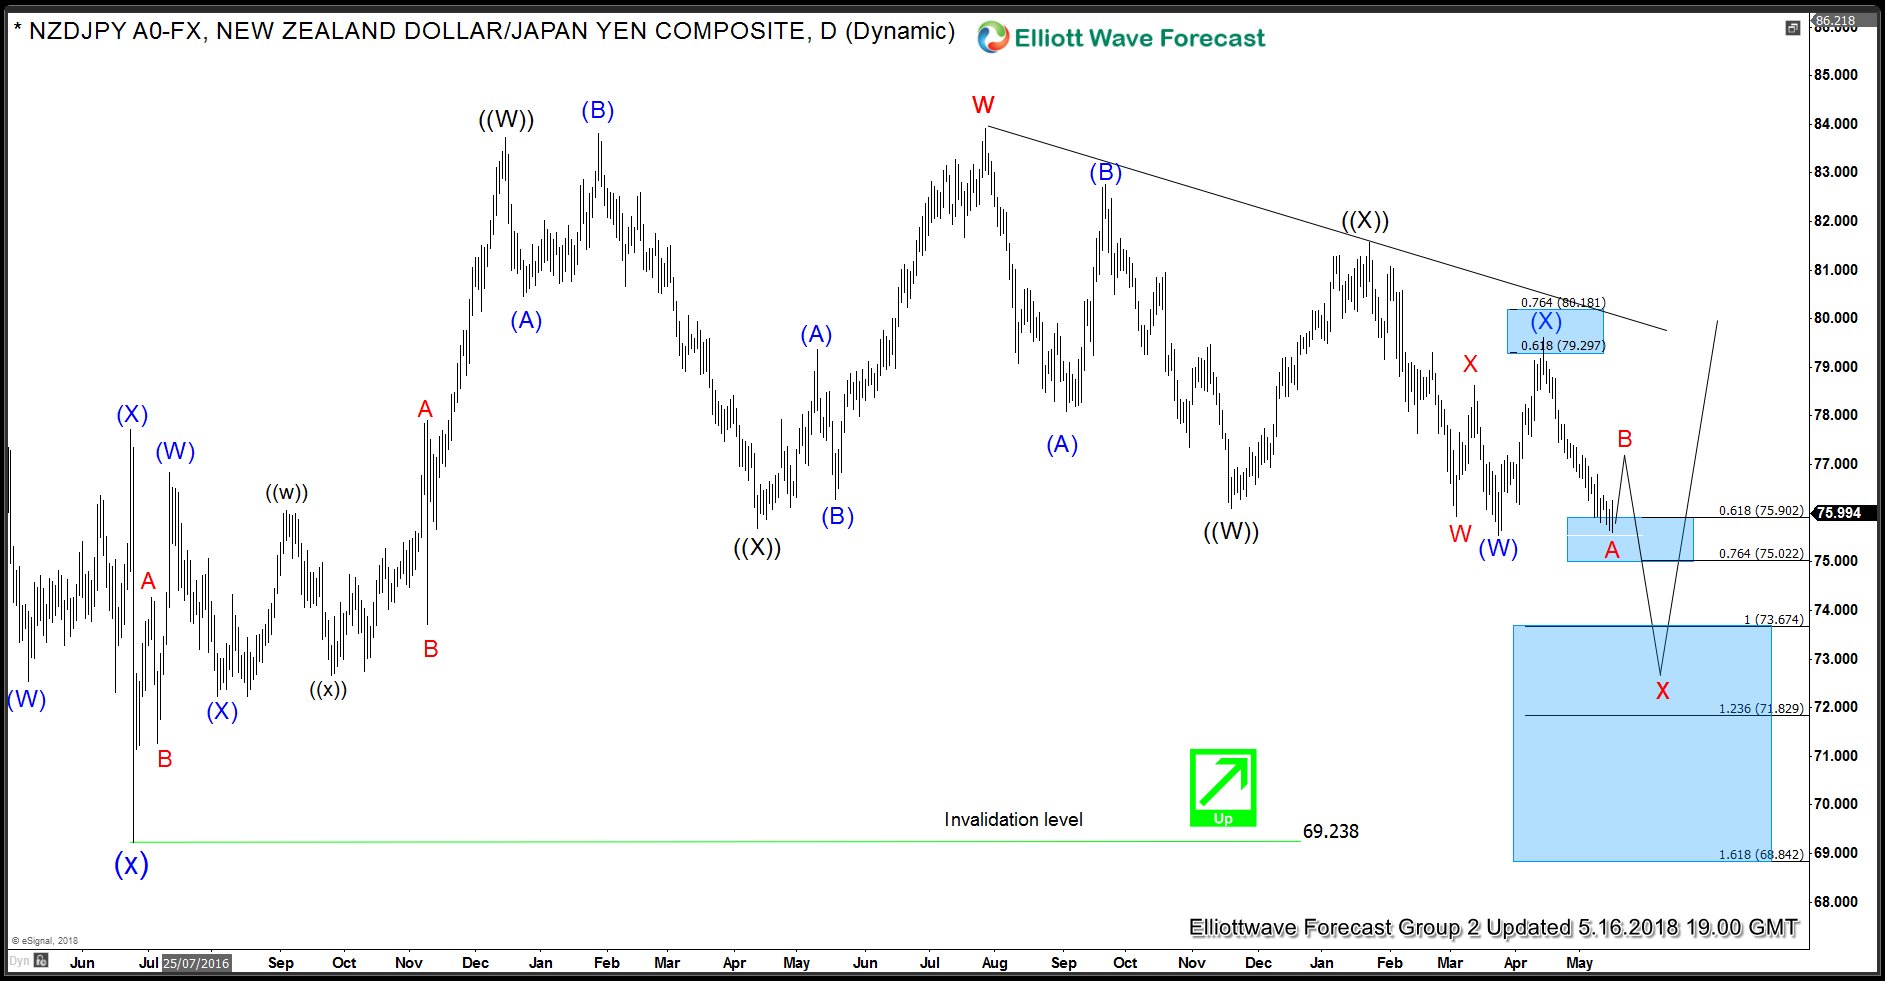
NZDJPY Elliott Wave Analysis: Daily Time Frame
NZDJPY Daily chart above shows pair is correcting the cycle from blue (x) low at 69.23 and the correction is unfolding as a double three structure. As bounces fail below blue (X) peak at 79.63, pair should see more downside towards 73.67 – 71.83 area. After having closed the shorts from 79.05 at 76.28, our preferred strategy is to wait for a break below blue (W) low at 75.54 before looking for intra-day selling opportunities in 3, 7 or 11 swings or waiting for a test of 73.67 – 71.83 area for possible buying opportunities.
Back


