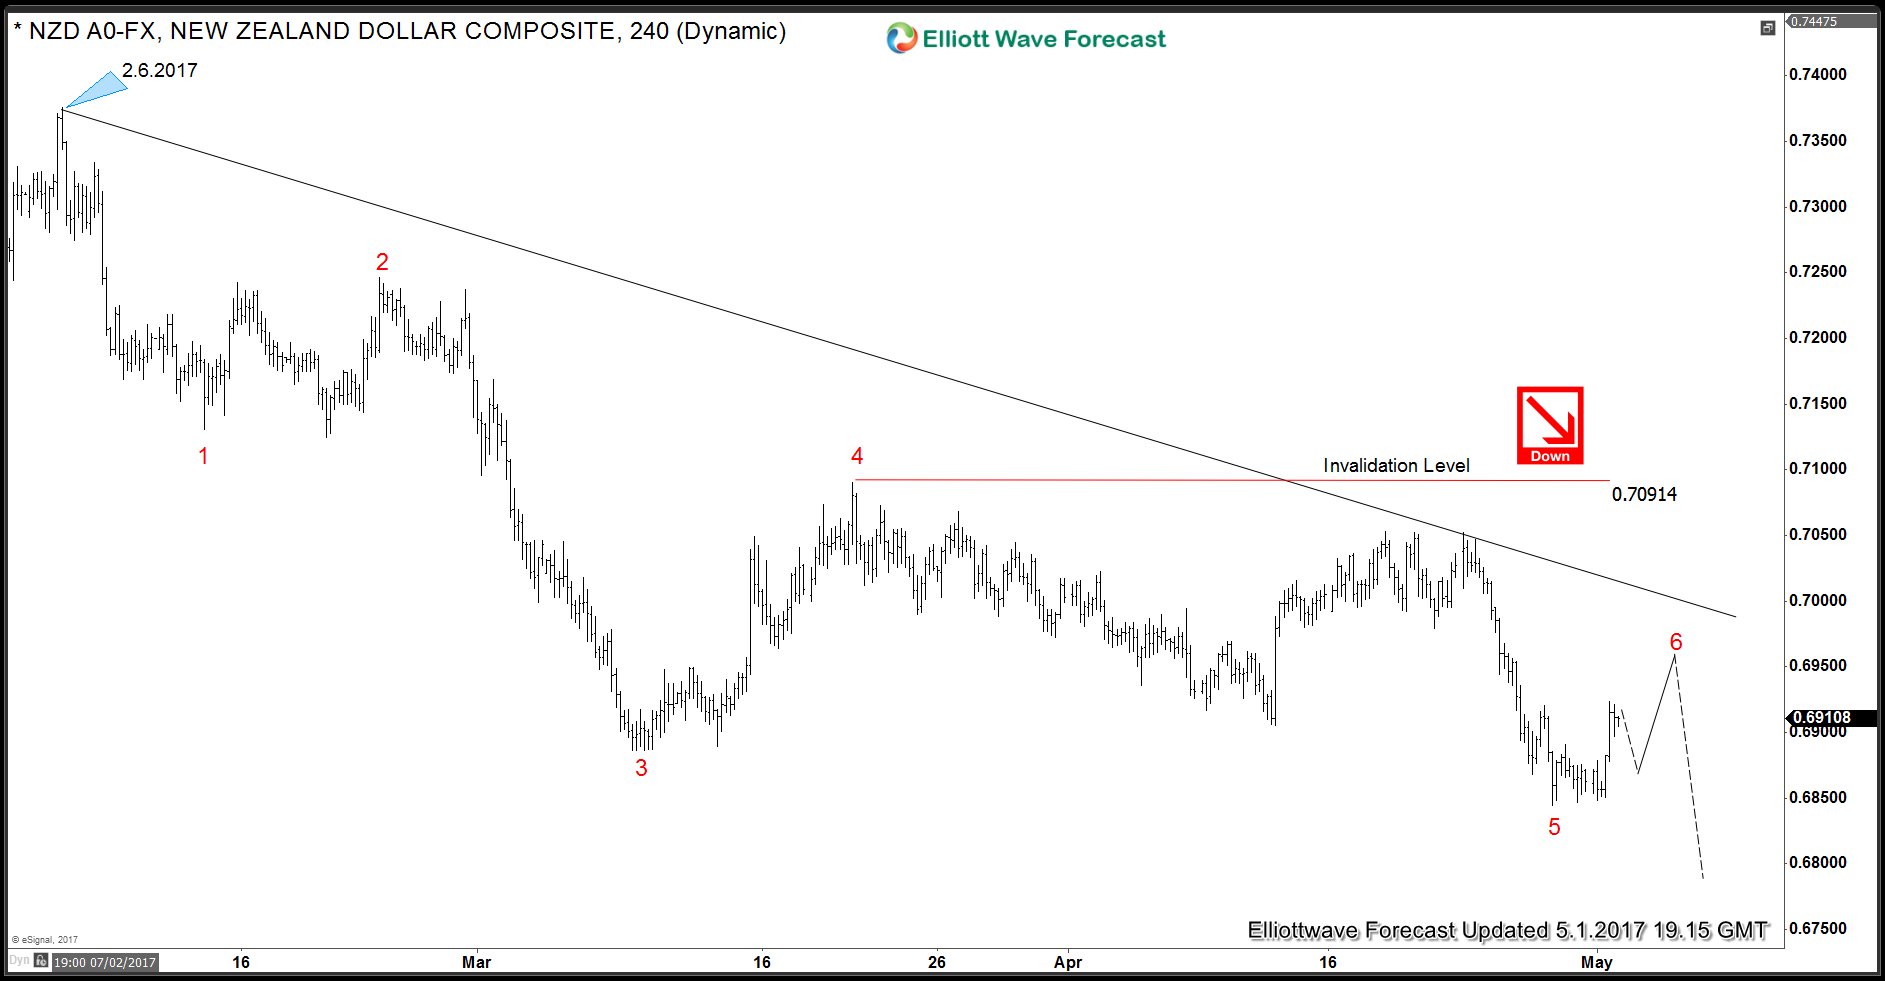
NZD USD is showing 5 swings down from 2/6/2017 (0.7375) which means it’s an incomplete Elliott wave sequence and calls for another swing lower to complete 7 swings down from 2/6/2017 (0.7375) peak. First 3 swings completed on 3/9/2017 (0.6886) and bounce to 3/21/2017 (0.7091) was the 4th swing. Pair has since made a new low below 0.6886 which means we have started the next cycle lower with a target of 0.6739 – 0.6589 and ideally 0.6607 – 0.6492 area.
NZD USD Incomplete Elliott Wave Sequence
We can see 5 swings down from 2/6/2017 peak on this chart (please note these are 5 swings which is not the same as a 5 wave Impulse). As we explained above, 5 swings means the sequence is incomplete and makes the sequence bearish against 0.7091 high as indicated by the red invalidation line and the red arrow. Proposed 6th bounce should stay below 0.7091 high and pivot for the pair to continue lower in 7th swing. Ideally 6th swing should stay below the descending trend line as well which is currently at 0.7018.
NZD USD 1 Hour Elliott Wave Chart
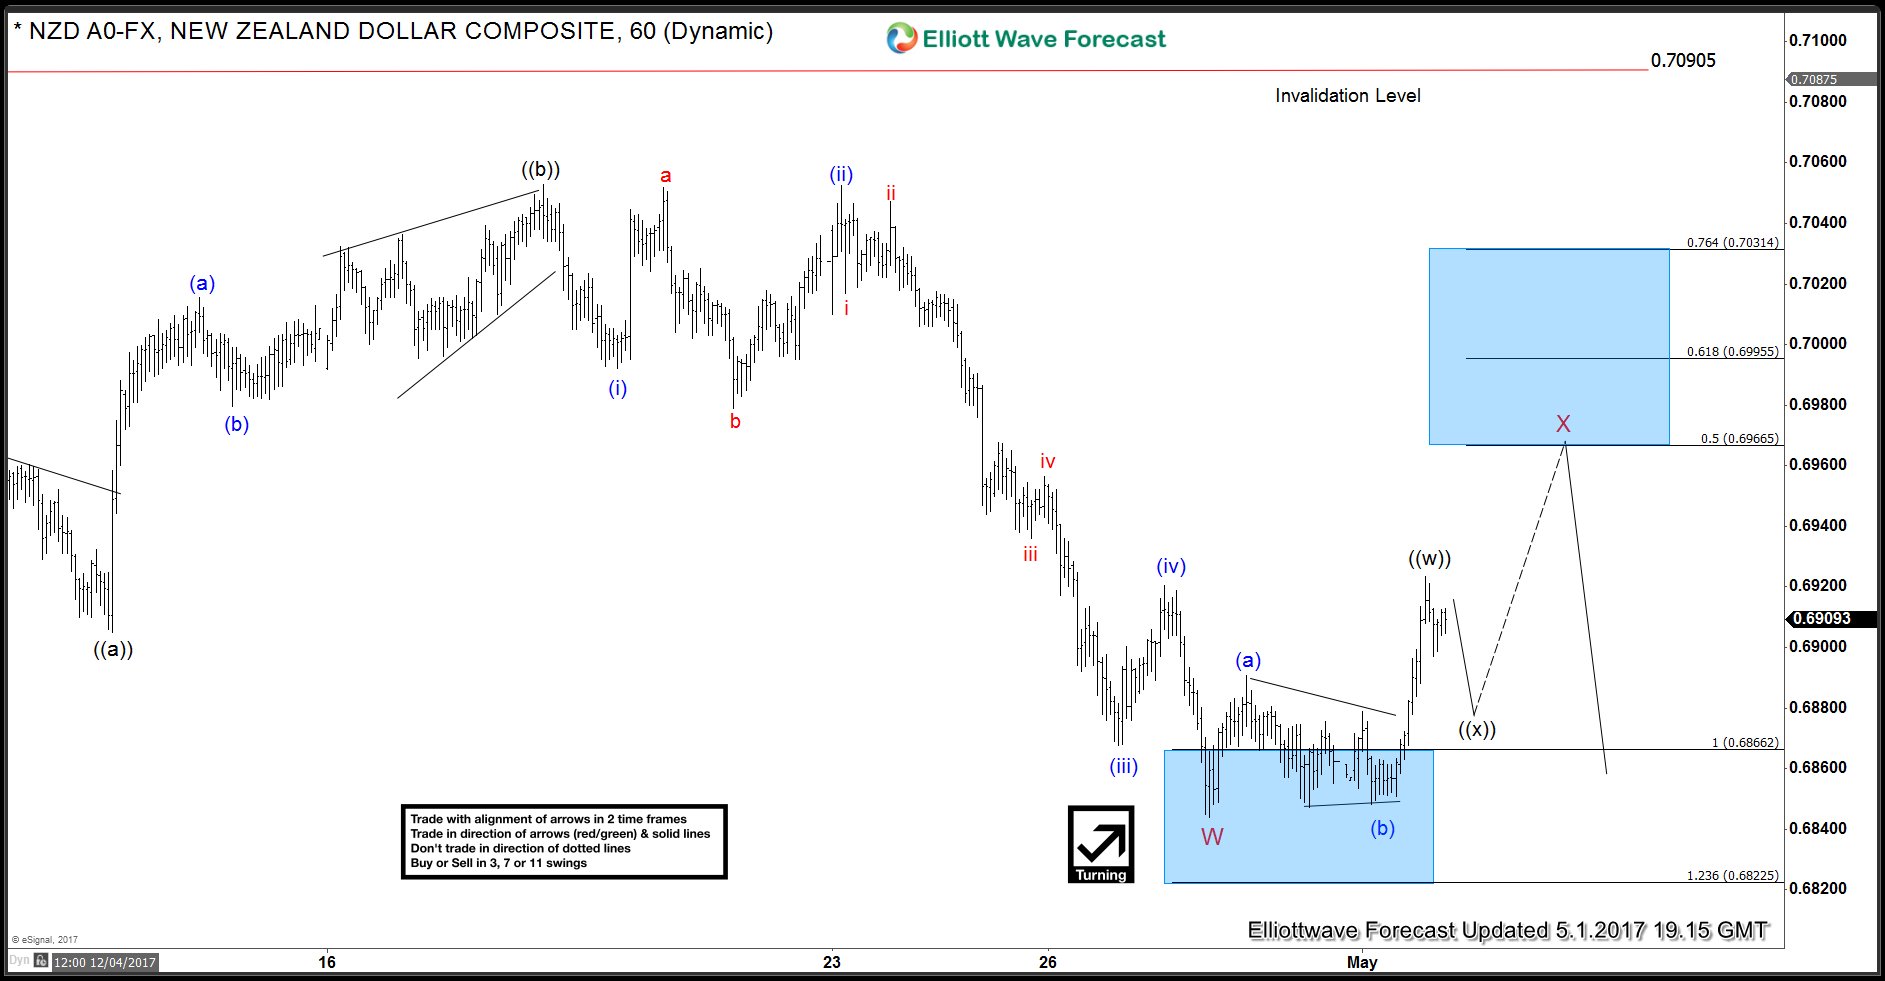
Preferred Elliott wave count suggests NZDUSD drop from 0.7091 was a FLAT which is proposed to have ended at 0.6844 i.e. wave W and a bounce in wave X (6th swing) is now in progress to correct the decline from 0.7091 high before pair turns lower again. Pair has already done 3 waves up which meets the minimum requirements for wave X bounce but market correlation is favoring the idea of a double three correction in wave X. Thus, we are looking for a pull back in wave ((x)) followed by another 3 waves higher to complete wave X before decline resumes. Ideally area for wave X to end would be 100 – 123.6 Fibonacci extension area of waves ((w))-((x)) and might coincide with 0.6966 – 0.6995 (50 – 61.8 Fibonacci retracement area of wave W). We don’t like buying the pair and expect the bounce to fail below 0.7091 high for another leg lower towards 0.6739 – 0.6589 area at least.
Back


