US Dollar Bulls: Don’t Run before you Walk!
US Dollar has been trending higher since making marginal new lows in the daily chart on 8.24.2015. It is also closing in on 8.7.2015 peak, a break above that and the only hurdle left to break out higher would be 3.13.2015 peak. We keep hearing that FED could soon raise interest rates which could help US Dollar break out to the upside. We have NFP (Non-farm Payrolls) due on Friday, 6th November 2015 and expectations are US economy added 184k new jobs in the month of October. (142k in September)
Given USDX is trading at it’s highest levels since last 12 weeks, question is could NFP give US Dollar the push it needs to break above 3.13.2015 peak. We believe we can’t get the answer to this question through fundamentals because one can interpret fundamental data any way they want based on their bias of the market. If you are bullish US Dollar and NFP number is better than expected, you could say US Dollar should rally because a higher NFP number would increase expectations of a rate hike by FED. If you are bearish the US Dollar and NFP number is higher than expected, you could say it was priced in and that’s why US Dollar had been rallying for the last 3 weeks, so Dollar should sell.
We firmly believe Technicals are always a step ahead of fundamentals and fundamentals usually act as a catalyst to move the market or used as a tool to justify the moves that have happened already. Let’s take a look at 720 minute charts of USDCHF (USD – Swiss Franc) and USDPLN (USD – Poland Zloty) and see if we could get any clues about direction of the next big move in US Dollar.
USDCHF (USD-Swiss France, 720 minute chart)
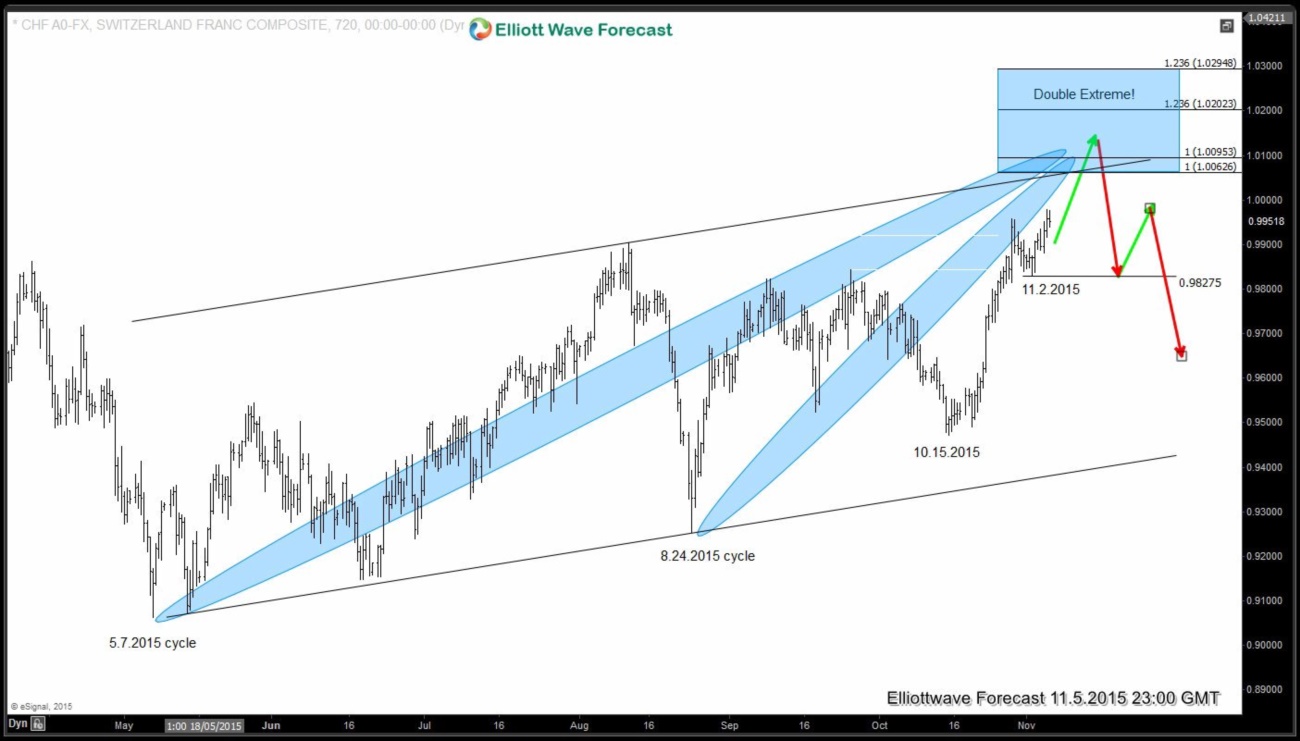
We can see 2 key cycles in the above chart, 1 is from 5.7.2015 and the other one is from 8.24.2015. As we can see pair is quite close but has not yet reached 100% extensions in either of the 2 cycles. We think area between 1.0062 – 1.0294 is an area where the 2 cycles would get extreme (double extreme!) and hence would limit the upside in US Dollar. We have identified 11.2.2015 low (0.9827) to be a key level in the market, while above, US Dollar should extend higher but should struggle to get through 1.0062 – 1.0294 area and then pull back in big 3 waves at least. Break below 11.2.2015 (0.9827) low could put the bears in control suggesting 10.15.2015 cycle ended and most likely 8.24.2015 cycle as well.
USDPLN (USD – Poland Zloty, 720 minutes chart)
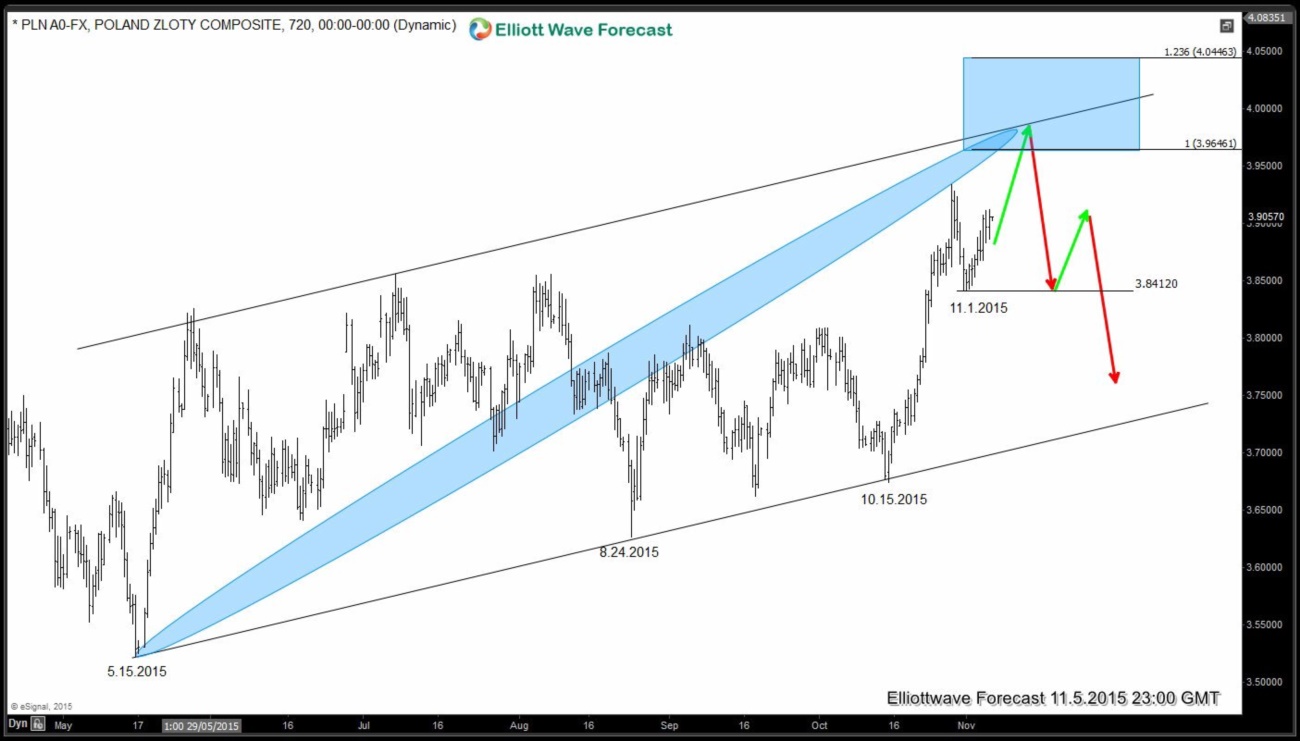
Not many traders probably look at this US Dollar pair but it also shows a cycle from 5.15.2015 getting extreme and while above 11.1.2015 low, pair could see some more upside but ideally should fail in 3.9646 – 4.0446 area to end the cycle from 8.24.2015 at least. It should then turn lower in a minimum of 3 waves.
By looking at the 2 charts above, we can see that regardless of what the NFP number is, extremes in USDCHF and USDPLN wouldn’t let US Dollar break above 3.13.2015 peak in this attempt at least. It could see some more upside in the shorter cycles but soon the cycles from 10.15.2015 and 8.24.2015 would end resulting in biggest selling in US Dollar since 8.24.2015 in 3 waves minimum.
Good Luck & Safe Trading!
Back


