Canada’s Economy
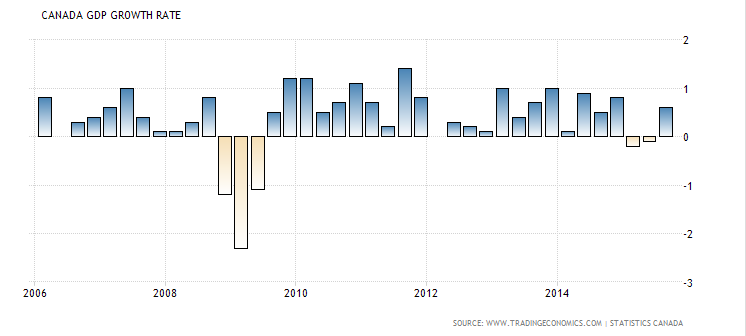
In the first half of 2015, Canada slipped into technical recession, as defined by two consecutive quarters of negative GDP. Depressed oil prices in 2015 has caused significant pain to Canadian economy which is a net exporter of energy, and it has also caused the weakening of Canadian dollar, which is down 10% on trade-weighted basis over the past year.
Canada’s economy however expanded in Q3 2015 with 0.6% GDP growth, led by the surge in net exports and supported by the weakness in Canadian dollar. Looking forward, overall economics picture is mixed due to the depressed oil price expected to last for a while. Unless there’s a meaningful turnaround in oil price, Canada’s growth prospect and business spending remain limited.
Technical Analysis
Although Canadian Dollar is one of the weakest currencies in 2015 and current sentiment is pretty negative, technical analysis in the larger time frame seems to indicate it is not as bearish as people think. Let’s take a look at several charts of Canadian Dollar below:
$USD/CAD Monthly Chart
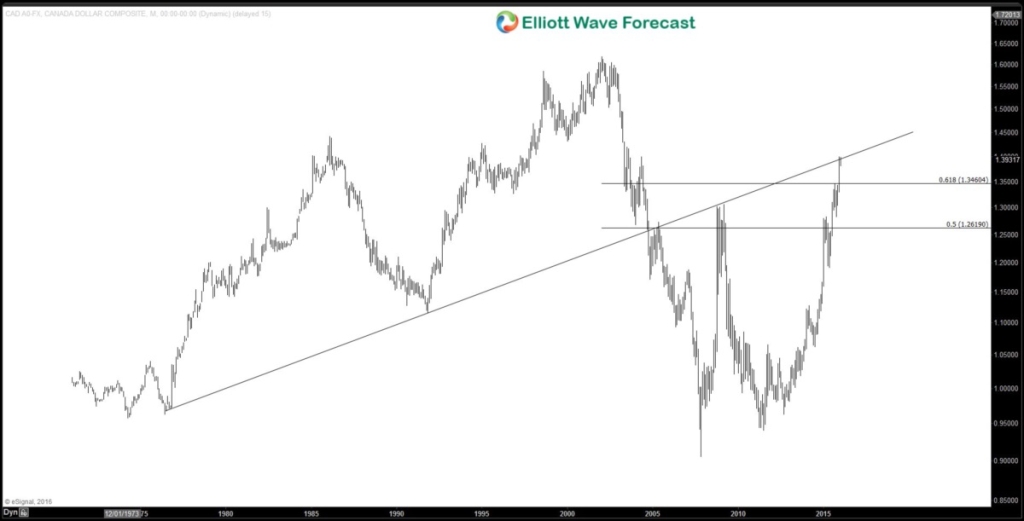
We see from the monthly chart above, $USD/CAD rallied in 3 swing from 2007 low and it has bounced more than 61.8% from 2002 high. Moreover, it is currently retesting broken trend line drawn from 1976 low.
$EUR/CAD Monthly Chart
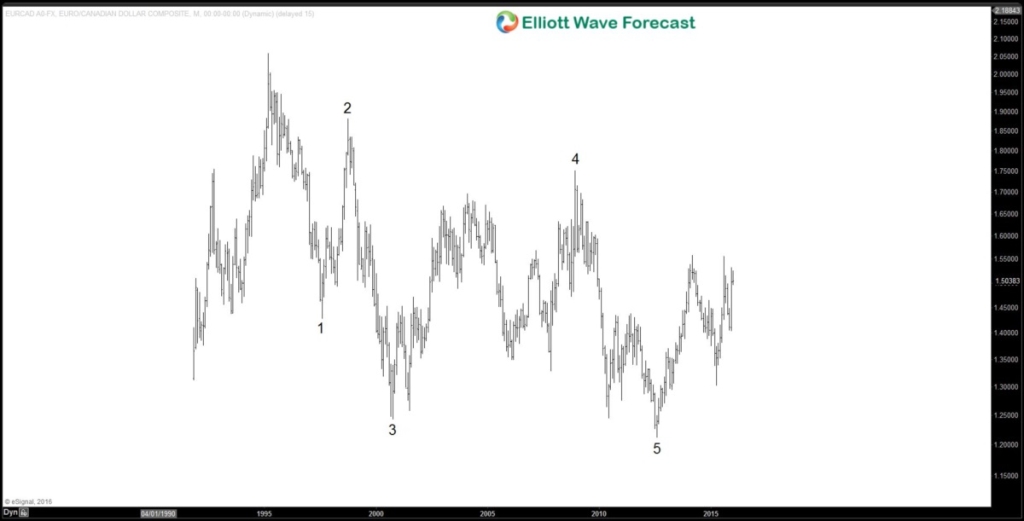
We can see from the monthly chart above that $EUR/CAD has a 5 swing sequence from 1995 high. A 5 swing is not the same as 5 waves impulse, as explained in our Elliottwave Structure and Swing Sequence seminar. A five swing sequence suggests an incomplete sequence and therefore possibility of an extension.
$AUD/CAD Weekly Chart
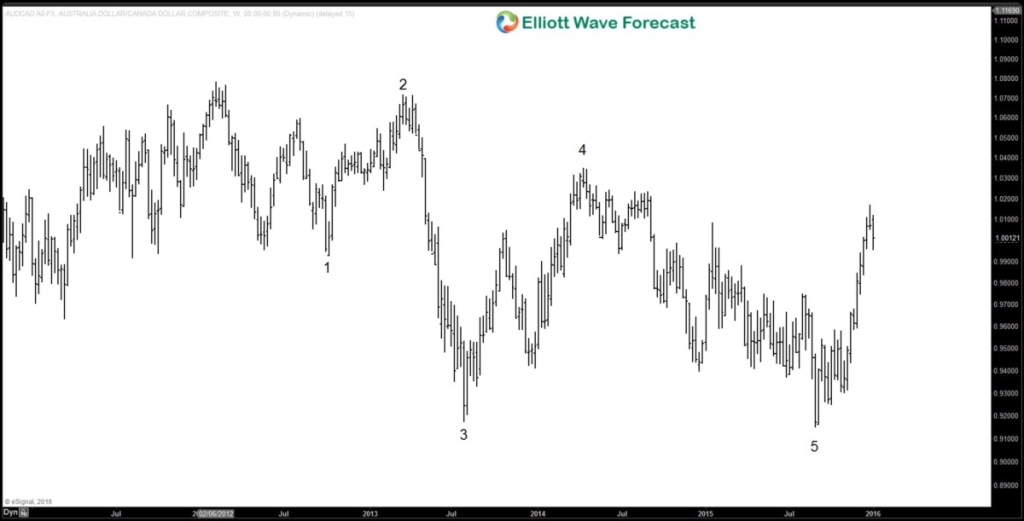
From the weekly chart of $AUD/CAD above, again we see a 5 swing sequence from 2/2012 high which suggests an incomplete sequence and possibility of an extension.
$NZD/CAD Weekly Chart
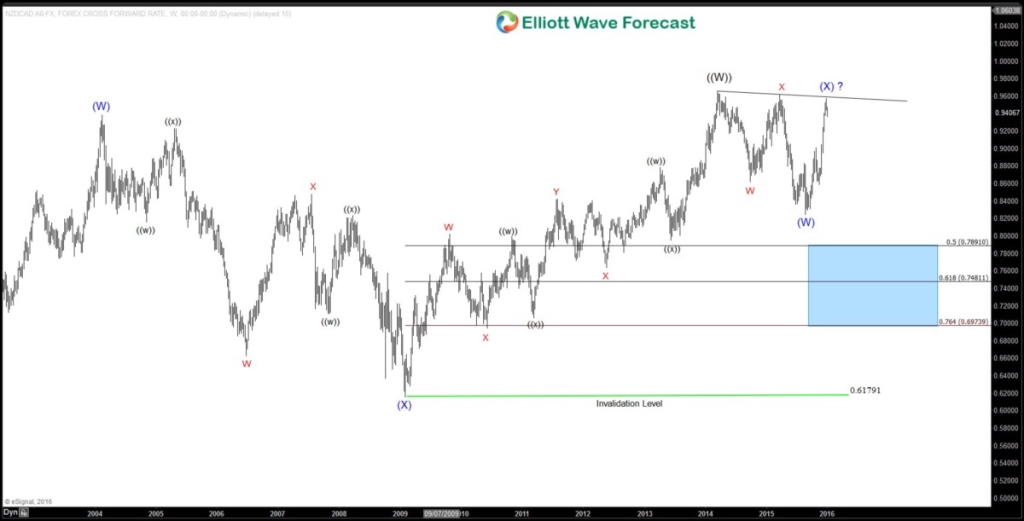
Of all Canadian dollar’s pair, $NZD/CAD perhaps is the most fascinating and difficult to interpret. Pair looks to be very bullish and strong, especially in the last two months in 2015. Looking at the weekly chart above, we can see 3 swing pullback from 3/2014 high. The pair then rebounded strongly and retested the high again.
The big question is whether the pair is ready for the next bullish cycle, or whether it still needs another leg lower to correct the rally from 2/2009 low. When looking at the technical picture of all CAD pairs and some crosses, especially $AUD/CAD and $AUD/NZD, there’s a possibility that $NZD/CAD can still do another leg lower.
If at any point the pair breaks above March 2014 high at 0.9655, then it can be ready for the next bullish cycle and target 1.041 – 1.092 area.
Conclusion
Canadian Dollar may still get pressure in the short term, but looking at the larger time frame weekly and monthly, there’s an indication that the currency is at an area where it may soon start to stabilize or turn.
If you enjoy this article, feel free to read other technical articles at our Technical Blogs and also check Chart of The Day. For further information on how to find levels to trade $USDCAD, $EURCAD, $AUDCAD or other forex pairs, indices, and commodities using Elliottwave, take our FREE 14 Day Trial. We provide Elliott Wave chart in 4 different time frames, up to 4 times a day update in 1 hour chart, two live sessions by our expert analysts, 24 hour chat room moderated by our expert analysts, market overview, and much more! With our expert team at your side to provide you with all the timely and accurate analysis, you will never be left in the dark and you can concentrate more on the actual trading and making profits.
Back