In this short blog, we will have a look at a past Elliott wave short-term structures of the EURJPY presented to members last month.
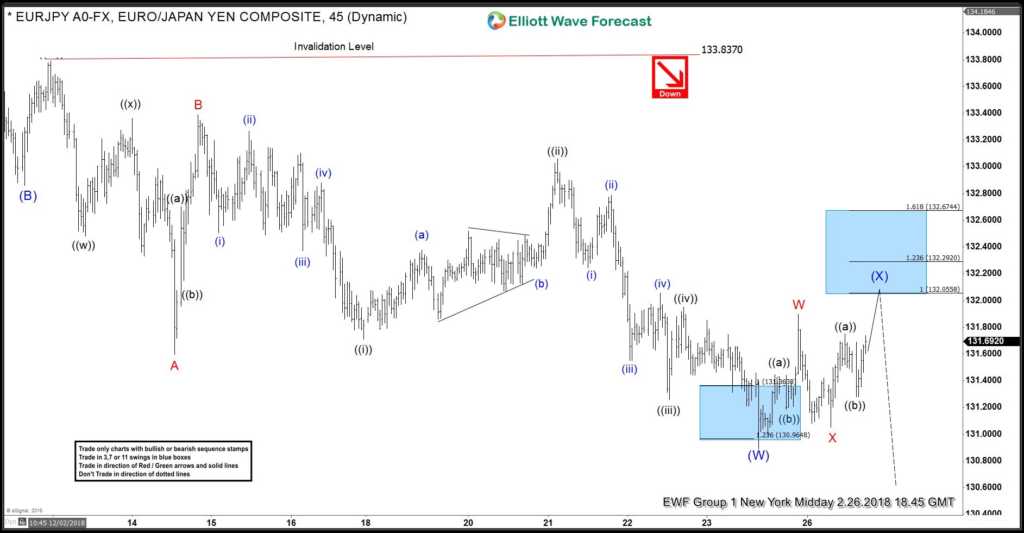
In the chart below, you can see the 1 hour new York midday update presented to members on the 02/26/18. Calling for a double correction in Minor Red W-X-Y.
EURJPY shorter Elliott wave view suggested that we ended the cycle from 12/02/18 in intermediate wave (W) at the low of around 130.945. From that low EURJPY corrected that proposed cycle from 02/12/18 peak in a double correction in Minor red wave W-X-Y. We said to members that area of around 132.0558-132.6744 can be a turning point to the downside. Where it can end the pullback in intermediate wave (X). We said to members that we are looking at least for another similar push lower. Keep in mind that the Elliott wave structure could have changed in the meantime.
EURJPY 02.26.2018 1 Hour Chart Elliott Wave Analysis
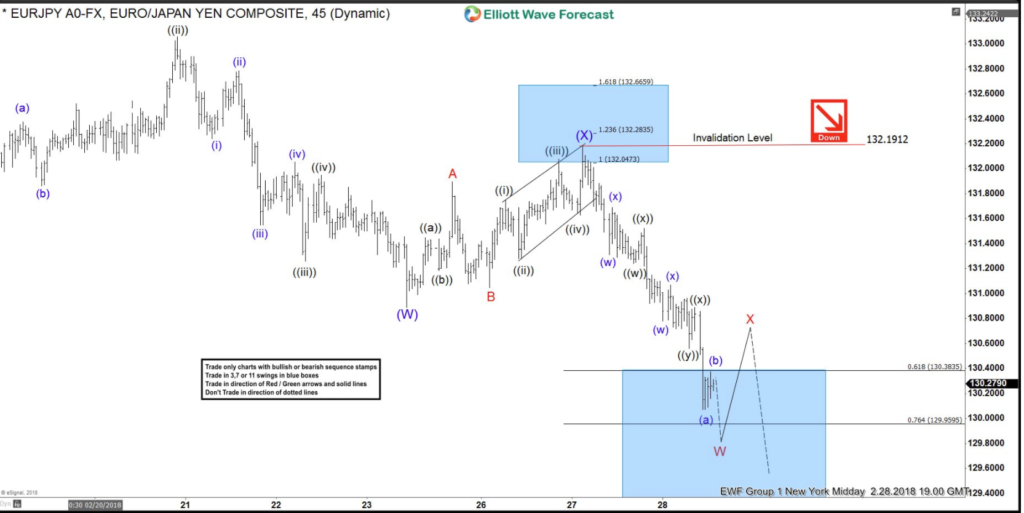
In the Elliott wave chart below, you can see that EURJPY perfectly bounced from the 132.0558-132.6744 blue box mentioned above and continued the short-term weakness to the downside. The pair reached the 0.618-0.764 Fibonacci extension. So, overall we have been looking for more downside. The Elliott Wave count could have changed in the meantime. If you want to have the latest EURJPY forecast in 4 different timeframes then join us for a FREE 14 Trial Here.
EURJPY 02.28.2018 1 Hour Chart Elliott Wave Analysis
I hope you liked this blog and I wish you all good trades. Don’t forget to sign up for a 14 days FREE trial.
We believe in cycles, distribution, and many other tools in addition to the classic or new Elliott wave Principle. To get a regular update on the market and Elliott wave charts in 4-time frames, try our service for 14 days for FREE. Click Here.
Back


