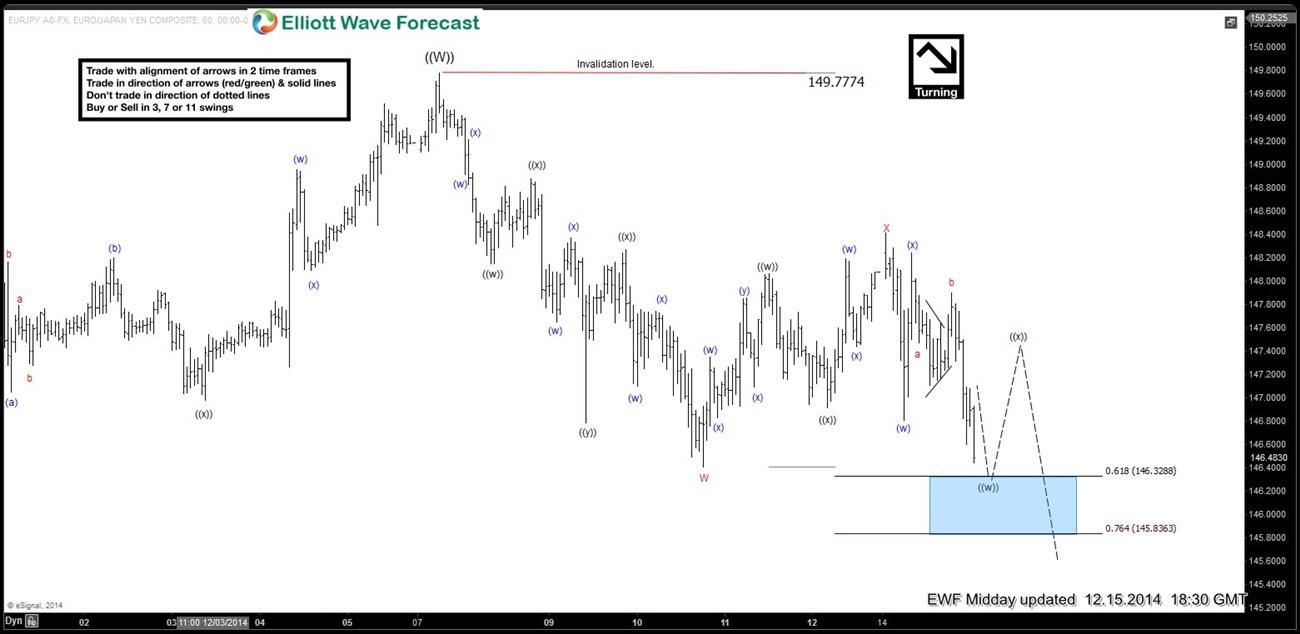
Best reading of the cycles suggests pair has ended a cycle from 10.15 (134.12) low and is due a larger 3 wave pull back in 4 hour time frame. Let’s take a look at Elliott wave structure of the decline from 149.77 peak. Initial decline from 149.77 – 146.40 was a triple three or ((w))-((x))-((y))-((z)) structure that we have labelled as red wave W. After this we saw a 7 swing bounce to 50 – 61.8 fib zone of W and pair has turned lower again. Area between 146.32 – 145.83 is expected to complete wave ((w)) of Y before we get a bounce in wave (( x )) and lower again toward 145.04 – 144.25 area which is equal legs – 1.236 ext of W-X.
Pivot at 148.40 high should keep on holding during proposed wave (( x )) bounce for this primary view to remain valid. If pivot at 148.40 high gives up during proposed wave (( x )) bounce, then pair could end up doing a FLAT in wave X before it turned lower again. We don’t like buying the pair in proposed push lower and as far as 148.40 pivot holds, we like 1 more push lower to complete 7 swing sequence from 149.77 peak.
We do Elliott Wave Analysis of 26 instruments in 4 time frames (Weekly, Daily, 4 Hour and 1 Hour) with 1 hour charts updated 4 times a day so clients are always in loop for the next move. Please feel free to come visit around the website and click Here to Start your Free 14 day Trial (No commitments, Cancel Anytime)
New members save 50% in our End of Year Sale . Click here to Subscribe & Save 50% on all our monthly plans.
Back
