Since 2011 AUDUSD is on a corrective WXYZ Elliott Wave structure on the weekly chart. On the bigger time frames (Weekly, Daily and 4h) AUDUSD has been moving on a clear down trend. So to enter a trade you must ask yourself, which side would you trade this pair. Would you BUY or SELL it? We at Elliottwave-Forecast always advise our members to trade with the trend and not against it. As you will see below our charts clearly shows our members to look to sell the Aussie dollar and to continue to trade only on the right side. The trend side.
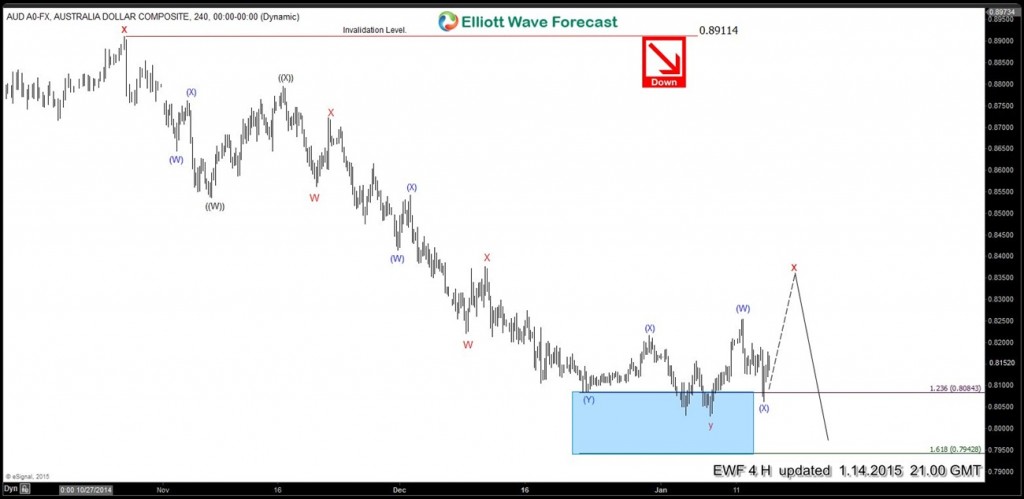
AUDUSD January 14/2015 (4 hour chart) : Trend is down. Arrow is pointing down. Invalidation level is at 0.8911 on 4 hour time frame. We advised our members for possible selling opportunities in the 0.8288 – 0.8365 area.
Now we will zoom down to the 1 hour charts to get a clearer picture and to see the possible trade set ups.
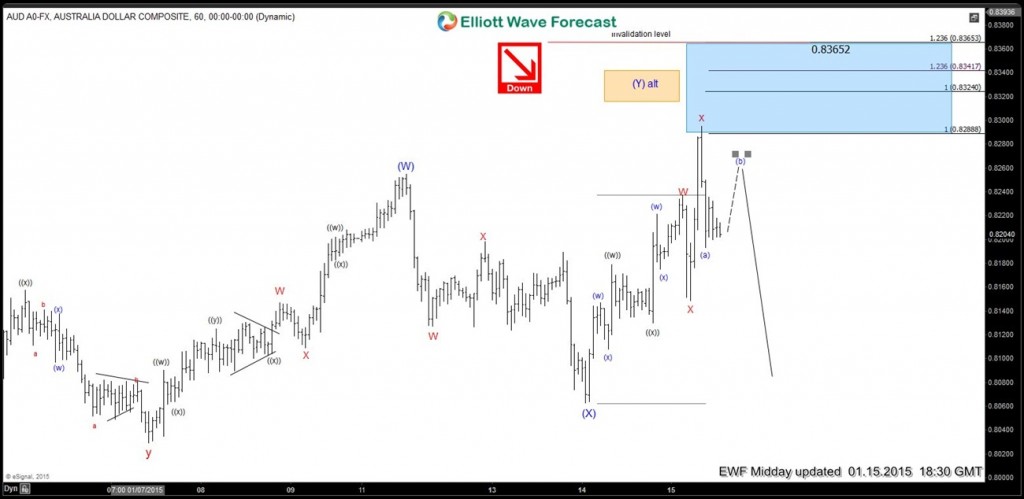
AUDUSD 1H January 15/2015 : Wave red x hits the equal legs at the 0.8288 level and quickly reversed. From this reaction we advised members to look to SELL the bounce against the invalidation level at 0.83652.
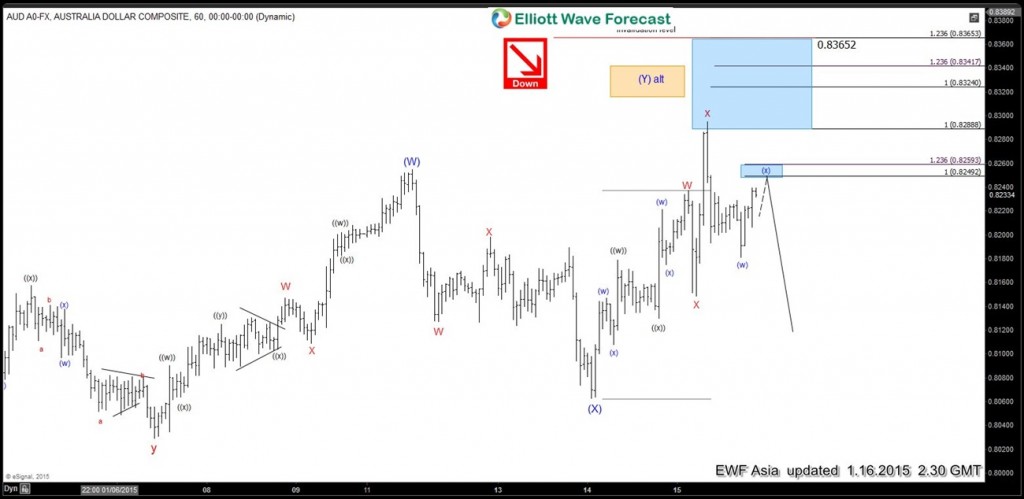
AUDUSD 1H January 16/2015 : Members waited patiently for the bounce to the first selling opportunity in the 0.8249 – 0.8259 area.
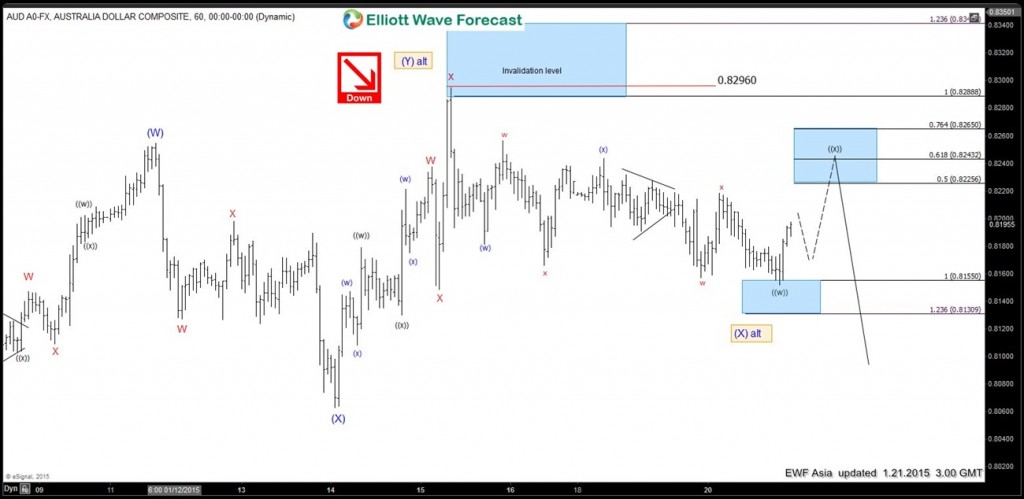
AUDUSD 1H January 21/2015 : Price moved sideways, invalidation level was moved lower to 0.8296 and another selling opportunity presented itself. For members that missed the first one we advised them to sell in the 0.8225 – 0.8265 area against 0.8296 invalidation level.
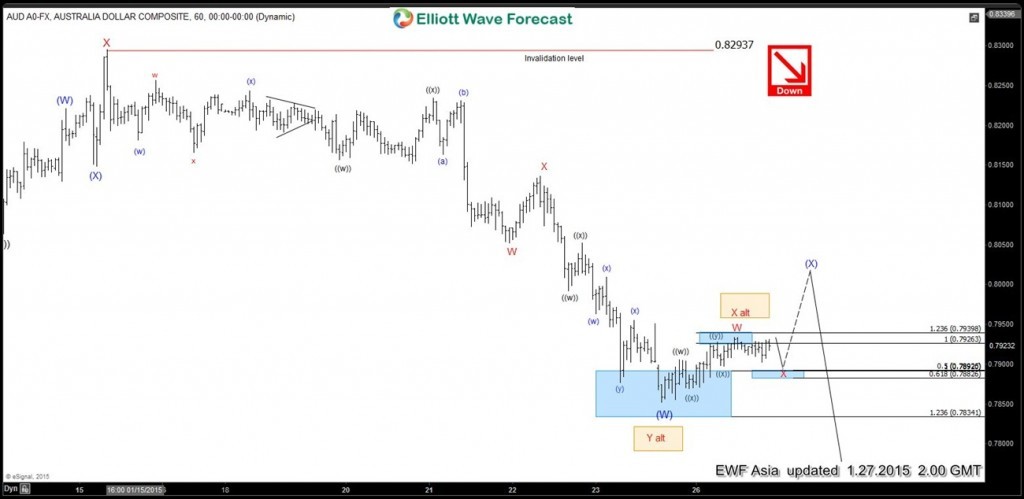
AUDUSD 1H January 27/2015 : AUDUSD continued to drop to the equal legs level area of 0.7894. Approximately 400 pips from the first and second selling area. On this day we presented our members with the third possible selling opportunity. We advised members to look to sell the wave (X) bounce in the 0.8015 equal legs area.
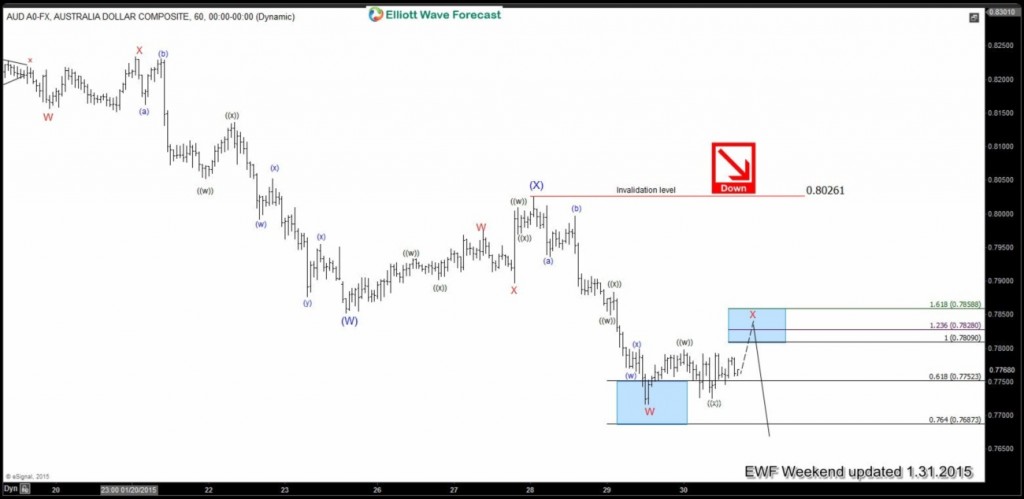
AUDUSD 1H January 31/2015 : After wave (X) bounced and hit the equal legs area at 0.8015 it reversed and continued to move lower to the next level of interest as we expected. Move lower is now approximately 500 pips from first and second selling area and approximately 300 pips from the third selling area. Arrow pointing down, invalidation level moved lower to 0.8026 and the fourth selling opportunity presents itself. We advised our members to look to sell on the red wave X in the 0.7809 – 0.7858 area against 0.8026 invalidation level.
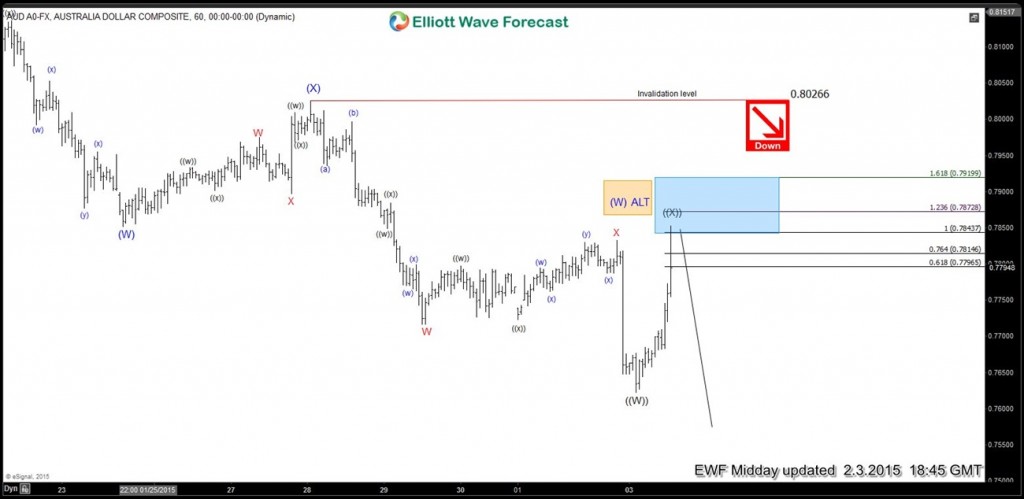
AUDUSD 1H February 3/2015 : After hitting the fourth selling area AUDUSD moved down fast but quickly bounced back to the same area. We advised our members to continue holding shorts as long as 0.8026 invalidation level did not break and that if 0.8026 holds AUDUSD can still move back lower.
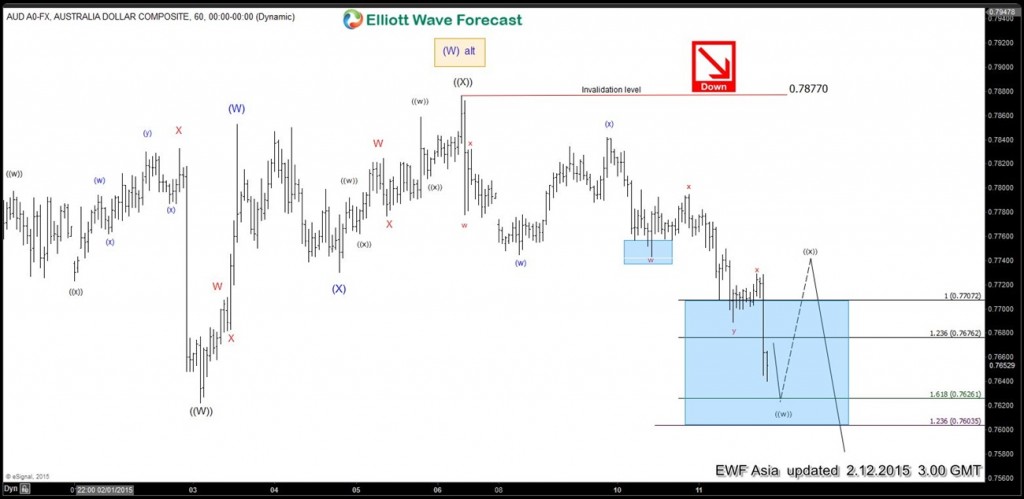
AUDUSD 1H February 12/2015 : AUDUSD did not break above 0.8026 invalidation level and moves lower. Invalidation level was moved lower to 0.7877 and we expected the pair to continue lower.
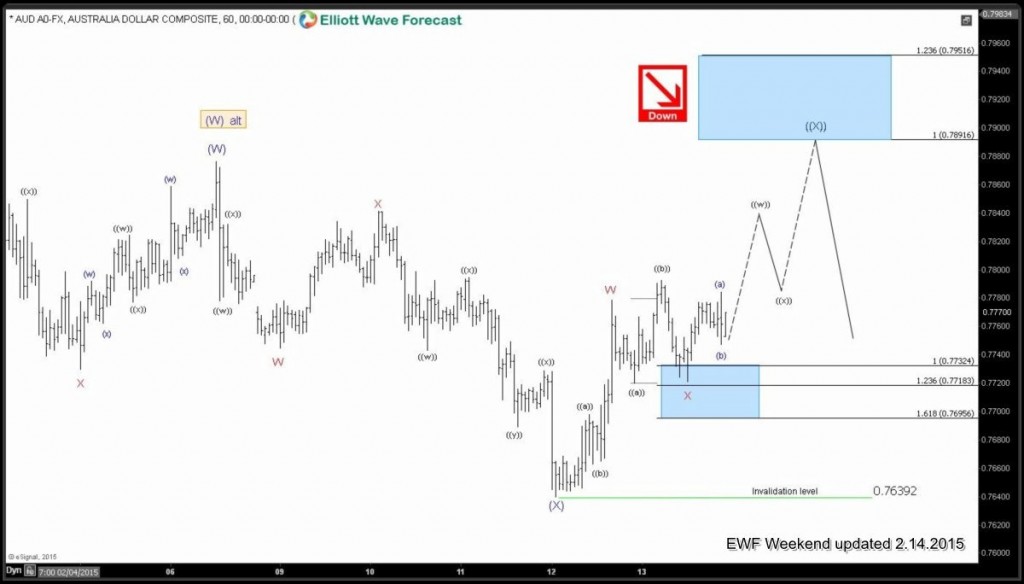
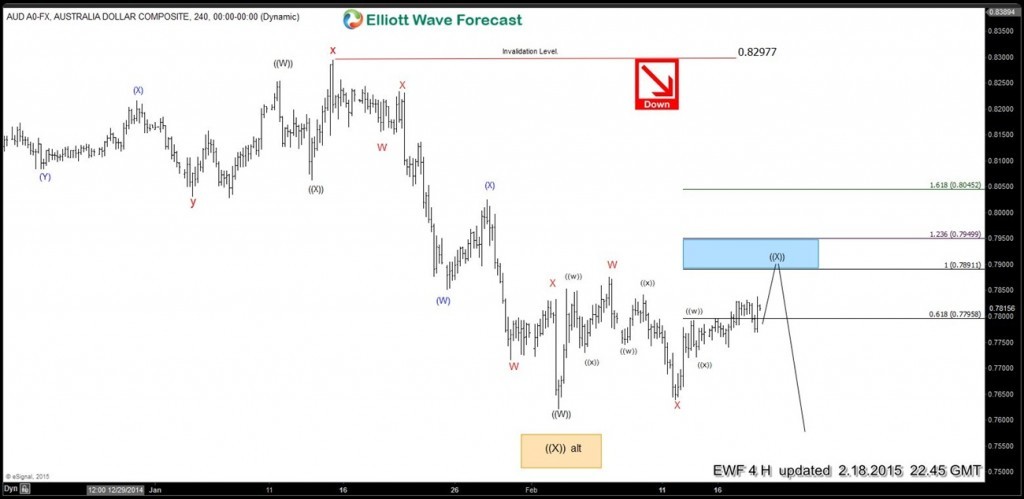
AUDUSD 1H February 14/2015 : On this day we realized that AUDUSD would not continue lower and structure was showing that it could correct higher before possibly selling off again. We advised members who sold in the fourth selling area to close their trade for a small profit. Now a fifth selling opportunity presented itself and we advised members to look to SELL on wave ((X)) in the equal legs area of 0.7891 – 0.7951. By February 18/2015 our 4H chart showed this possible fifth SELL setup very clearly.
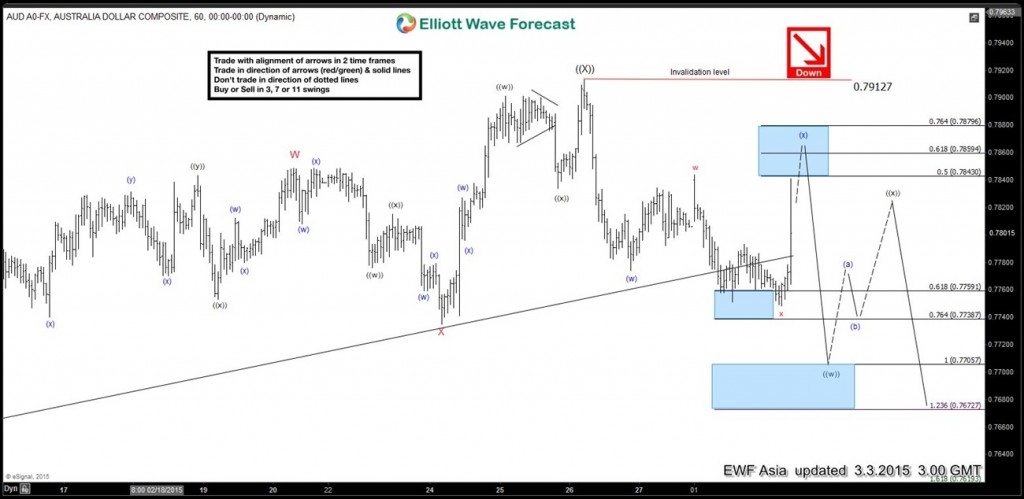
AUDUSD 1H March 3/2015 : The pair hits the fifth selling area at 0.7891 and pushed lower as expected. Invalidation level moved to 0.7912 and the sixth selling opportunity was presented to our members who missed the previous selling opportunity. We advised members to sell in the 0.7843 – 0.7879 area against 0.7912 invalidation level.
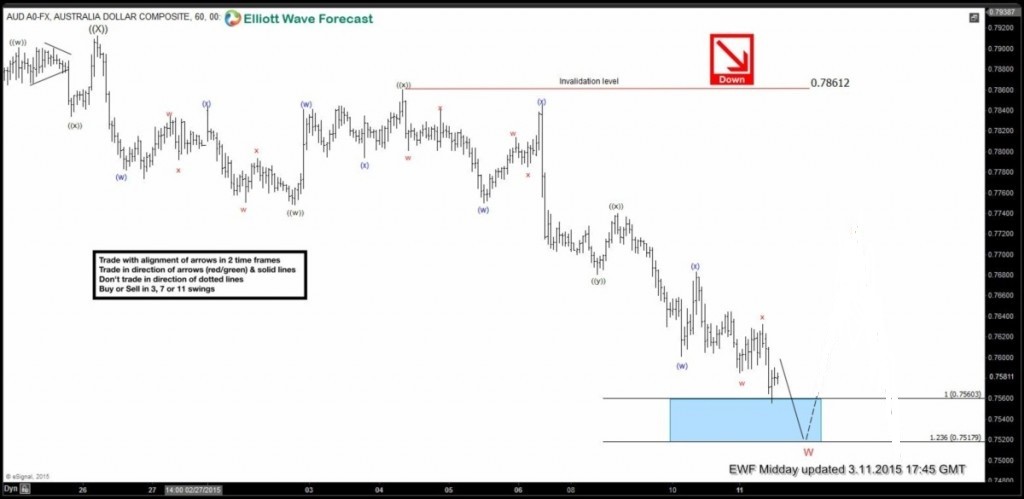
AUDUSD 1H March 11/2015 : AUDUSD moved lower and hits the equal legs level at 0.7560. From January 16 and 21 first and second selling area approximately +700 pips. From January 27-28 third selling area approximately +450 pips. From February 2 fourth selling area we advised members to close for small profit on February 14. From February 25 fifth selling area approximately +330 pips. From March 3-4 sixth selling area approximately +285 pips.
If you want to know what we are forecasting AUDUSD to do next then take the trial for 14 days and get access to AUDUSD charts plus 25 more instruments. You will also get access to our daily live session webinars, daily technical videos, our 24 hour chatroom and much more.
Just click here to get started -> 14 DAY TRIAL
*At EWF we update our 4H charts everyday and our 1H charts 4 times a day so our members are always in the loop for the next move.
Back
