Last week, Canadian dollar rose to its strongest since May against US Dollar over speculation that Canada and U.S. will strike a deal on NAFTA. News then come late Sunday that Canada agreed to join the trade deal with the U.S. and Mexico. All three countries plan to sign on the pact which will save NAFTA as a trilateral agreement. Negotiators from three countries worked around the clock over the weekend to beat self-imposed midnight deadline. This will allow current Mexican president to sign the revised NAFTA agreement on his final day in office.
The Trump administration had previously threatened to move ahead with the bilateral pact between U.S and Mexico. Talks with Canada have dragged over a year amidst differences primarily in Canada’s dairy industry and Chapter 19. Reports say that Canada has made concessions to boost U.S access to Canada’s dairy market. Canada also agreed to a cap on its automotive exports to the U.S. In exchange, the U.S will lift tariffs on Canadian steel and aluminum. In addition, the U.S. will not impose tariffs on most auto imports from Canada. Canada has also been able to keep Chapter 19, the dispute resolution mechanism, which is another sticking point with the U.S. before.
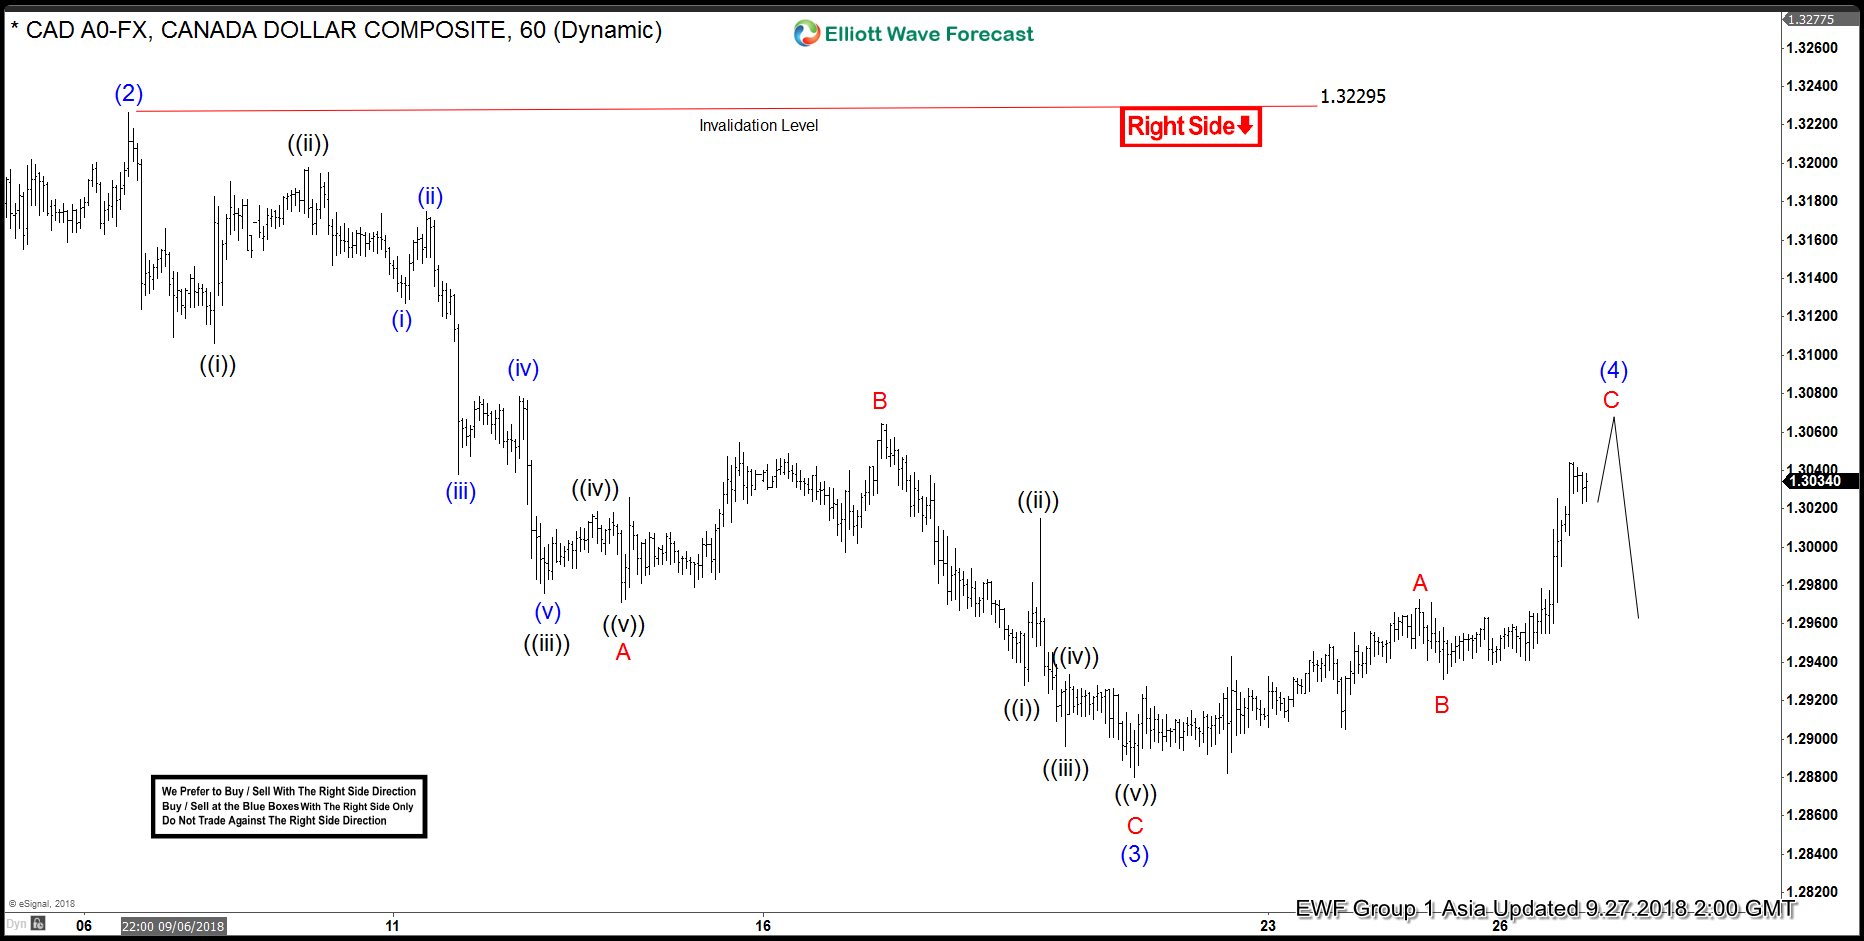
What does Elliott Wave say before the news break out? We’ve been bullish Canadian dollar for a while as Elliott Wave supports a move higher in Canadian dollar. Below is the Elliott Wave Chart for $USDCAD from our Group 1 instrument.
USDCAD Short Term Elliott Wave Chart 9.29.2018
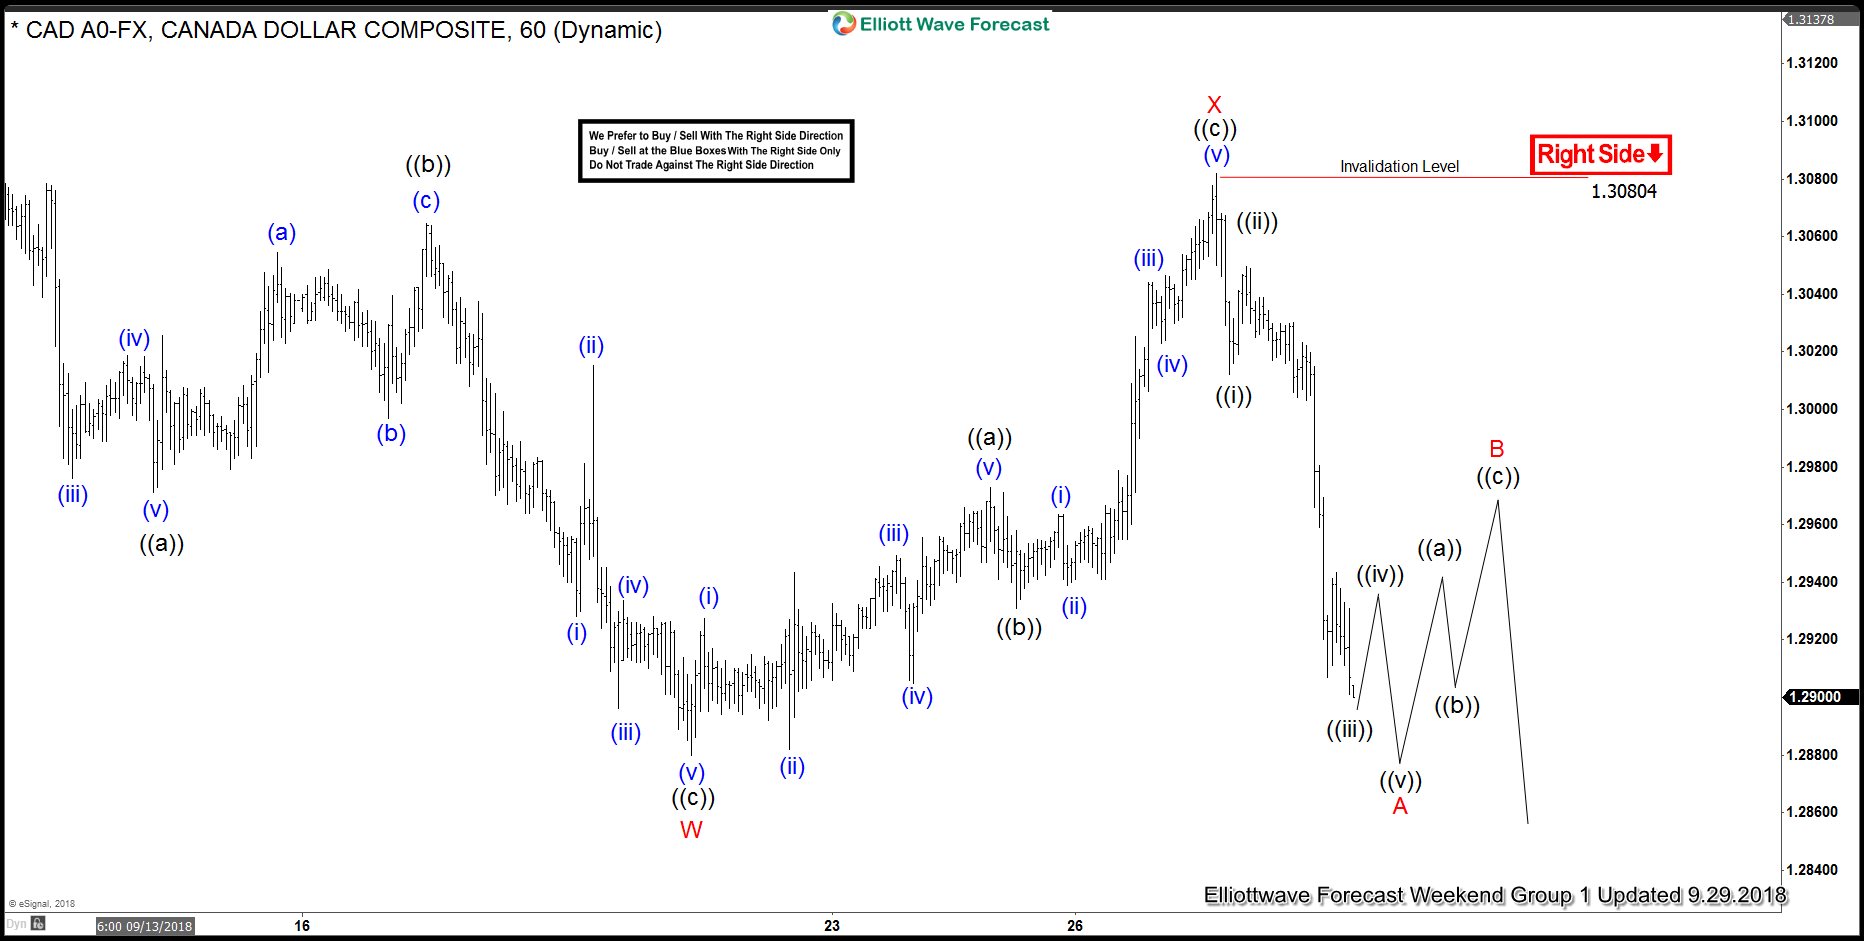
On Thursday last week before NAFTA news announcement, our chart is calling for a move lower in USDCAD against September 6 high (1.3229). The right side stamp is lower, favoring more downside as pair shows a short term bearish sequence from June 27 high (1.338). A red color right side stamp means that we like to sell the pair as far as it stays below the invalidation level. Below is the weekend chart update
USDCAD Short Term Elliott Wave Chart 9.29.2018
The rally ended at 1.308 as a zigzag Elliott Wave structure and pair sold off as expected. The decline from last Friday looks to be unfolding as an impulse Elliott Wave structure and suggests that while bounces stay below 1.308 high, pair can see further downside this week.
To receive regular Elliott Wave chart update in 4 time frames for 78 instrument, you can get Free Trial here –> 14 days FREE trial. The trial includes access to live sessions, 24 hour chat room, and live trading room with trading setups.
Back


