Today the price of Bitcoin suddenly jumped a massive 23% within 2 hours to reach the highest level in 4 months. The crypto-currency has also added over $14 billion to its market value in the last 24 hours. This ended the consolidation since last December at $3122 and provided relief for the bulls. A large volume accompanies the rally higher as the chart below shows:
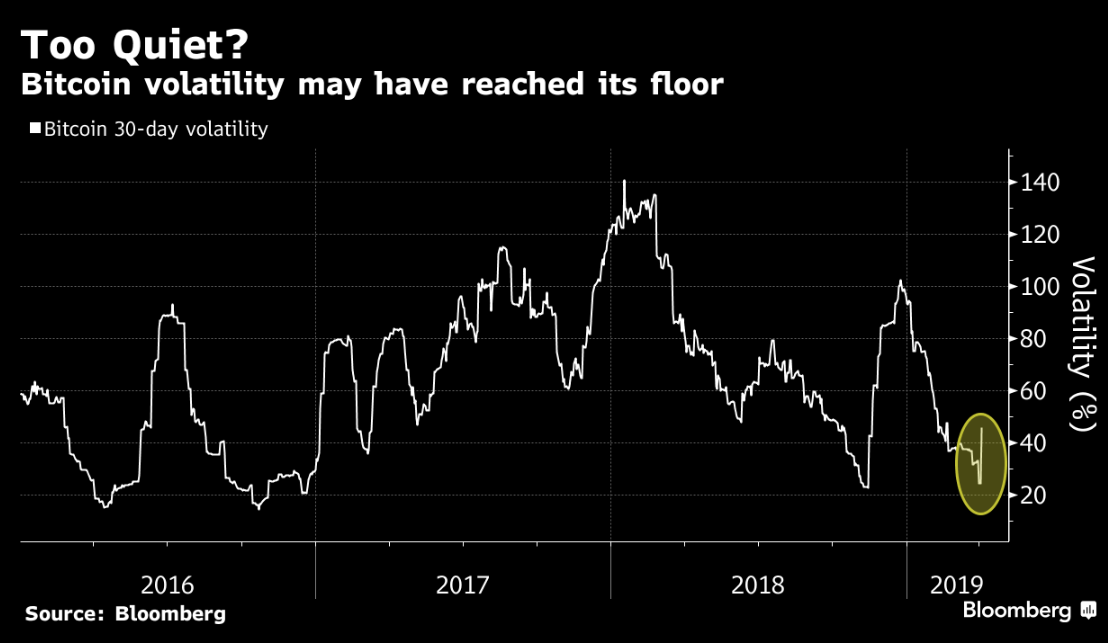
There does not seem to have any specific reason or catalyst for the rally. Rival coins such as Ether, XRP, and Litecoin also jumped. Trading has been subdued in the last few months and volatility may have reached the floor, thus a mean reversion is bound to happen.
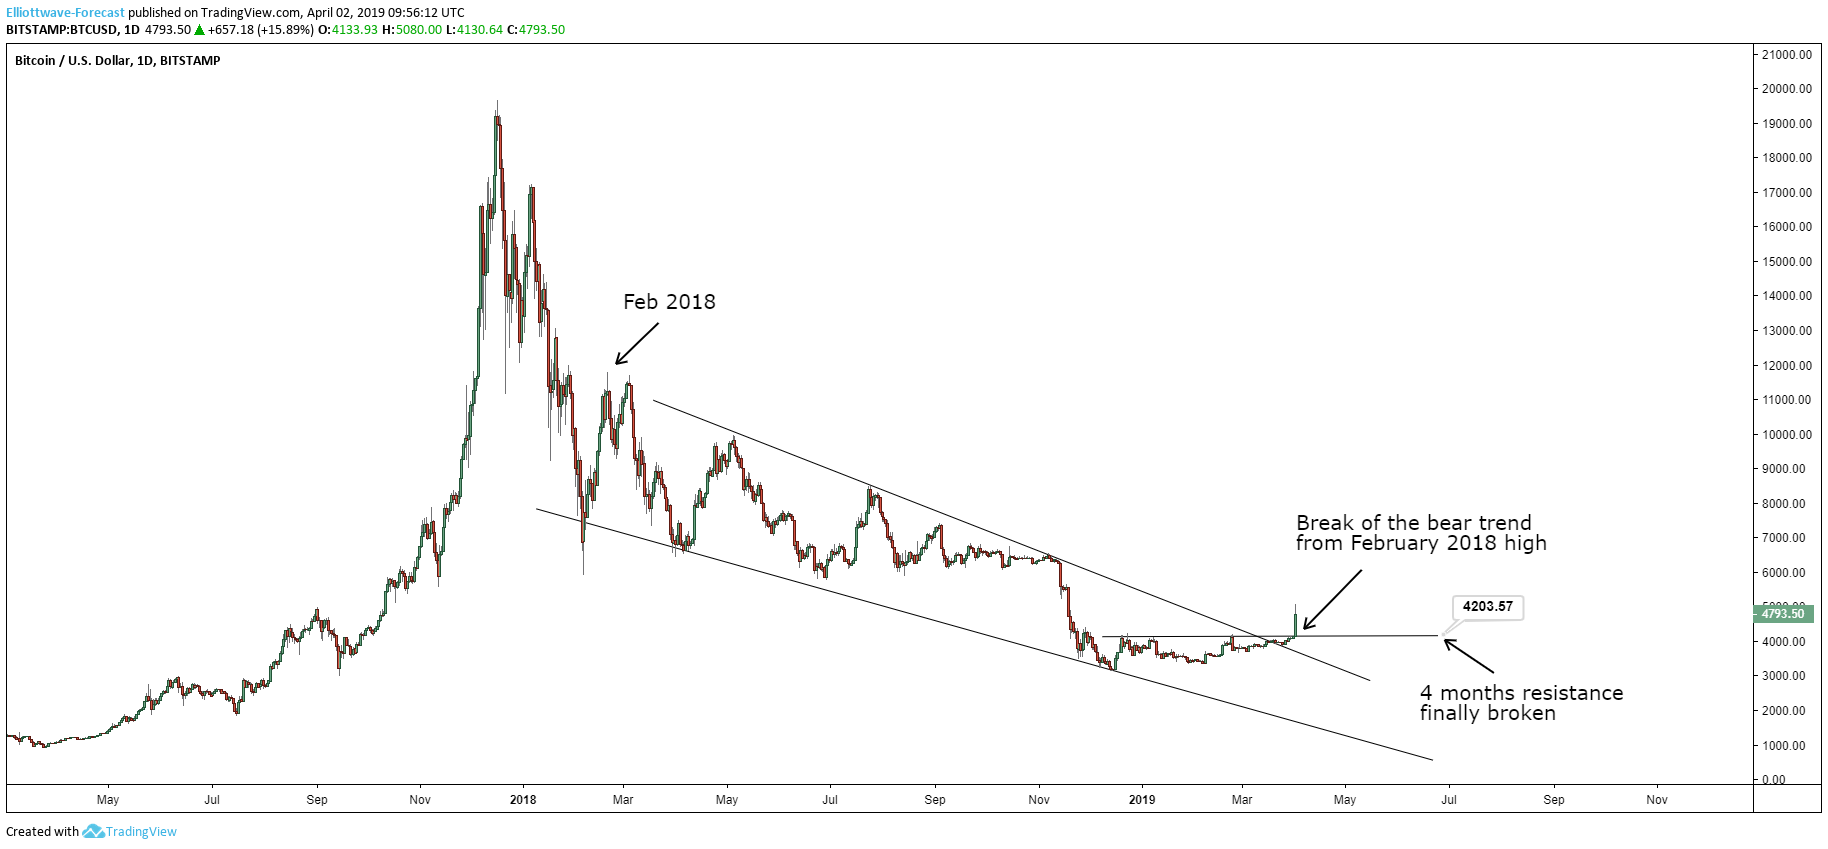
One possible reasons for the breakout is a short squeeze when the virtual coin was finally able to break above the $4,200 resistance level. It struggled to break this level in the past 4 months. The clean break led to the substantial follow through possibly triggering some algorithmic trade. This break higher has the chance to end the bearish trend since Jan 2018 high as the chart below shows:
Bitcoin Daily Chart
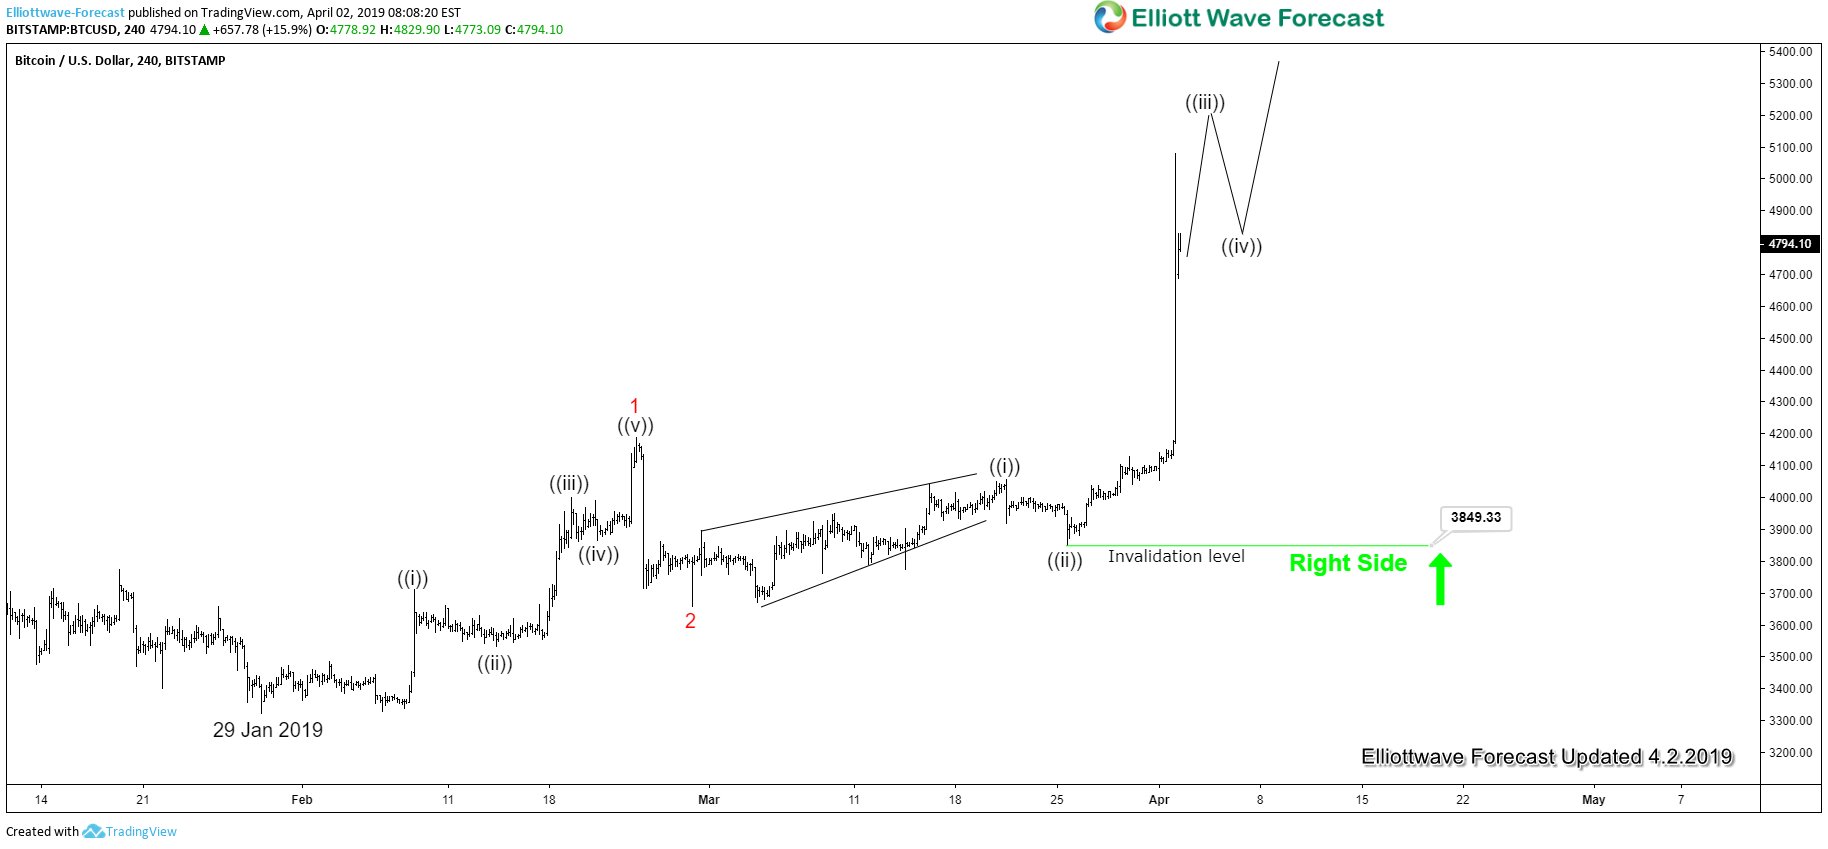
Dips in Bitcoin can now hold above $4200 for further upside in coming months. Below is our latest 4 hour Bitcoin Elliott Wave chart
4 Hour Bitcoin Elliott Wave Chart
From the chart above, we can see the rally from Jan 29, 2019 low is unfolding as an impulse Elliott Wave structure. Up from Jan 29 low, wave 1 ended at $4190 and wave 2 ended at $3658.19. Wave 3 is currently in progress and subdivides as an impulse of lesser degree. Near term, expect more upside in the cryptocurrency as far as dips stay above $3849.33.
For further forecast update on Bitcoin or other stocks, commodities, and forex, take 14 days Free Trial without commitment.
Back


