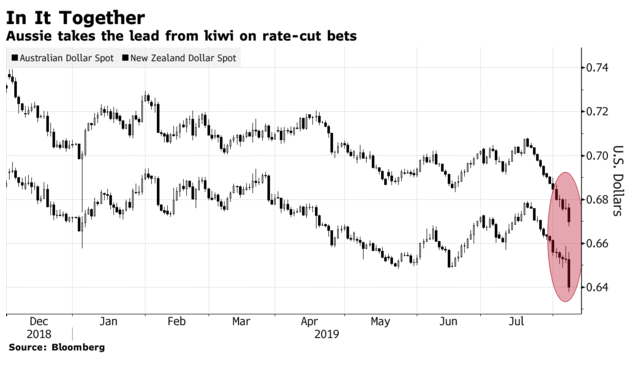
Australian Dollar extended the decline to its lowest in a decade last week. The slump came after RBNZ (Reserve Bank of New Zealand) delivered a bigger than expected interest rate cut. RBNZ governor even went so far and promised to do whatever it takes, including more rate cut, negative rate, QE. This prompts the speculation that RBA (Reserve Bank of Australia) will follow the path. The currency dropped by 1.2% to 0.667 and broke below the January 2019 low of $0.674. This is the lowest level for the AUDUSD since March 2009 during the financial crisis.
Market look to be in a cycle of competitive rate cuts due to the escalating trade war between U.S. and China. After Trump’s threat of additional tariff, China has since let the Yuan slide in daily fixing to support the export. People’s Bank of China (PBOC) has allowed Yuan to weaken past the CNY 7.00 to $1 level for the first time since 2008. The move has dragged other worldwide currencies. South Korean Won, Australian Dollar, New Zealand Dollar all dropped following the Yuan’s move.
A weaker Chinese Yuan puts pressure on emerging market currencies. Back in 2015, a similar break in Yuan caused a sell-off in emerging market currencies, stoking fear of currency contagion. President Trump’s demand for more easing from the Fed to weaken the dollar and sharp depreciation in Chinese Yuan thus has indeed prompted a cycle of competitive rate cuts worldwide. Central Bank in India and Thailand have also announced larger than expected rate cuts last week.
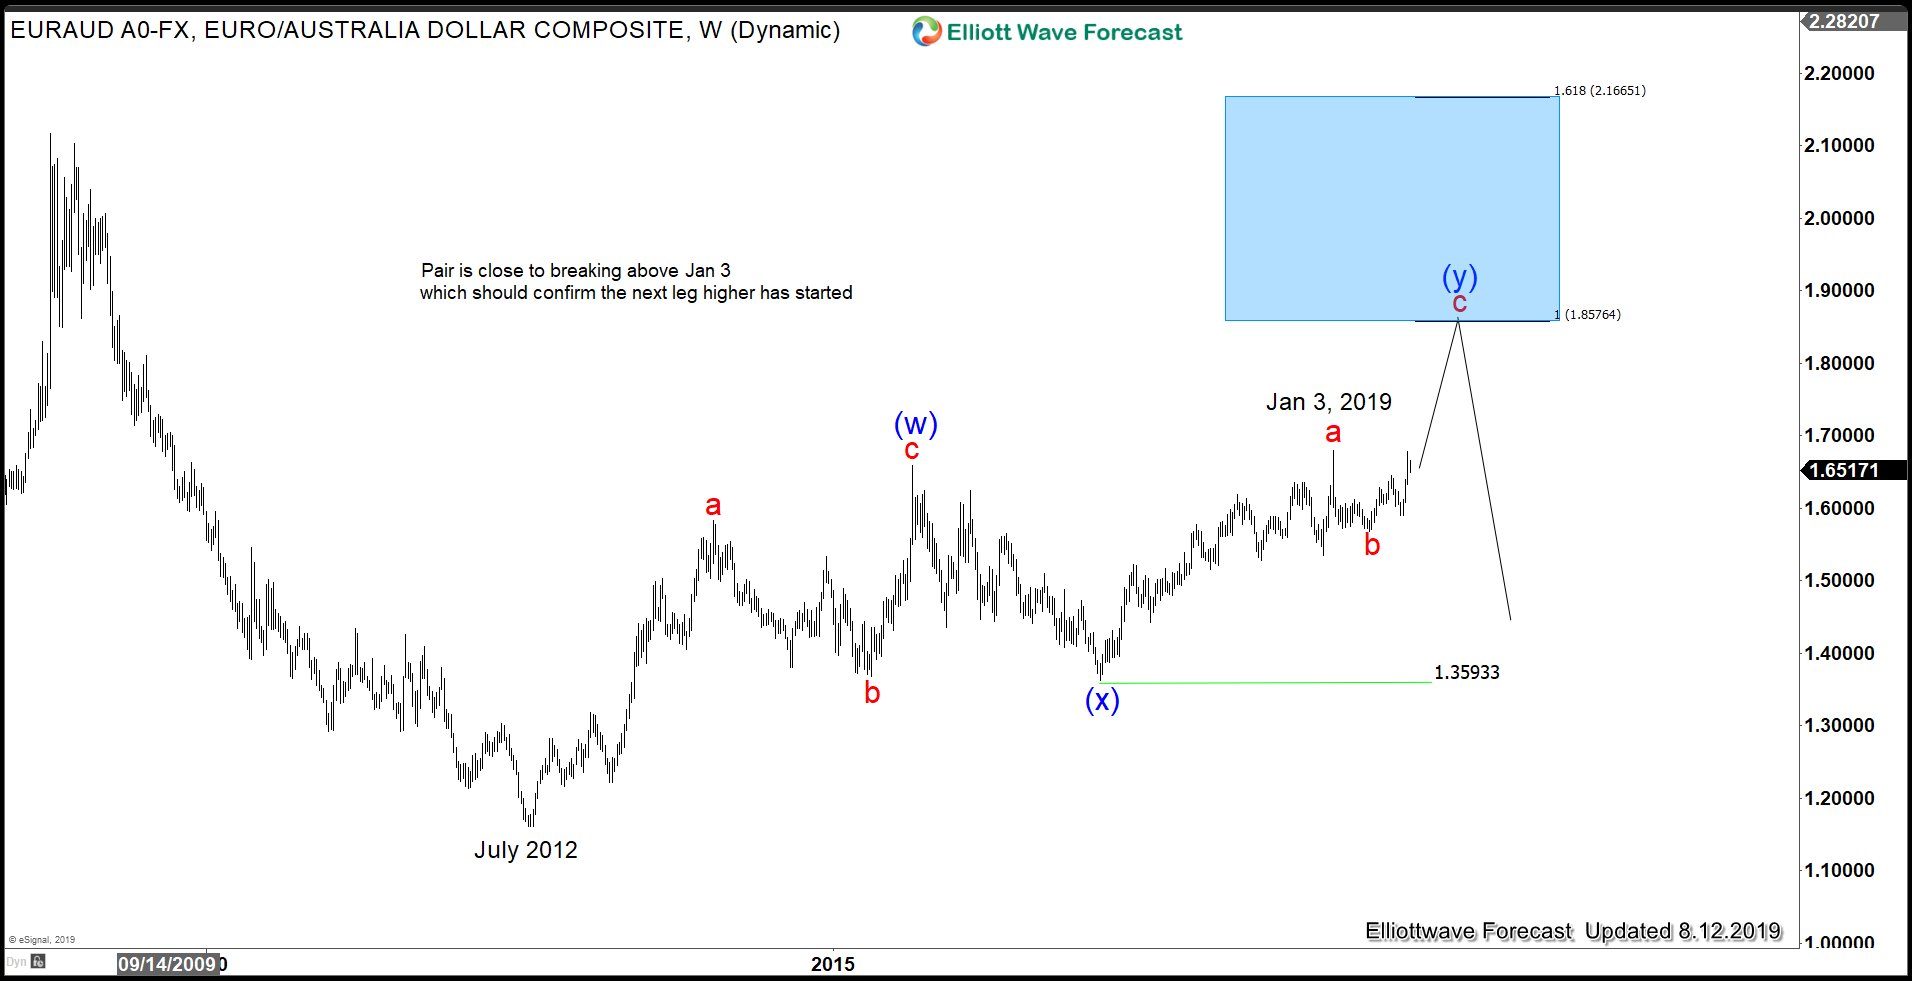
EURAUD Weekly Elliott Wave Sequence
EURAUD shows an incomplete bullish sequence from July 2012. The structure of the rally from there is unfolding as a double zigzag Elliott Wave structure. The pair has a 100% target towards 1.857 – 1.975 area. A break above January 3, 2019 high (1.679) will be a sign that the next leg higher has started. It will also keep pressure in the Australian Dollar. We don’t like selling the pair and continue to favor the upside. However, we’d like to wait for a break above January 3, 2019 high first for confirmation.
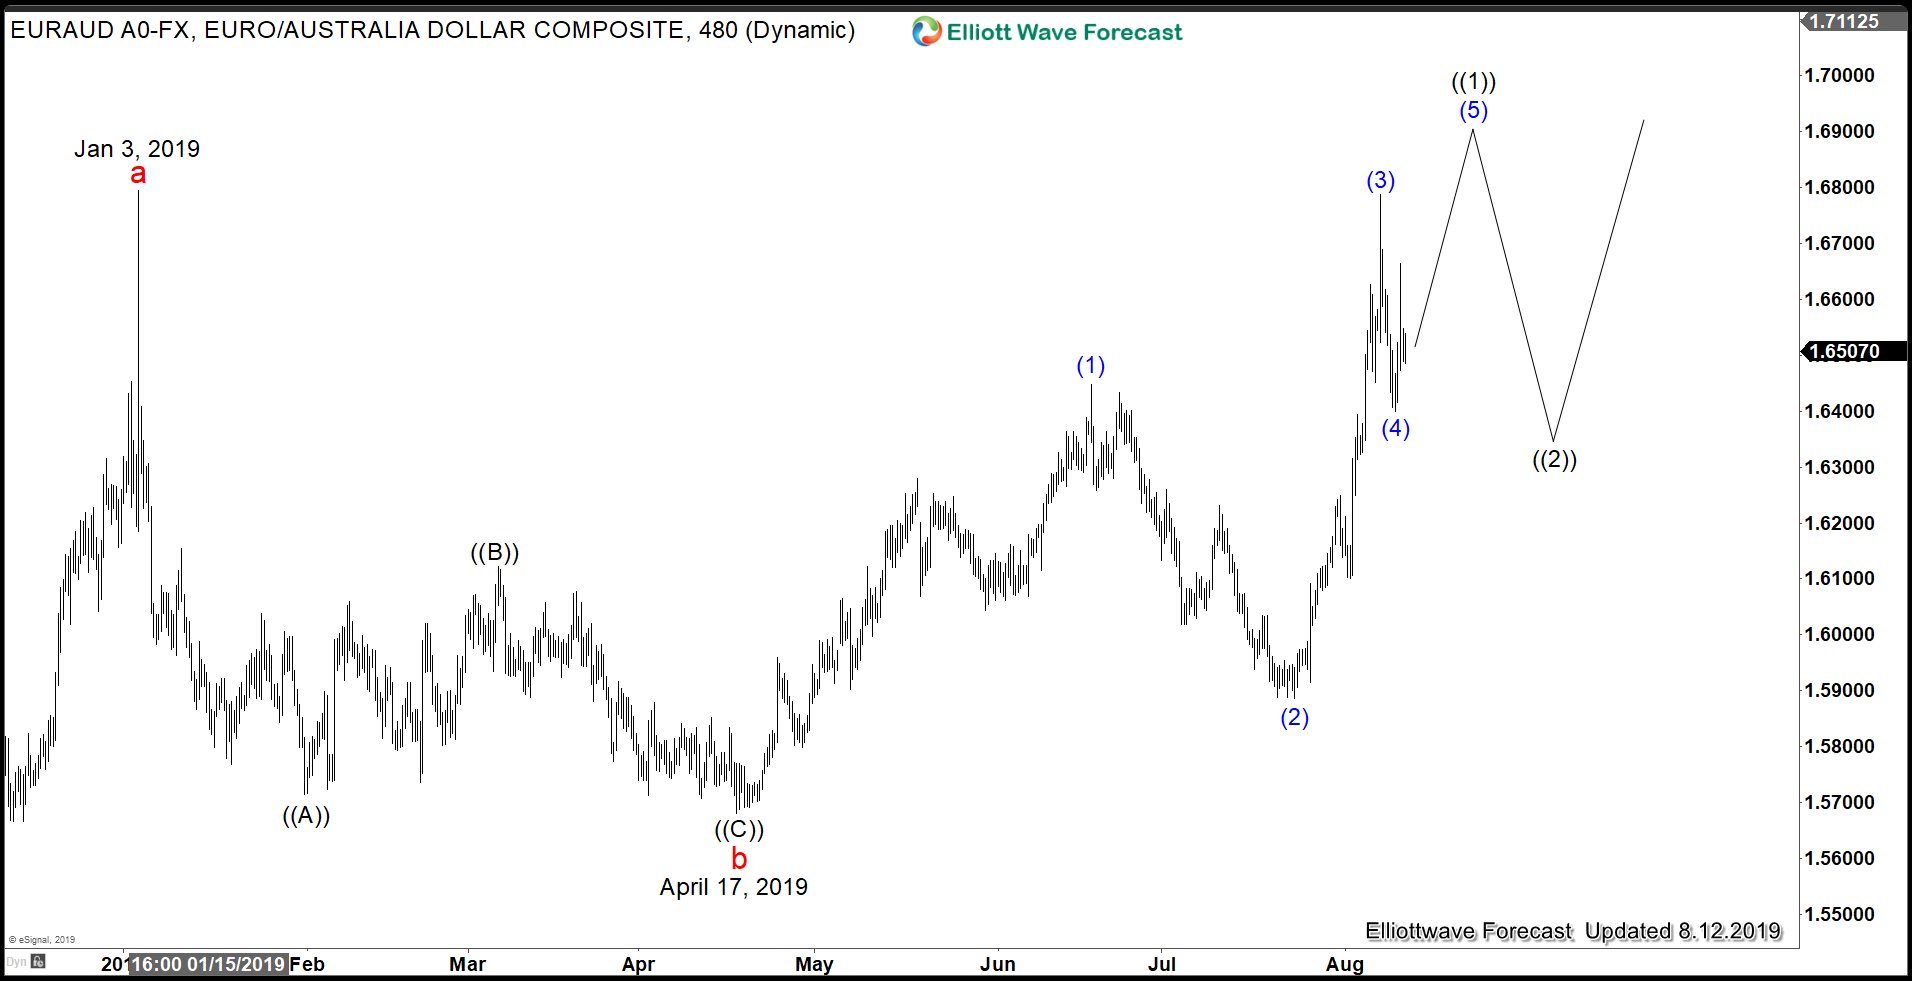
EURAUD Daily Elliott Wave Chart
Above is one possible daily count for the pair. If pair can do 1 more leg higher to complete a 5 waves rally from April 17 low, then it will also break above Jan 3, 2019 high. This should confirm the bullish sequence like the previous weekly chart shows. Once pair breaks above 1.679, then subsequent pullback should be supported in the sequence of 3, 7, or 11 swing.
For more analysis and Elliott Wave charts for 78 instrument, you can try our service 14 days FREE here –> 14 days FREE Trial.
Back


