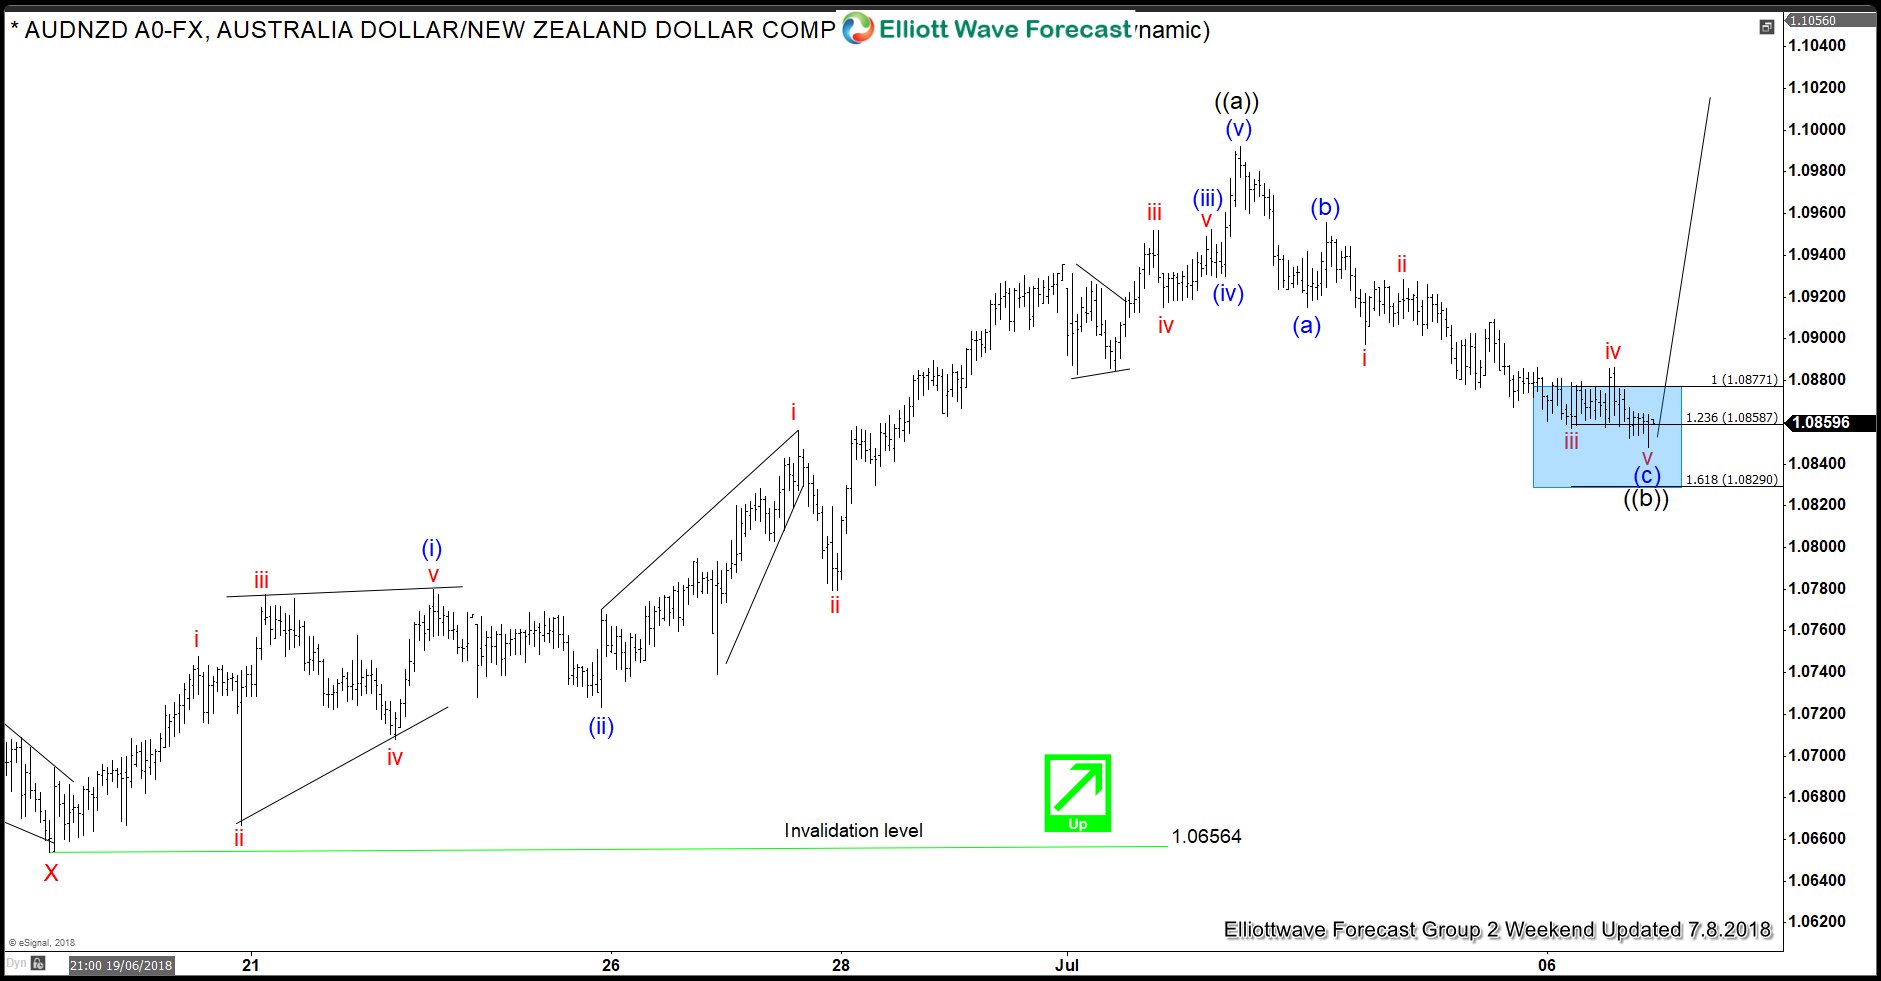
In this blog, I want to share some short-term Elliott Wave charts of AUDNZD which we presented to our members in the past. Below, you see the 1-hour updated chart presented to our clients on the 07/8/18 showing that AUDNZD reached our high-frequency trading blue box area.
AUNZD ended the cycle from 06/19 low, at the high of around 1.09914 (07/03 peak) in black wave ((a)). Blow from that peak, the pair reached equal legs at the areas of around 1.08771-1.08587. We were expecting a reaction higher from that area. The pullback in black wave ((b)) unfolded as an Elliott Wave Zig-Zag (5-3-5) structure. The higher timeframe is suggesting that AUDNZD has more upside follow. So we advised members that the right side in this pair remains to the upside.
AUDNZD 07.08.2018 1 Hour Chart Elliott Wave Analysis
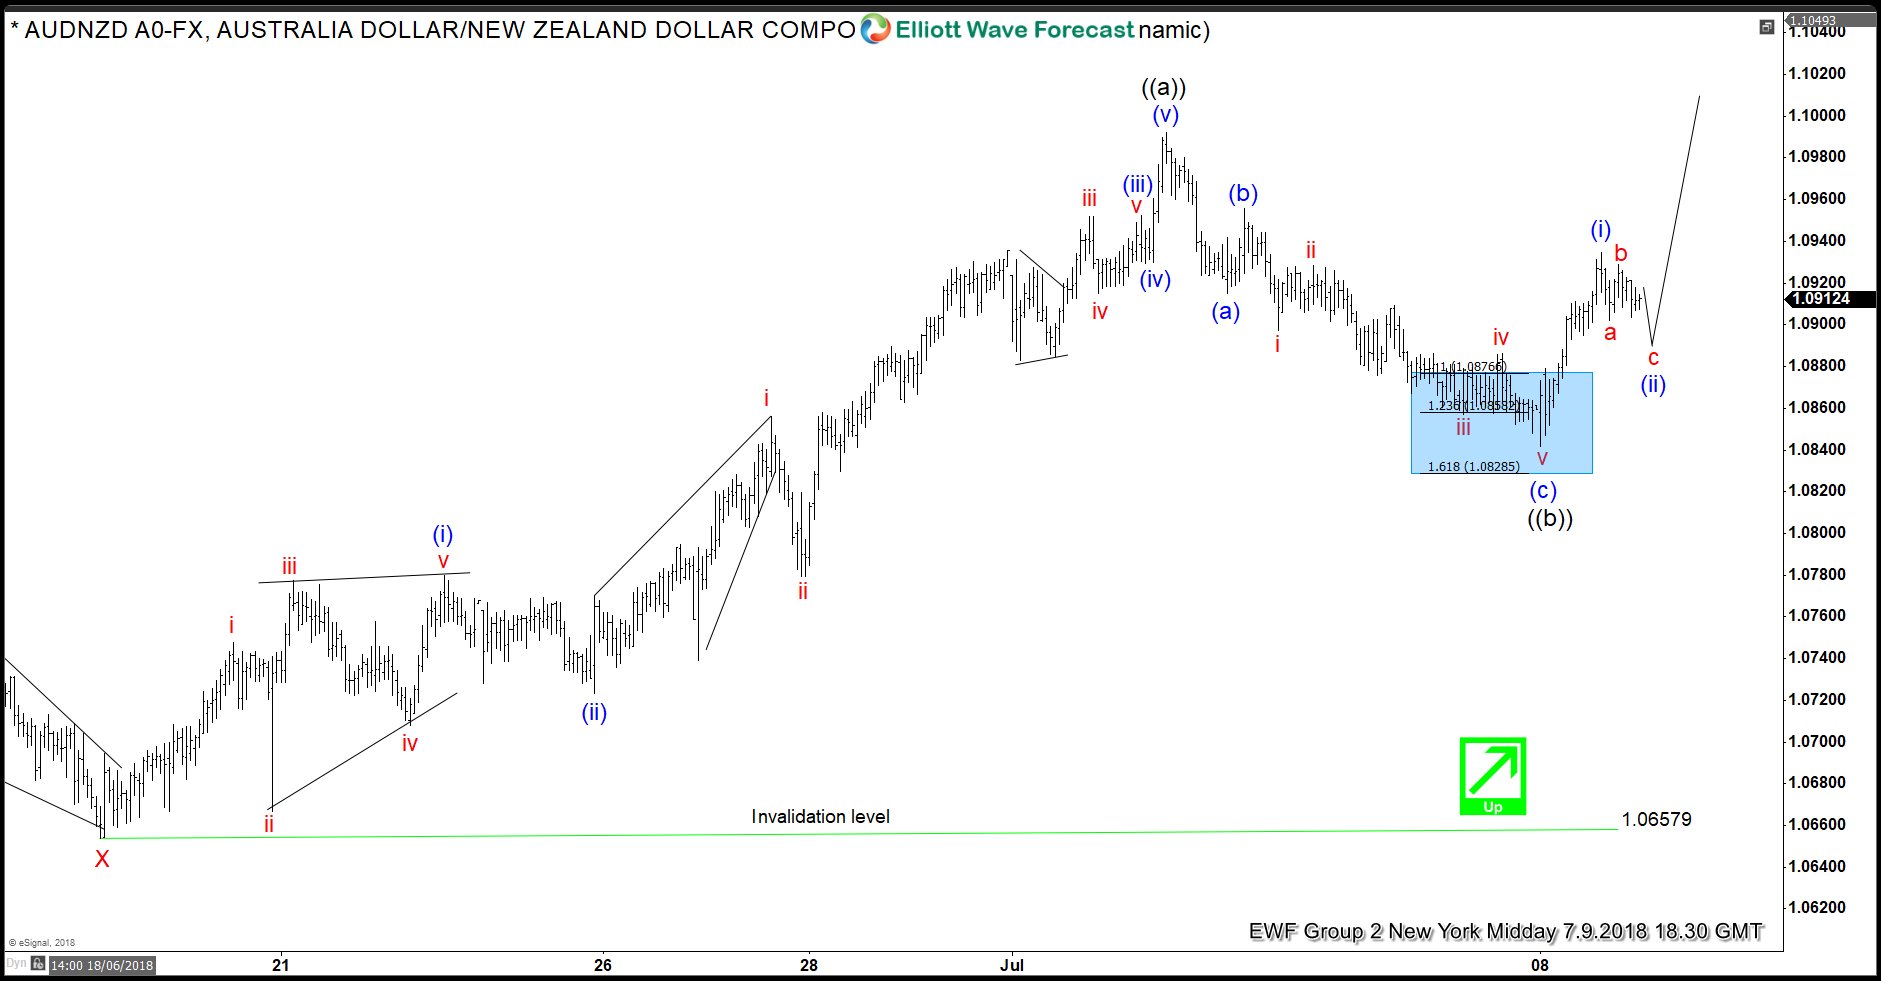
In the last Elliott Wave chart, you can see that AUDNZD rallied to the upside. At this moment in time, we are calling the correction in black wave ((b)) complete at 07/06 low (1.08532) targeting now higher levels. However, a 7 swing correction lower from 07/03 peak can’t be ruled out at this stage. Anyhow, any long trades from the blue box area are risk-free by now. If it can manage to do 7 swing lower, we like buying it in 7 or 11 swings against 1.0658 low. Do please keep in mind that the 1-hour chart which I presented may have already changed. If you want updates every day. I can recommend you to take our special offer below.
AUDNZD 07.9.2018 1 Hour Chart Elliott Wave Analysis
I hope you enjoyed this blog and I wish you all good trades and if you interested in learning more about our unique blue box areas and also want to trade profitably. You can join us now for a 2 for 1 promo. Get 2 month for the price of 1 on all plans. Limited time only!
We believe in cycles, distribution, and many other tools in addition to the classic or new Elliott Wave Principle.
Back


