In this blog, we will have a look at some past Elliott Wave structures of the instrument AUDJPY.
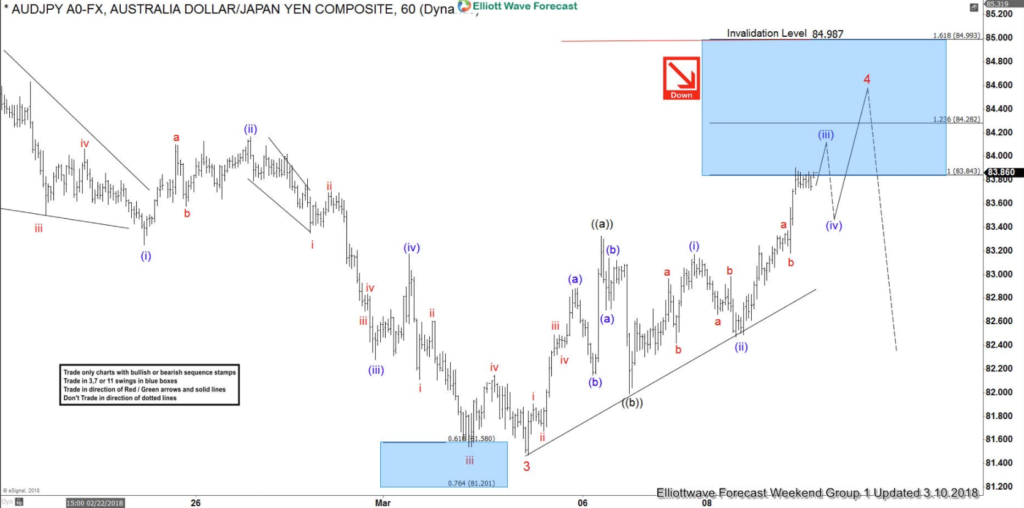
In the chart below, you can see the 1-hour weekend update presented to our members on the 03/10/18. Calling for a double correction in an Elliott Wave Flat correction as the internals from black ((a))-((b))-((c)) proposed to be unfolding in 3-3-5.
We said to our members that AUDJPY has reached already the minimum equal legs target of around 83.843. (100% Fibonacci extension from black ((a))-((b))-((c))). But due to the flat correction, we mentioned also that it can extend within the blue box as part of a flat correction in black wave ((c)). And that the bigger picture wave 4 could be soon in place. Therefore, we advised members that the right side remains to be to the downside. As we were looking for another similar 1-hour push lower.
AUDJPY 03.10.2018 1 Hour Chart Elliott Wave Analysis
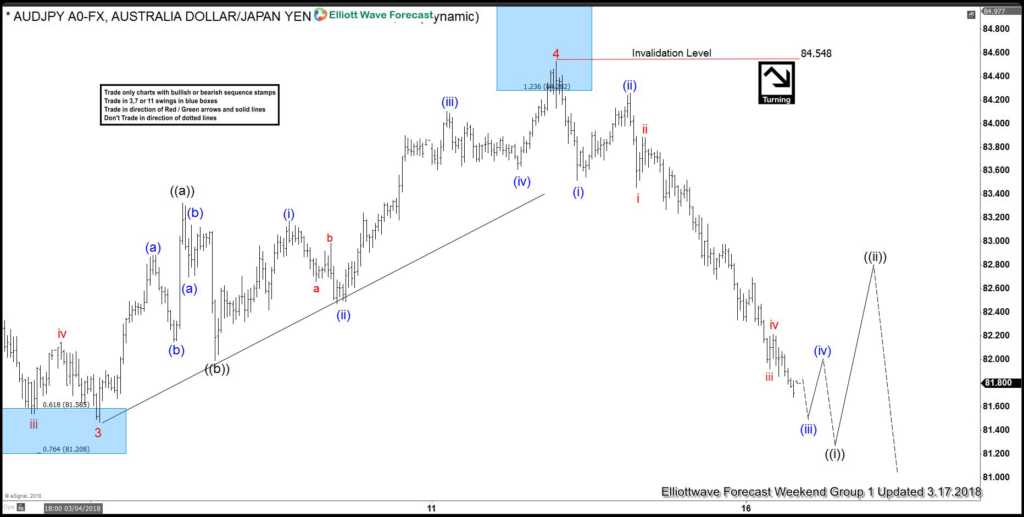
In the Elliott Wave chart below, you can see that AUDJPY made another push higher within the blue box to the 1.236 Fibonacci Extension from black ((a))-((b)). It bounced from the 83.843-84.282 area mentioned above and continued the short-term weakness to the downside very nicely. Confirming that the bigger picture red wave 4 is in place. From that top, the market is possibly unfolding as a 5 waves impulse Elliott Wave structure move lower. We should ideally end soon black wave ((i)) followed by a bounce in black wave ((ii)). As long as the pivot at 84.548 in our distribution system stays intact. The market should continue its weakness.
AUDJPY 03.17.2018 1 Hour Chart Elliott Wave Analysis
I hope you liked this blog and I wish you all good trades. Don’t forget to sign up and get 30% Discount on all plans!!
We believe in cycles, distribution, and many other tools in addition to the classic or new Elliott wave Principle. To get a regular update on the market and Elliott wave charts in 4-time frames.
Back


