XLE Topping Soon
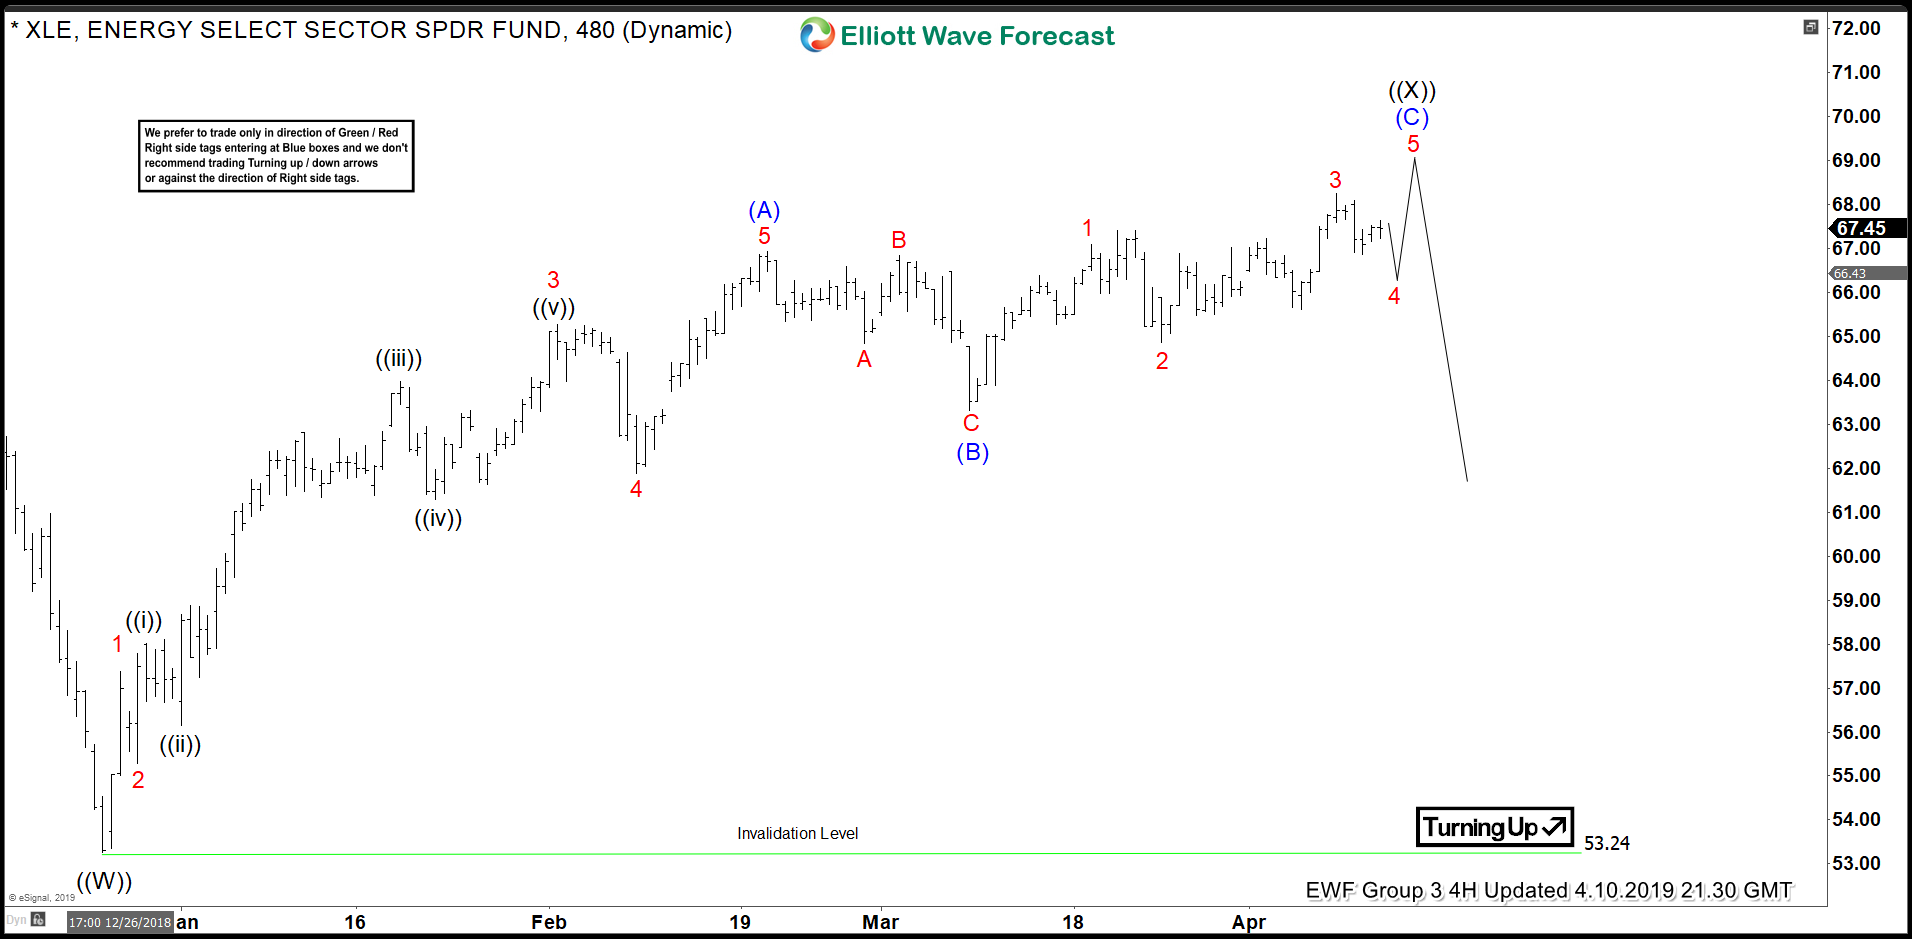
Taking a look at the recent Elliott wave structure in XLE suggests a top may be near. Starting from the 12/24/18 low at $53.25 the energy ETF shows a 5 wave impulse in wave (A) to $66.93 on 2/20/19. From there we count a 3 wave correction to the (B) wave low at $63.31 on 3/8/19. So we see 5 waves up followed by 3 back. This sequence gives a clue for practitioners of Elliott wave on what to expect next. The most likely structure playing out is that of a zigzag. This pattern is characterized by the 5-3-5 structure within its subwaves.
It is the structure from this (B) wave low that we are giving the most attention. The overlapping nature of the price action from $63.31 suggest an ending diagonal wave (C). In an ending diagonal we need 5 overlapping waves before completion. Since we only count 3 waves from the 3/8/19 low the structure has yet to be confirmed.
XLE ZigZag
A Closer Look
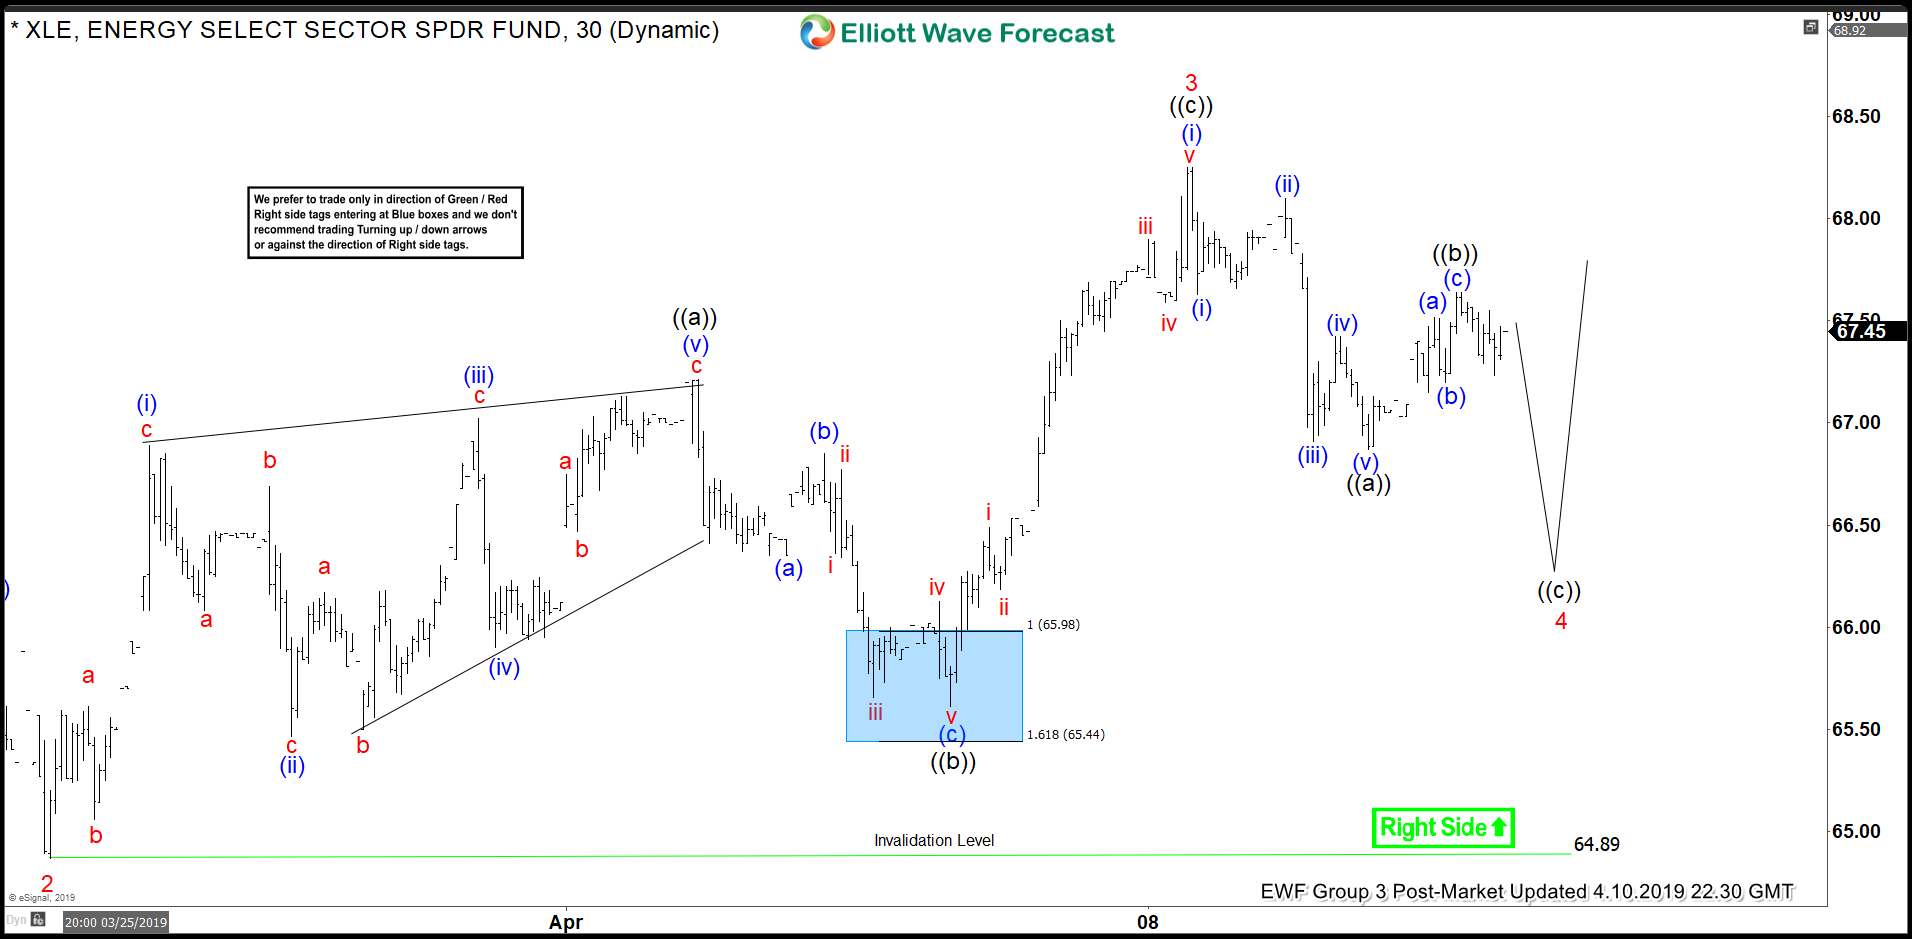
Waves 1, 2, and 3 of the ending diagonal are complete and now we look for wave 4 to end above the wave 2 $64.87 low of 3/25/19. Looking at the chart below we look for wave 4 to end with one more push lower above $64.87 before turning higher for wave 5. This will be confirmed by moving above wave 3’s 4/8/19 high, $68.25. Consequently a push below $64.87 before the new high would suggest that the entire cycle from the 12/24/18 lows has ended. Let’s see how this plays out over the coming sessions.
Come experience how these Elliott wave structures evolve as we map 78 different financial instruments throughout the day. A free trail is available for 14 days. Or, if you’ve taken a trial before and ready to subscribe then check out our Subscription plans here.
Good Luck Out There!
James
Elliottwave-Forecast.com Analytical Team
Back


