Good Day Traders and Investors. In this technical blog we are going to take a look at the Elliott Wave path in The Real Estate ETF (IYR). We will also help answer the question that many ask which is whether the Real Estate market is going to crash due to the Fed hiking rates.
The iShares U.S. Real Estate ETF seeks to track the investment results of the $DJUSRE index composed of U.S. equities in the real estate sector. It provides exposure to U.S. real estate companies and REITs, which invest in real estate directly and trade like stocks.
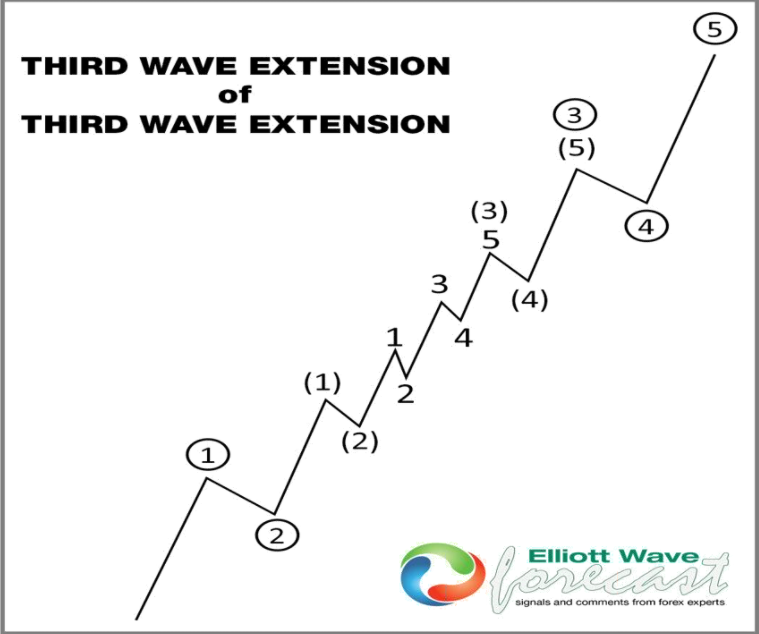
Third Wave Extension
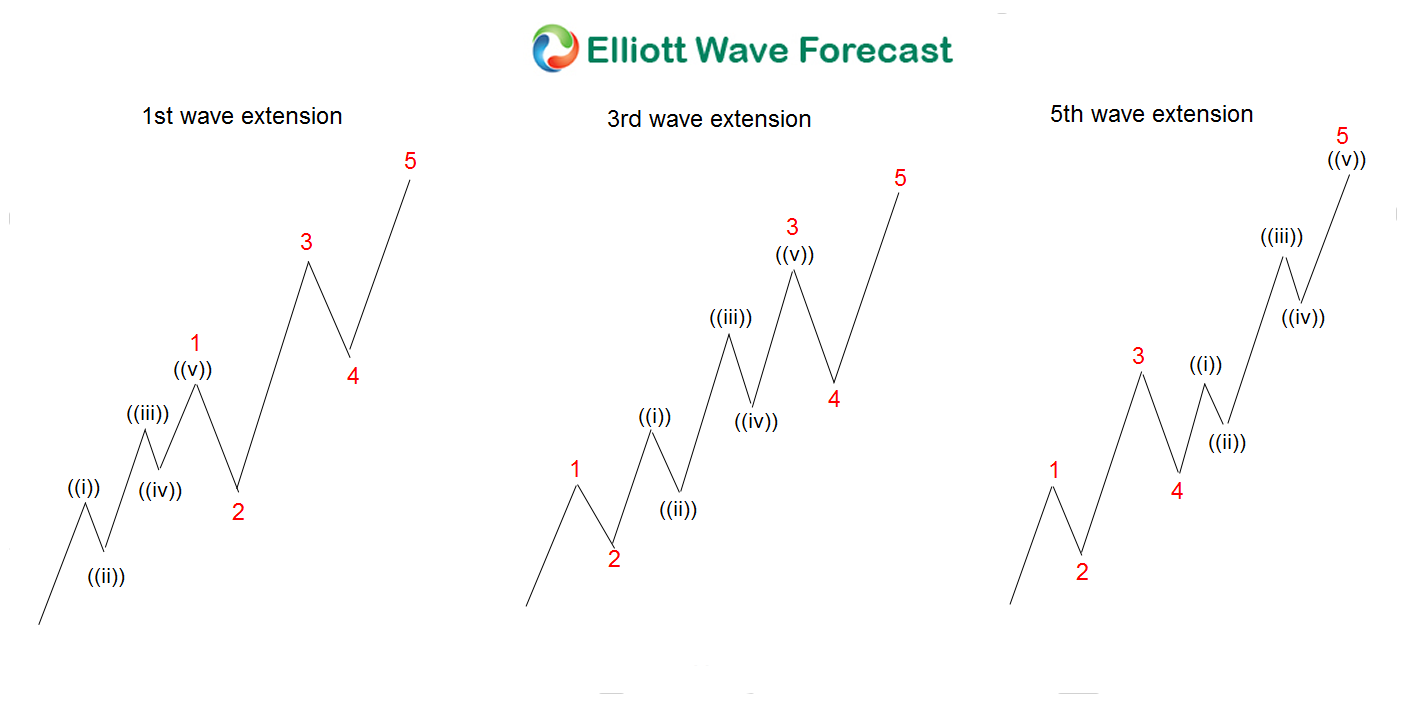
Different Types of Wave Extensions
 Before we deep dive into the charts, I want to explain that the overall structure looks like a nest. A nest is a series of 1-2. Most of the time a nest happens before a huge move takes place. The chart above shows what a nest looks like.
Real Estate ETF (IYR) Monthly Elliott Wave Analysis July 13th 2022
The Monthly Chart above shows the cycle from all time lows back in 2009 unfold in a 5 waves impulse structure breaking 2007 peak creating a bullish sequence against 2009 low. After the peak in February 2020, a correction against 2009 low takes place and buyers appear to take it higher again to break February 2020 peak in another 5 waves structure. Are you starting to notice the series of nests that are unfolding in the chart?
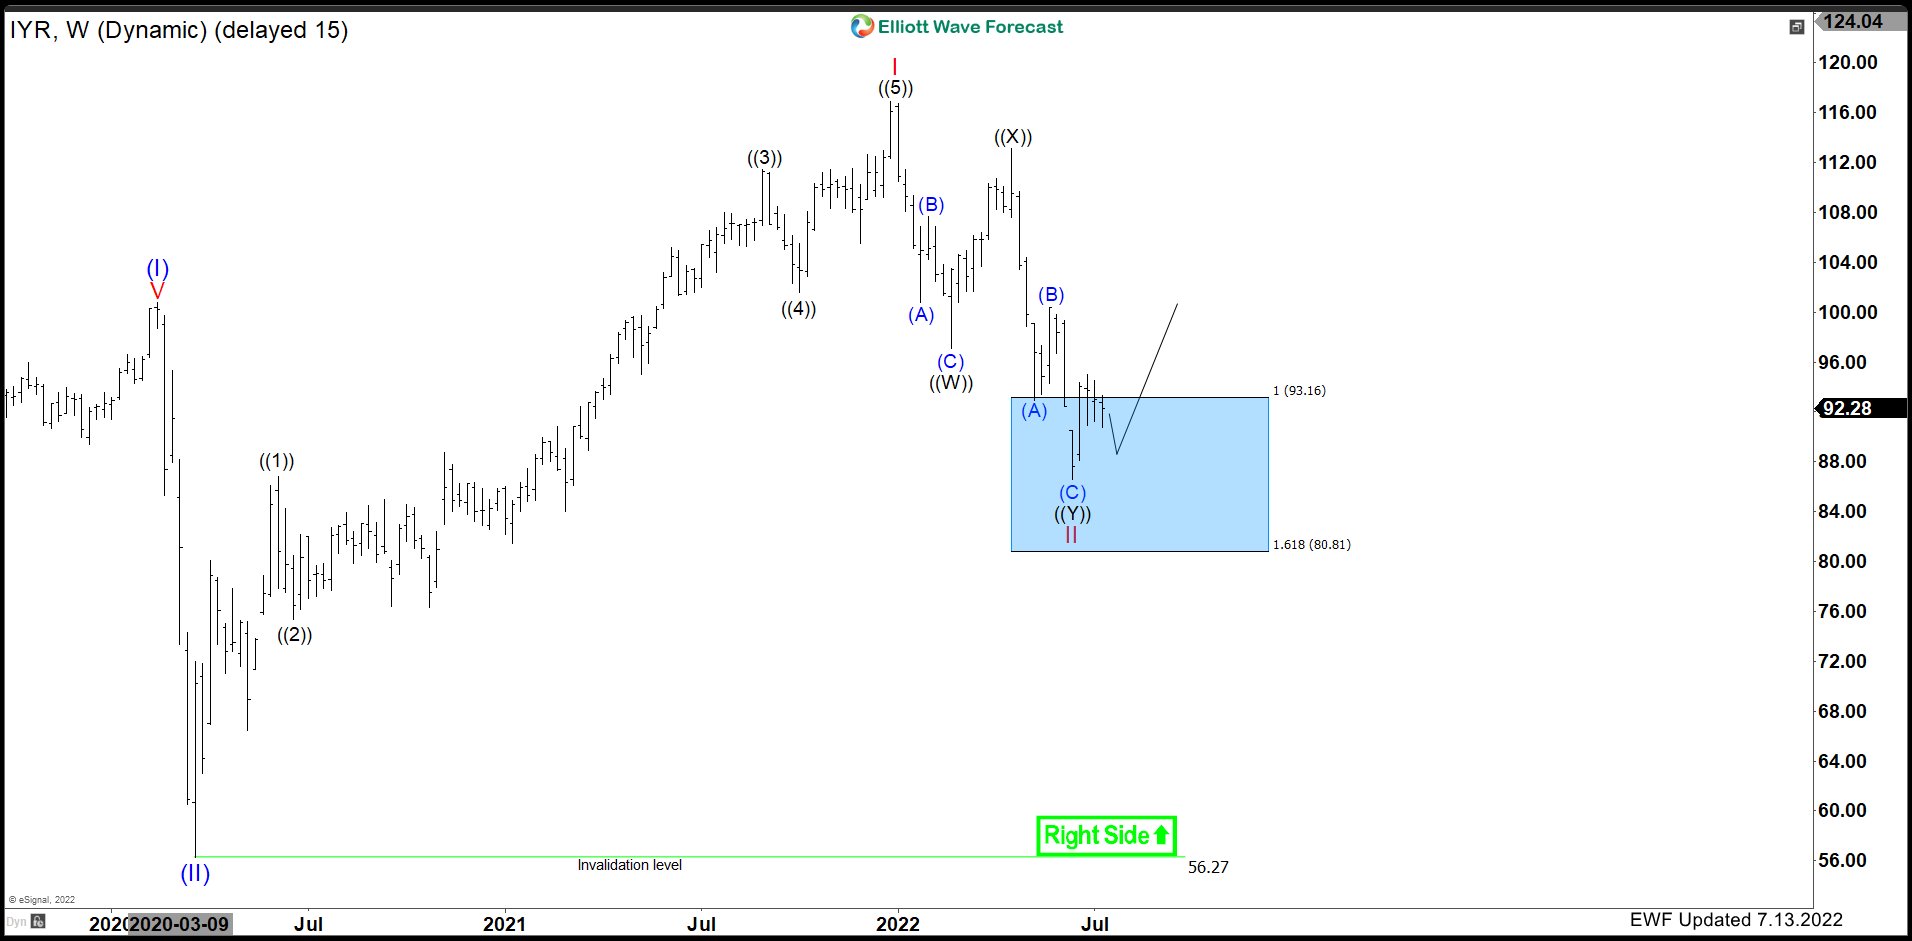
IYR Weekly Elliott Wave Analysis July 13th 2022
The Weekly Chart above shows the cycle from March 2020 low also unfold in another 5 waves impulse structure. Breaking all time highs and creating another bullish sequence against March 2020 low. After the peak in late December 2021, IYR is now favoured to be correcting against March 2020 low in a Double three structure (7 swings) and it is in the Blue Box area ($93.16 – 80.81) where a reaction higher can take place soon. From here, we would look to continue the rally and break the all time high at $116.89. If you’ve been following EWF for a while, then you should know our motto by now which is We like to buy dips in 3, 7 or 11 swings into blue boxes.
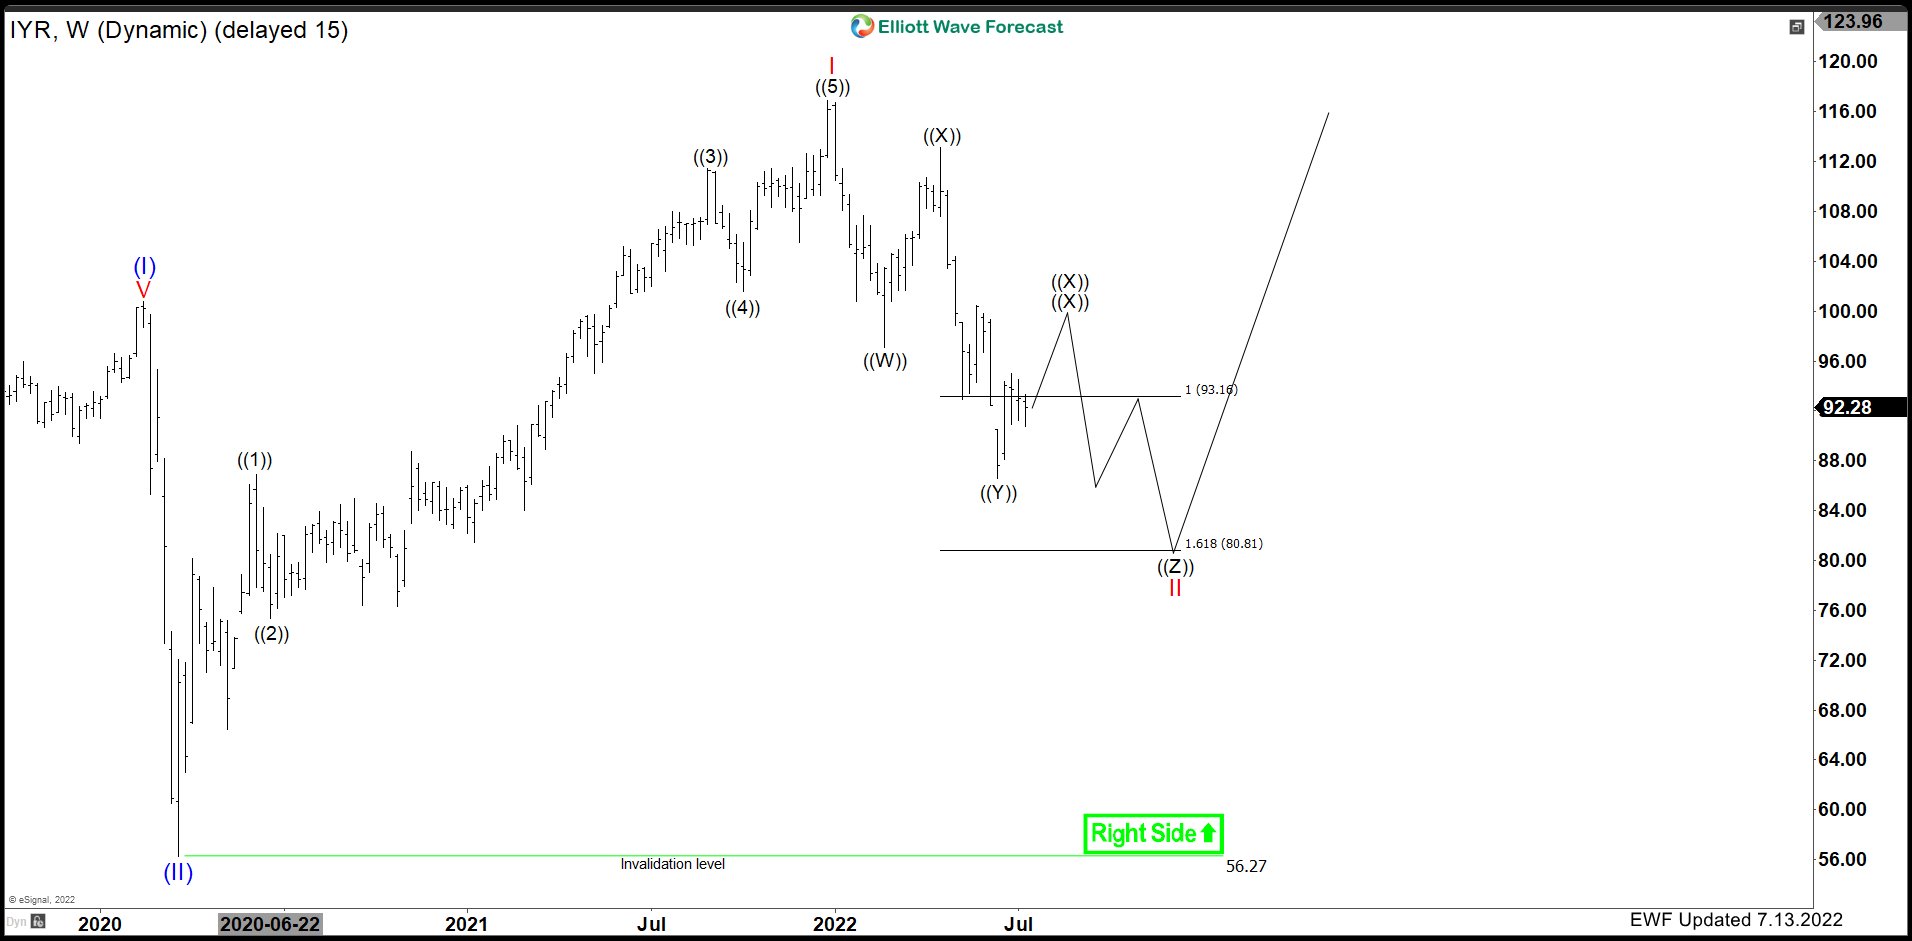
IYR Weekly EWF Alternative View July 13th 2022
What about the alternative view? We at Elliottwave Forecast look at all the possibilities and try to educate our members on alternative counts. The Weekly Chart below shows the alternative view on IYR:
As you know already, after a 7 swings correction into a blue box area, buyers should appear for a reaction higher in minimum 3 waves. Any longs from the blue box area can get risk free. A break of the lows after the reaction higher is completed, will signal that it can be doing a triple three structure (11 swings) where we can attempt to buy again once we have the Double ((X)) connector set. Remember, We like to buy dips in 3, 7 or 11 swings into blue boxes for a continuation to the upside as long as the March 2020 lows at $56.27 remains intact.
To conclude, We at EWF view the Real Estate Market as bullish. We like to buy dips in 3, 7 or 11 swings into Blue Box areas. I hope this blog has helped shed light and answer some of the questions you might of had.
Elliott Wave Forecast
We cover 78 instruments in total, but not every chart is a trading recommendation. We present Official Trading Recommendations in the Live Trading Room. If not a member yet, Sign Up for Free 14 days Trial now and get access to new trading opportunities. Through time we have developed a very respectable trading strategy which defines Entry, Stop Loss and Take Profit levels with high accuracy.
Welcome to Elliott Wave Forecast!
Back


