Cycle, Trend, and Seasonality make up three components of price movement. There is also a fourth component which is noise. Noise is everything else that can’t be explained by the other three components. Cycles can be complex and difficult to see because there’s often a combination of large and smaller patterns, and cycles within cycles, all operating at the same time in different time frames. As an example, we can have bearish cycle is the short time frame, a bullish cycle in medium time frame, and a bearish cycle in the long time frame. The most important cycle is the long-term cycle or the dominant cycle. A simple way to begin the search for the major cycle is by looking at long-term chart, such as the weekly and daily chart.
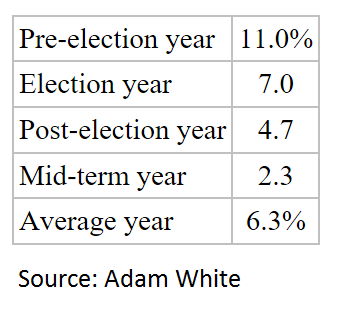
There are several well known cycles, such as Business cycle (8.6 years), Kondratieff cycle (54 year cycle), and U.S. Presidential Election Cycle. As 2016 is a U.S. presidential election year, we will take a look at the historical stock return data for presidential election cycle. The table below shows the U.S. Presidential Election cycle from 1912 – 1992 based on the percentage return of the DJIA
The findings suggest the year preceding the election (year 3 in the president’s term) posts the strongest gain for the market, followed by a decent return in election year. Stock market action during the election year is always more erratic, as parties fight over each other. The two years after election show subpar returns as the reality of politics comes through and implementation by the new administration turn out unpopular.
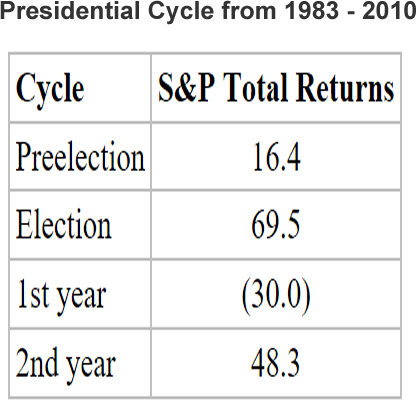
The more recent research of the presidential election cycle also confirms the findings above as the table below shows the S&P futures return during the U.S. Presidential election cycle from 1983 to 2010
Source: Perry J. Kauffman, Trading Systems and Methods
The more recent presidential election suggests moderately good returns in the pre-election year, and great returns in the election year as all nominees promise great things to get elected. Then in the first year of the office, reality returns as the new president attempts to fulfill campaign promises but use the opportunity to do unpopular reforms.
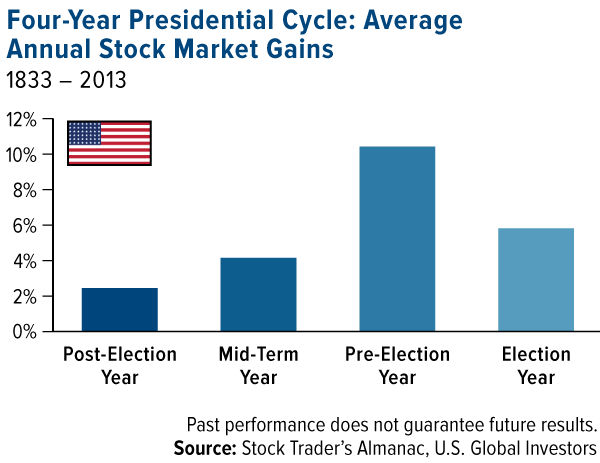
The chart below summarizes average annual stock market gain in 4 year presidential cycle from 1833 – 2013
If the statistics above hold true for this year, then regardless who’s winning, whether Hillary Clinton or Donald Trump, 2017 likely shows below average return or even negative return in the stock market.
Take our free 14 Day Trial to get our view in world indices, forex, and commodities. We provide Elliott Wave chart in 4 different time frames for 52 instrument including forex, indices, and commodities. 1 hour chart is updated up to 4 times a day along with three live sessions, 24 hour chat room moderated by our expert analysts, market overview, and much more!
For free resources, you can check other technical articles at our Technical Blogs and check Chart of The Day. If you are new to Elliott wave, then visit our educational portal below and see how we can help
Back


