XLF and BAC
In this brief blog we’re going to look at the XLF ETF as well as Bank of America (BAC) for evidence that the broader financials have found some footing after the October bludgeoning most financial stocks endured.
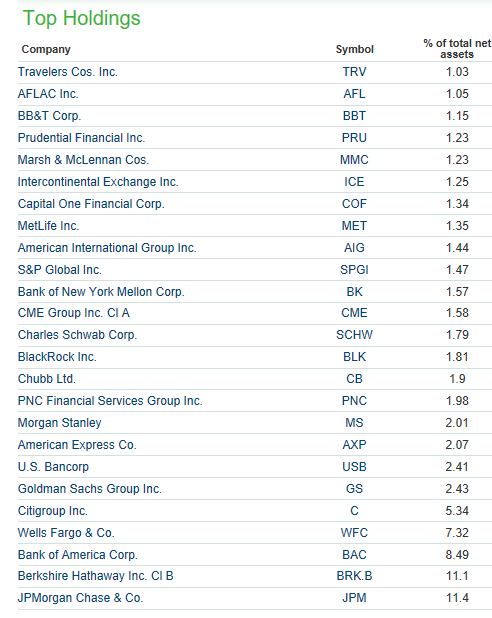
Within the Financial Select Sector SPDR ETF (XLF) Bank of America (BAC) represents a weighting of 8.49% making it the 3rd heaviest component just behind Berkshire Hathaway B shares (BRK.B) at 11.1% and JPMorgan Chase & Co. (JPM) at the top with an 11.4% allocation of total fund assets. While we do cover both XLF and BAC in our Group 3 analysis we don’t cover any other financial stocks on a regular basis so our analysis of the sector will be biased toward the structure of BAC and its overall correlation with XLF.
XLF Top Holding by % of Total Net Assets.
The Elliott Wave Analysis of XLF
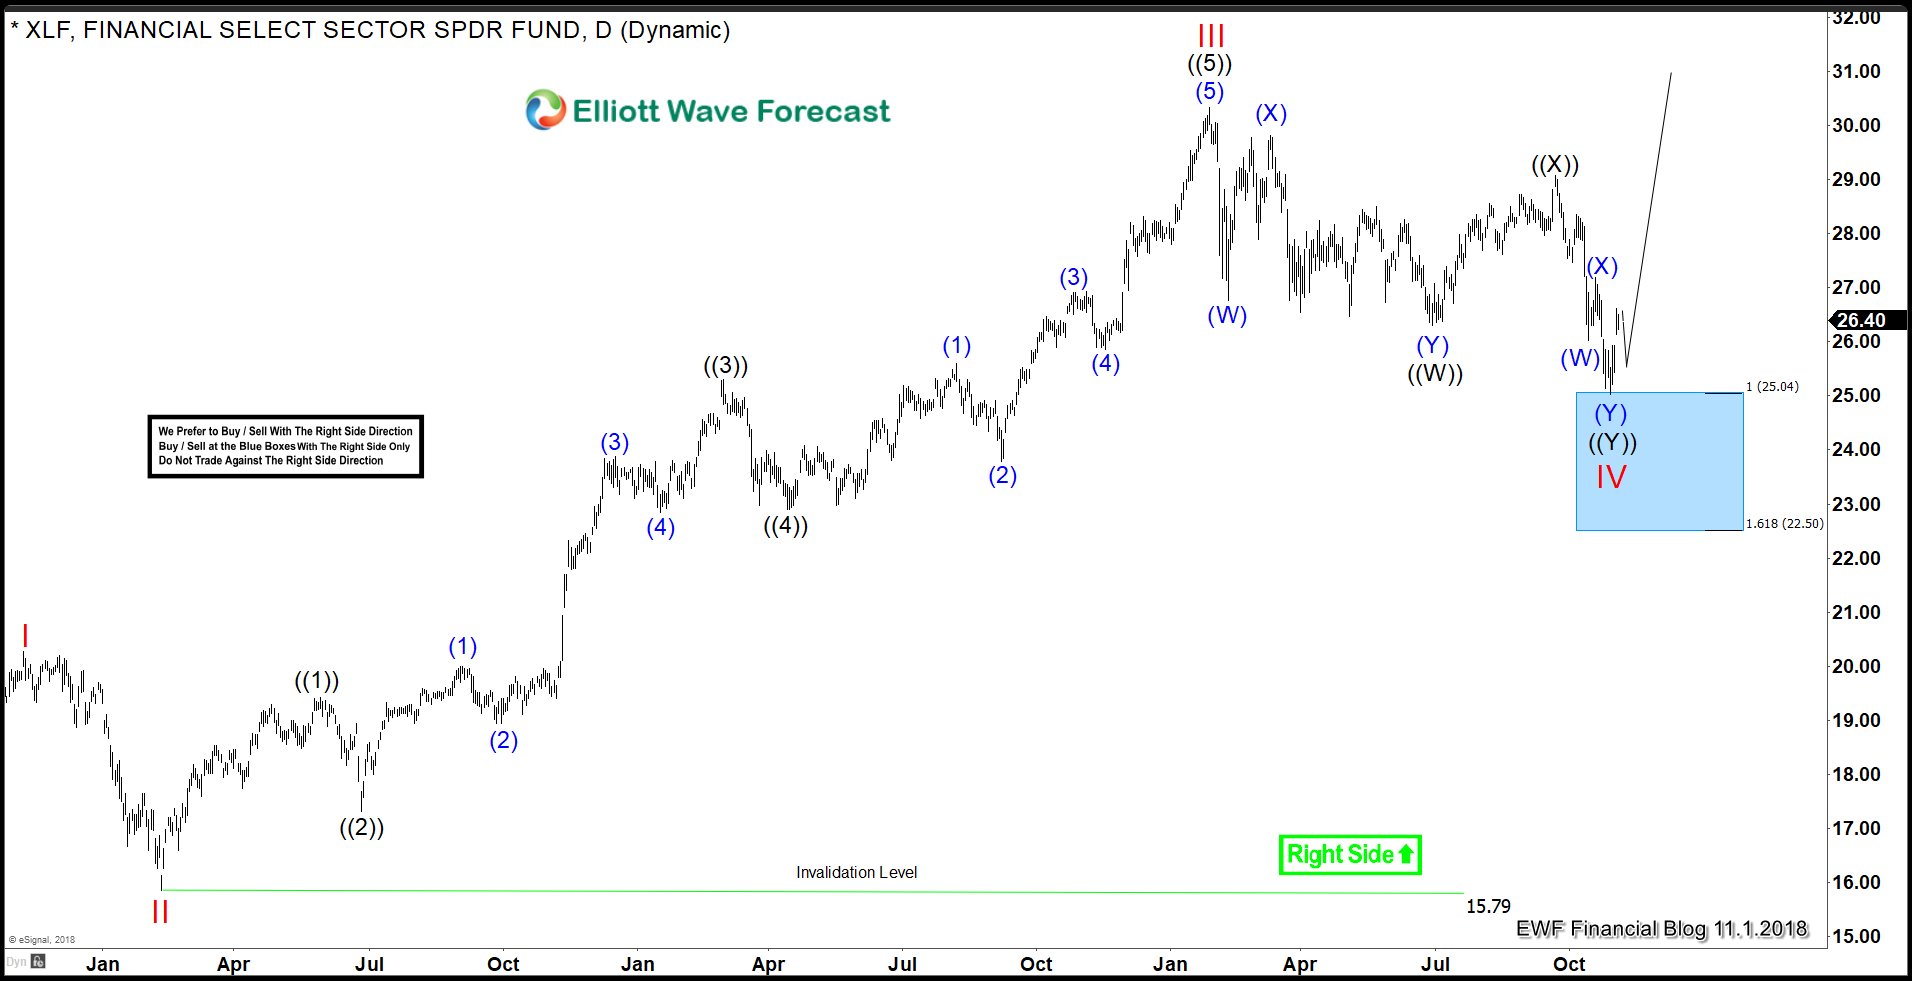
From the February 2016 Cycle degree wave II lows at 15.86 XLF progressed impulsively in its Cycle degree wave III reaching an all time high of 30.33 in January of this year, 2018. We now see evidence that the Cycle degree wave IV had completed via the following double three corrective sequence. Primary degree wave ((W)) printed its low on 6/28/2018 at 26.31. Up from there Primary degree wave ((X)) is stated complete at the 29.07 high of 9/20/2018.
An ideal projection for the completion of Primary degree wave ((Y)) would equal the length of aforementioned Cycle degree wave III high of 30.33 to the Primary degree wave ((W)) low at 26.31 giving a measurement of 4.02. By subtracting 4.02 from the high of Primary degree wave ((X)) we can contend that an ideal target for Primary wave ((Y))’s completion to be 29.07 – 4.02 = 25.05. On 10/26/2018 XLF hit a low of 25.02 and has since reacted higher signifying that at the very least the cycle from the Primary degree wave ((X)) is over. Bottom line is doesn’t really get more accurate than a 0.03 variance in actual vs target.
The Elliott Wave Analysis of BAC
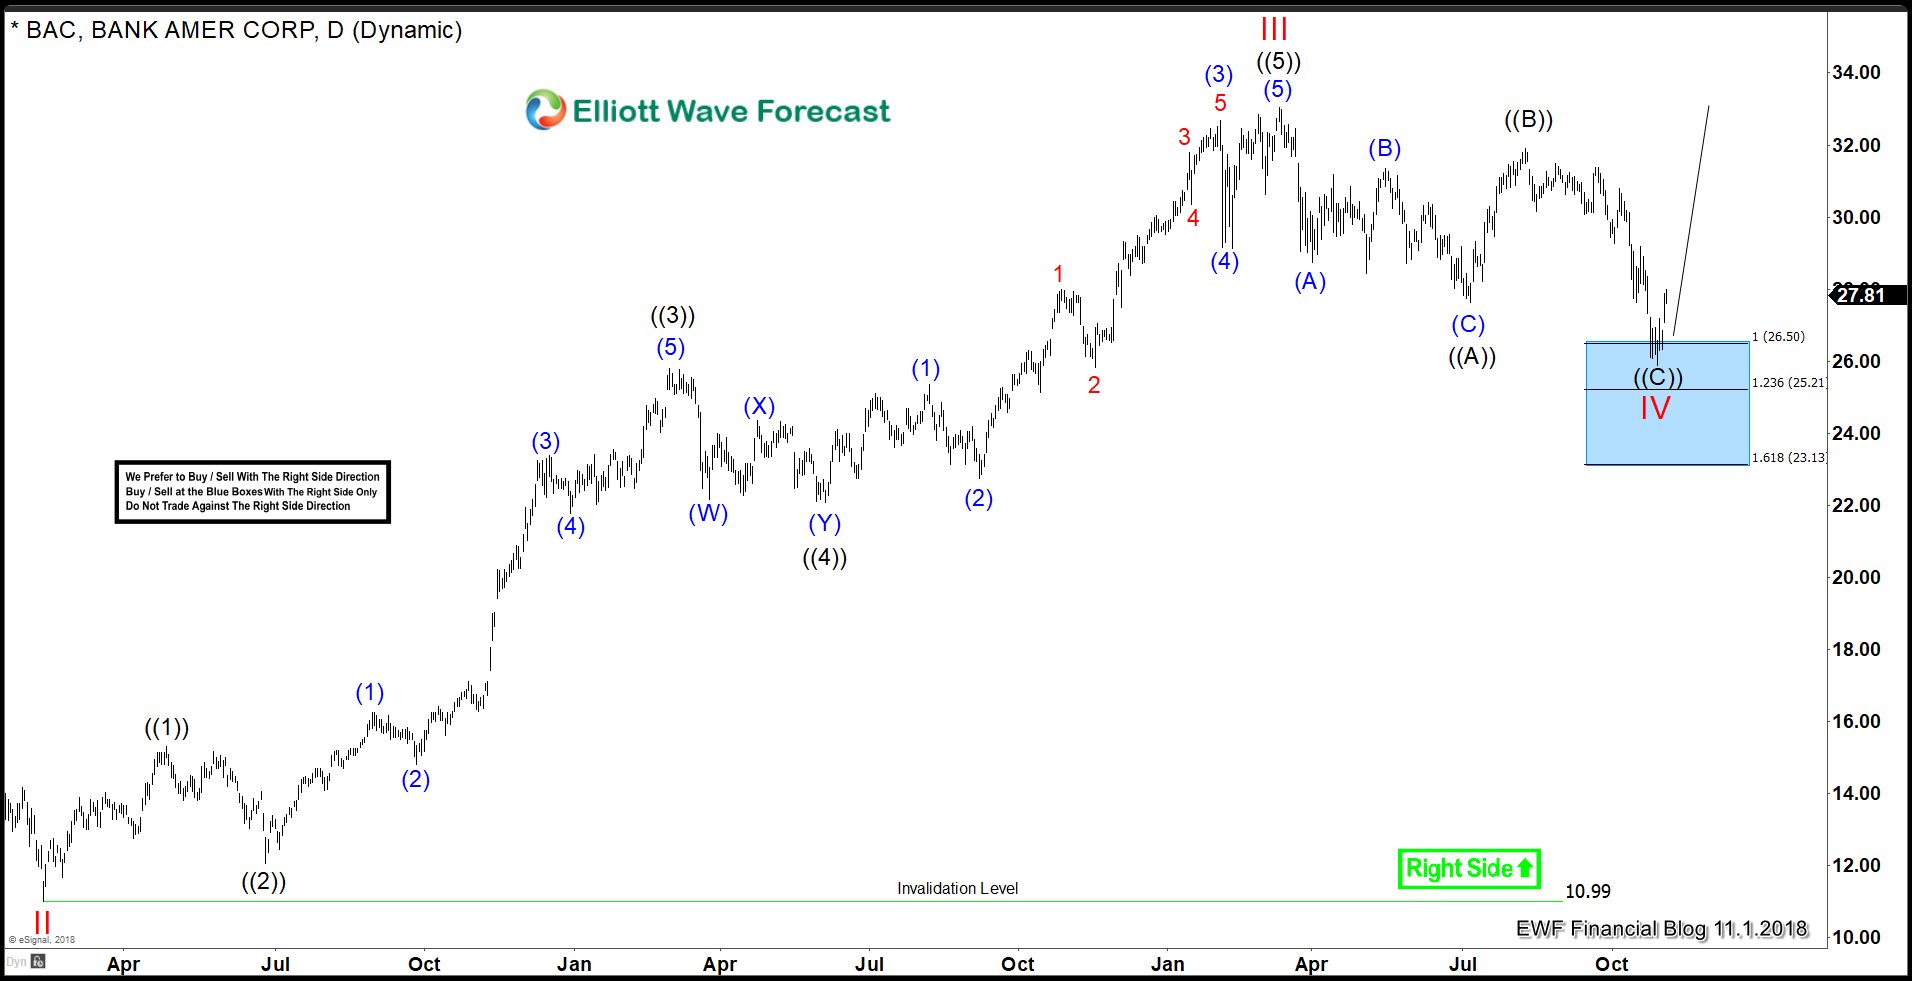
From the same February 2016 Cycle degree wave II lows as XLF, BAC progressed in a motive manner in its Cycle degree wave III reaching an all time high of 33.05 on 3/12/2018. The correction off this all time high has progressed in a flat 3-3-5 wave correction. The first 3 waves ended Primary degree wave ((A)) at 27.63 on 7/6/2018 with a price action high-to-low range of 5.42. If we project this range from the top of Primary degree wave ((B))’s high of 31.91 on 8/8/2018 we can expected Primary degree wave ((C)) to progress toward the result of 31.91 – 5.42 to equal 26.49. At this extreme we should see at the very least a strong reaction upwards and, at the very best, a reversal higher in Cycle degree wave V.
On the same day that XLF is proposed to have completed its low, BAC printed a low of 25.88. BAC is now reacting higher and is poised to prove a bullish sequence off the 25.88 low over the coming sessions. While the variance in actual vs target lows in BAC is greater than that of XLF the variance for BAC is sill relatively low at 0.61. The minimal target for Cycle degree wave V is a print above Cycle degree wave III. So that means if our long was set for the equal leg entry of 26.49 our risk was less than 1.00 for a target of +6.56. I’ll take a 6.56 reward vs risk ratio every day of the week.
Looking for Longs.
The evidence is clear and correlated that XLF and BAC are both reverting back to their bullish trends. Both BAC and XLF are buys, but where do we initiate longs? And, what is our level of acceptable risk?
In the Group 3 service that covers both instruments we look for progressive evidence of a bullish sequence off the 25.02 low in XLF and the 25.88 low in BAC. We use a very specific entry methodology with these type of setups currently seen in both XLF and BAC that reduces risk to a minimum. To learn more about this methodology and its relation to the XLF, BAC, and all other 24 instruments in Group 3 be sure join our service. If you’re not ready to fully commit yet you can also try us out for free for 14 days with no risk.
Trade Safe!
James
EWF Analytical Team
Back


