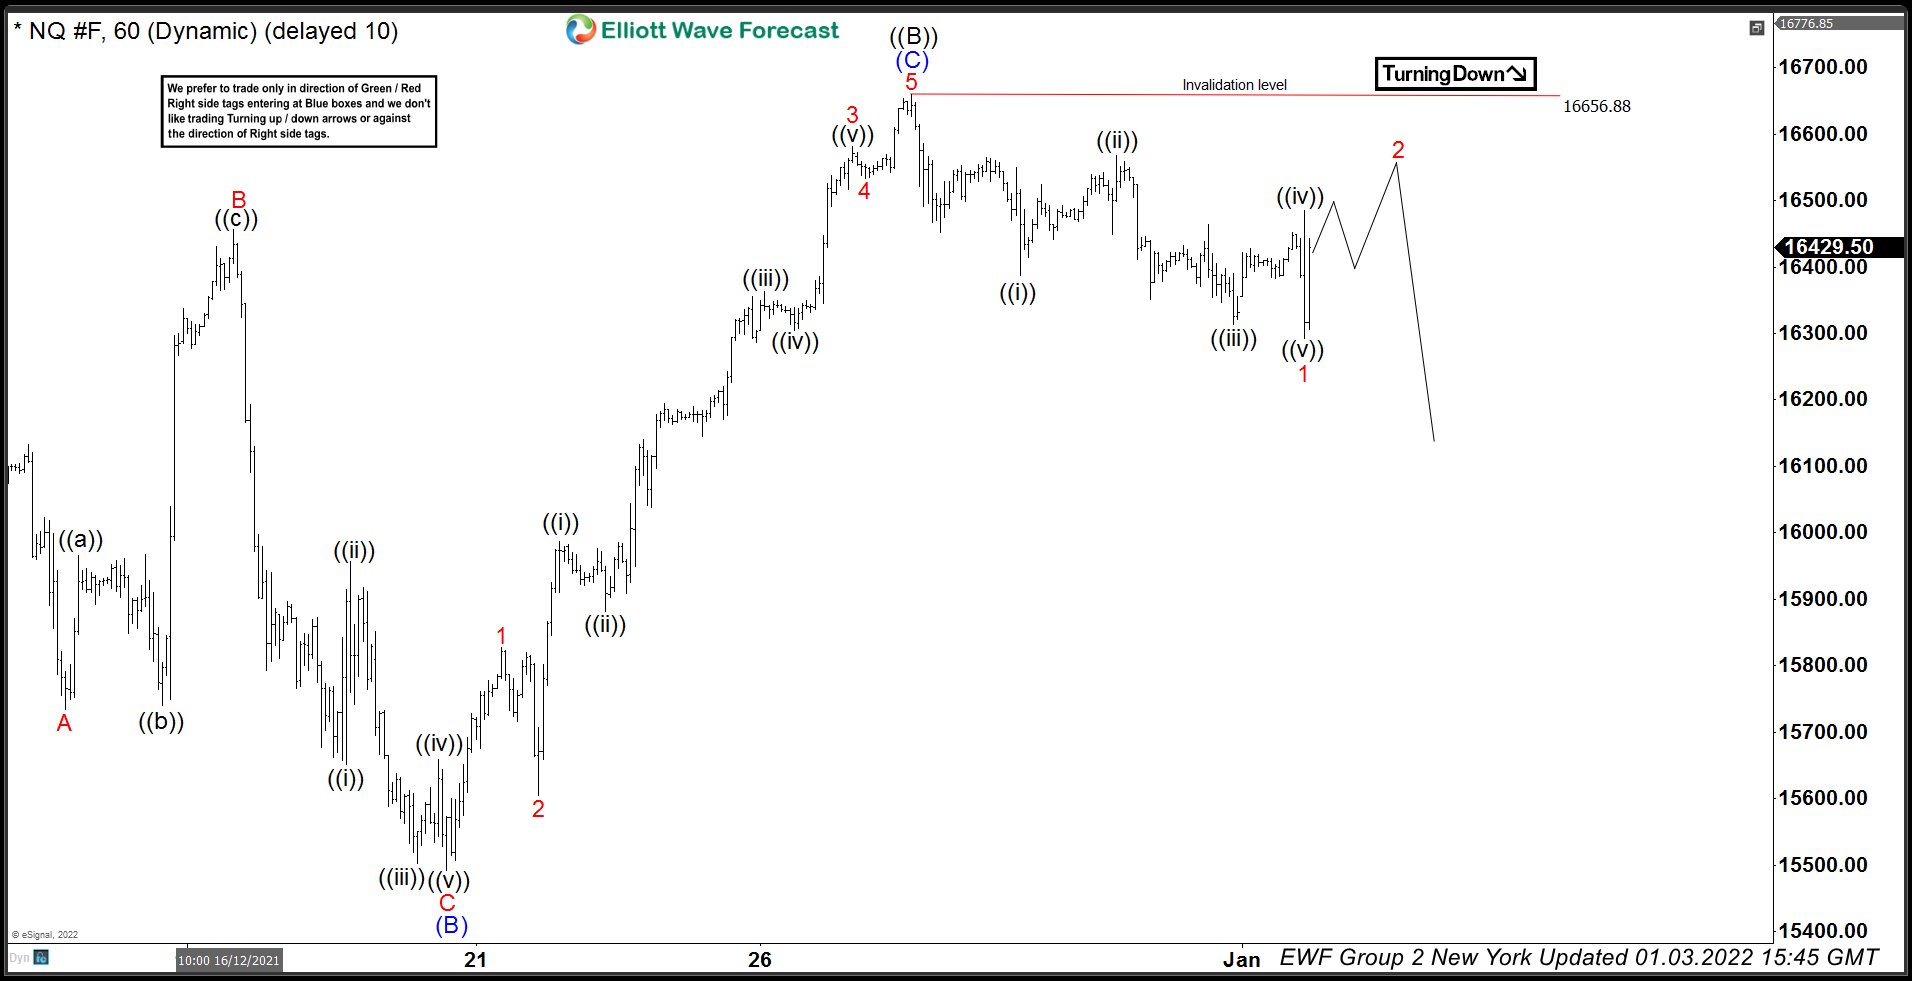
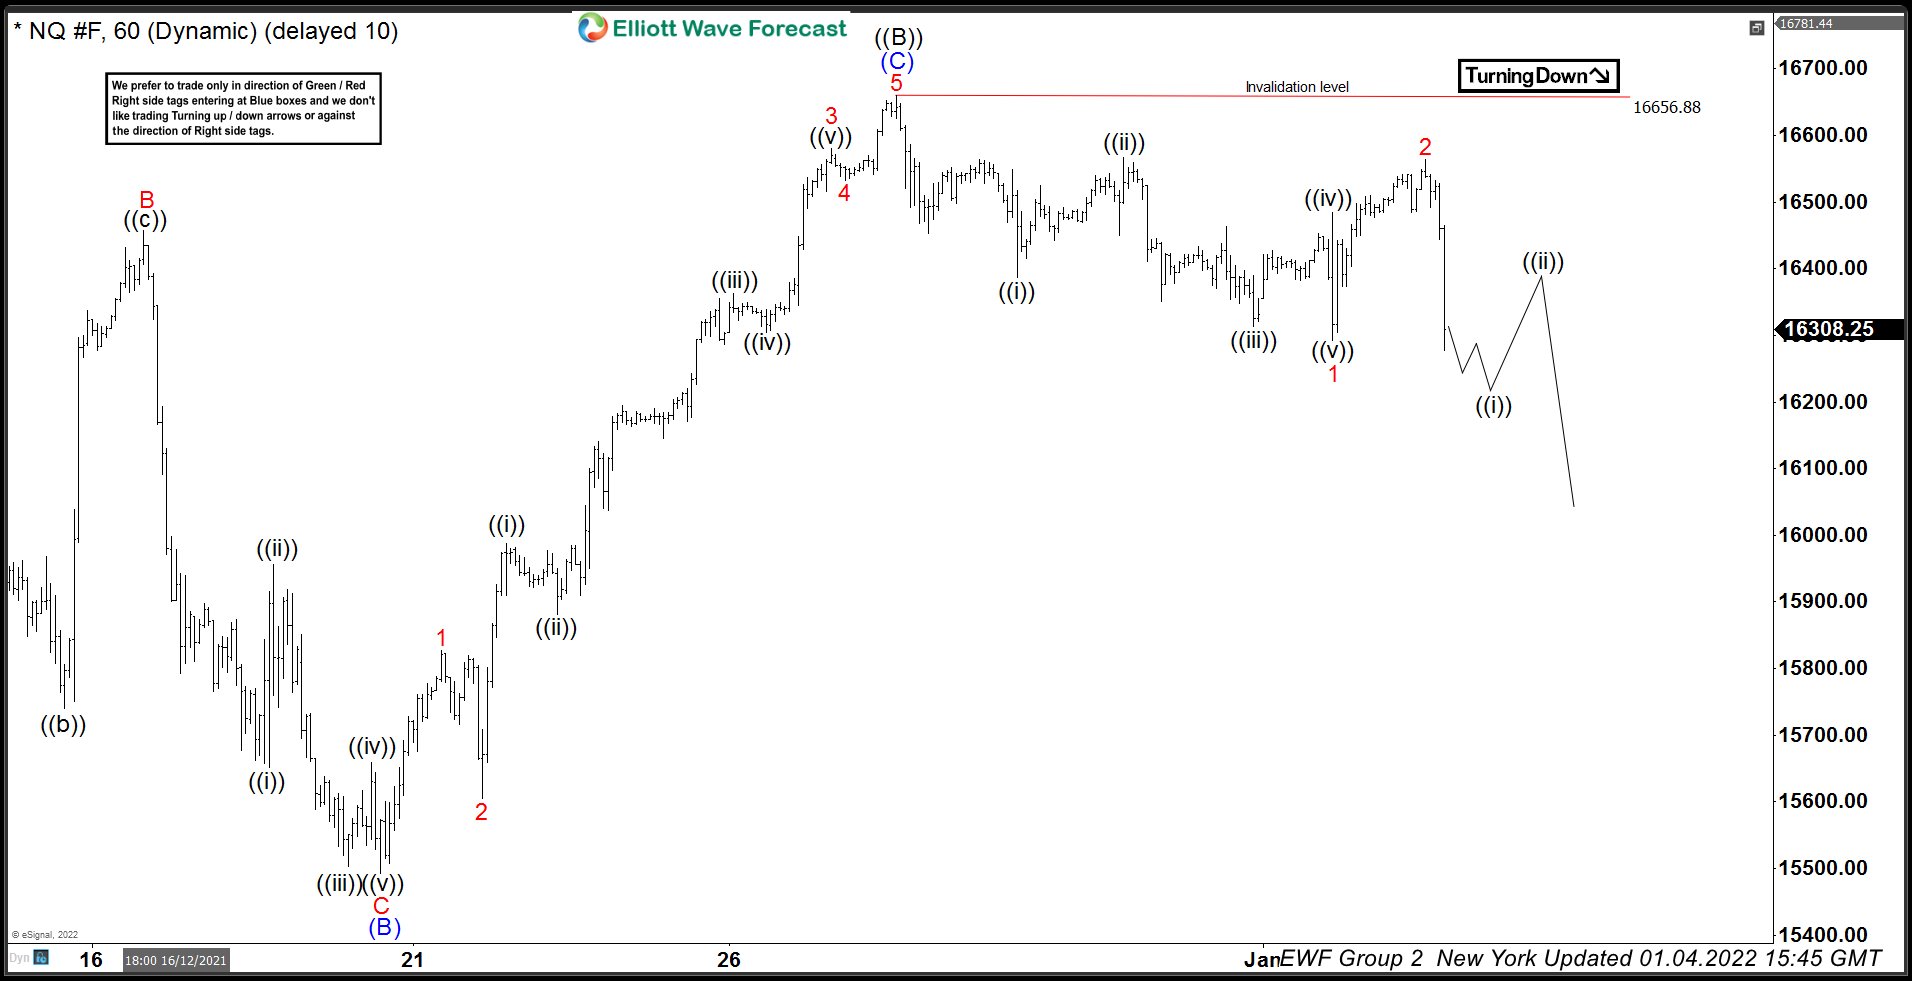
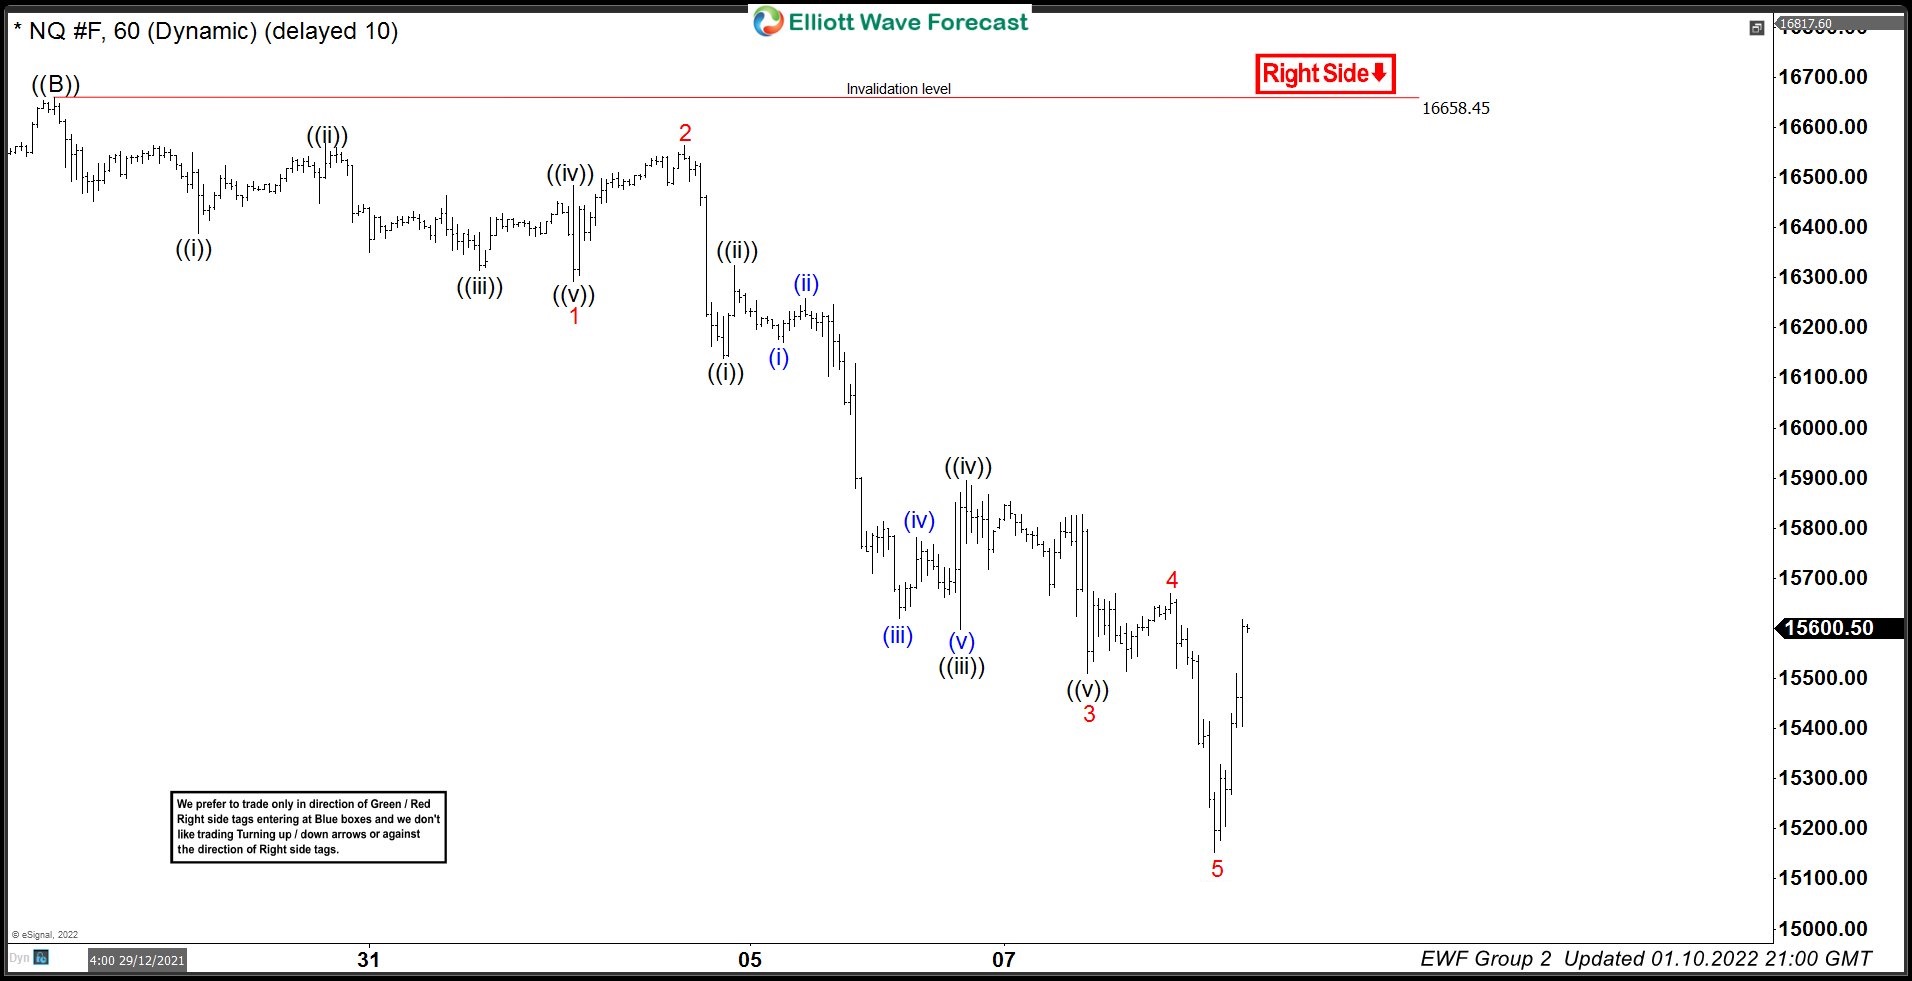
Nasdaq made a new all time high on 11.22.2021 (16767.50) and then went side ways. for the next few weeks. It formed a secondary peak on 12.28.2021 (16659.50) and turned lower again. We identified the structure of wave ((B)) to be an Elliott Wave FLAT and expected Index futures to resume the decline for a new low below 12.3.2021 (15538). Let’s take a look at Nasdaq futures chart from last week and how the price action unfolded since then.
Nasdaq Futures 3 January 1 Hour Elliott Wave Analysis
Nasdaq Futures 4 January 1 Hour Elliott Wave Analysis
Nasdaq Futures 10 January 1 Hour Elliott Wave Analysis
Back


