The point of this article is to help a trader get in position to profit from the expected market move thus the following is related to what to look for and how to trade it without fear or emotion.
The first thing that is needed to be known is which direction higher or lower the trend and Elliott Wave structure dictates where price likely will be going in the next larger market swing. We accomplish that here at ElliottWave-Forecast by using our proprietary trend following system which we do publish & up date daily and make available for members at the “Trend Report” page of the website. This system is what dictates the different market instrument structures and views beginning from the larger time frames on down with the weekly, daily, 4 and 1 hour timeframe charts and we also use the 15 minute trend to give the corrective targets in the 1 hour charts.
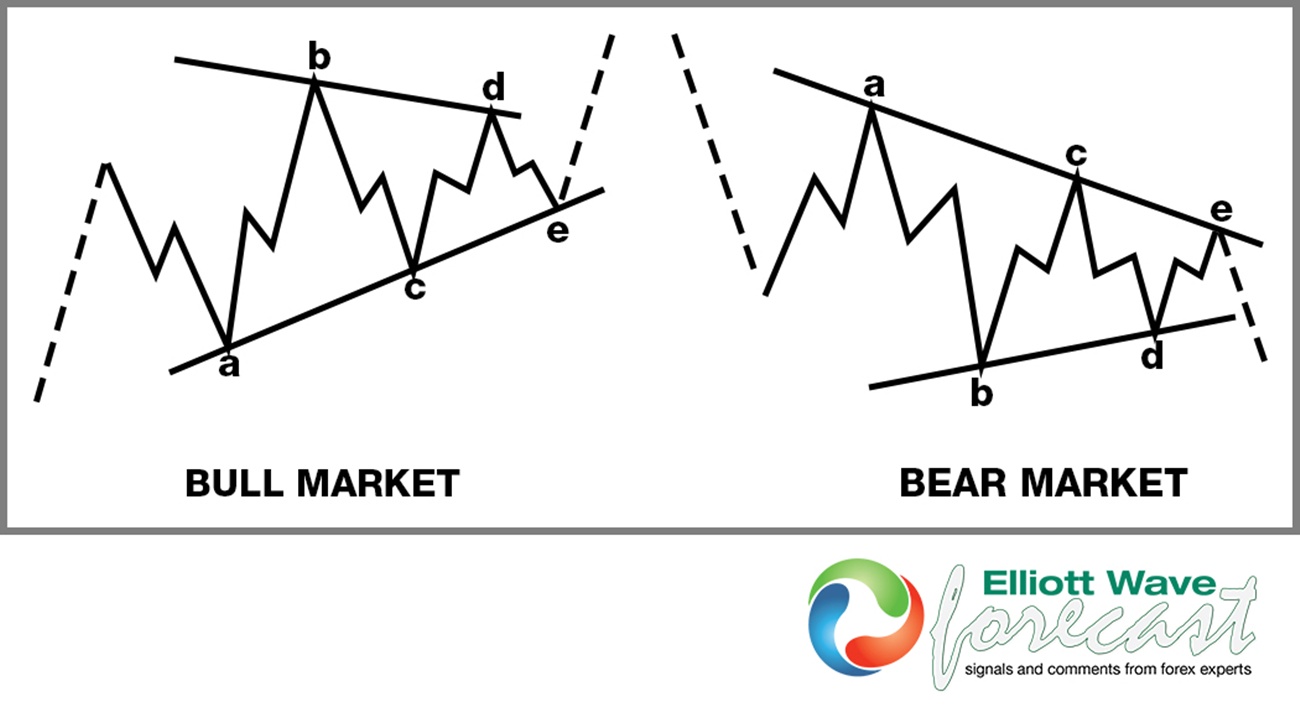
The structure of an Elliott Wave will give clues as to which Fibonacci extension levels along with the targeted Fibonacci retracement area before continuation of the cycle & trend higher or lower. Once the trend is known & a cycle has been identified as ended in a correction against the larger trend, the trader can wait for the Elliott Wave 1 or Elliott Wave A to end and look for the pullback to correct in 3, 7 or 11 swings with the exception in a wave B, a standalone triangle of course will be a sideways 5 swing correction with each swing subdividing as abc. Further worth noting a triangle that stands alone as a structure will not be seen in a wave 2 as it is only valid in wave 4 and B waves & X sometimes Y waves . If there is one present then it must be part of a larger double three WXY & always shows up in either the X or Y position.
Further worthy of note related to stand alone triangle B waves is many times the low or high of the “a” wave will be about 38.2% of the preceding trending wave A and will represent the high or low of the correction against the trend. In general with the exception of the stand alone B wave triangle a wave B or wave 2 will most likely reach the 50% to .618 Fibonacci retracement area in 3, 7 or 11 swings and will either be a Zig-Zag , Flat or combination double or triple three combination. Once determined when the first leg “a” of a correction against the trend has ended, after the “b” is suspected complete then a wave “c” projection can be made using your charting platform Fibonacci extension levels and the usual case of what will be seen is equal legs and 1.236% Fibonacci extension levels with the occasional 1.618% that is usually seen only in Flats or Impulse cycles. Once you have this “c” target area determined from the Fibonacci extension levels, if you see that is not in or very near the 50-.618% Fibonacci retracement area of the preceding wave 1 or wave A , then the “a” “b” “c” move will likely become a little larger degree (a) or (w) and is likely going to bounce a little in a (b) or (x) and then continue on into (c) or (y) in a 7 swing correction thereby allowing the wave 2 or B reaching the .50 to .618 Fibonacci retracement inflection zone where you are looking to gain entry.
Once the entry level area is reached, take position and put a stop above or below the .854 Fibonacci retracement level of the correction against the trend your buying or selling , over previous high or under a previous low is better but usually if the .854 Fibonacci retracement level is seen the trade will be wrong or the shorter term trend will change again. The thought applies to another method of putting the stop past the 1.618% Fibonacci extension level of the equal legs , 1.236% Fibonacci extension area that was bought or sold in the correction against the trend. If the 1.618% extension is surpassed it can be likely that the trend has changed and the view had lost validity. As for target areas to exit a position it is best all of a position would be exited @ the equal legs to 1.236% area , (sometimes 1.618% if an impulse is expected) Fibonacci extension area of the wave 1 or wave A measured against the high or low of the larger degree correction wave 2 or wave B being bought or sold. This plan & method always gives a better than 2 to 1 risk to reward ratio and executed properly is very profitable as well as having limited risk with the money management technique.
Again remember the wave 2 will not have a stand alone triangle nor go below the wave 1 low. Feel free to refer to the illustrations below of what may be seen in a wave 2 or wave B pullback. I hope this has been of help as to how to trade it. Thanks for looking and feel free to come visit our website and take a trial subscription and see if we can be of help.
Kind regards & good luck trading.
Lewis Jones of the ElliottWave-Forecast.com Team
Back


