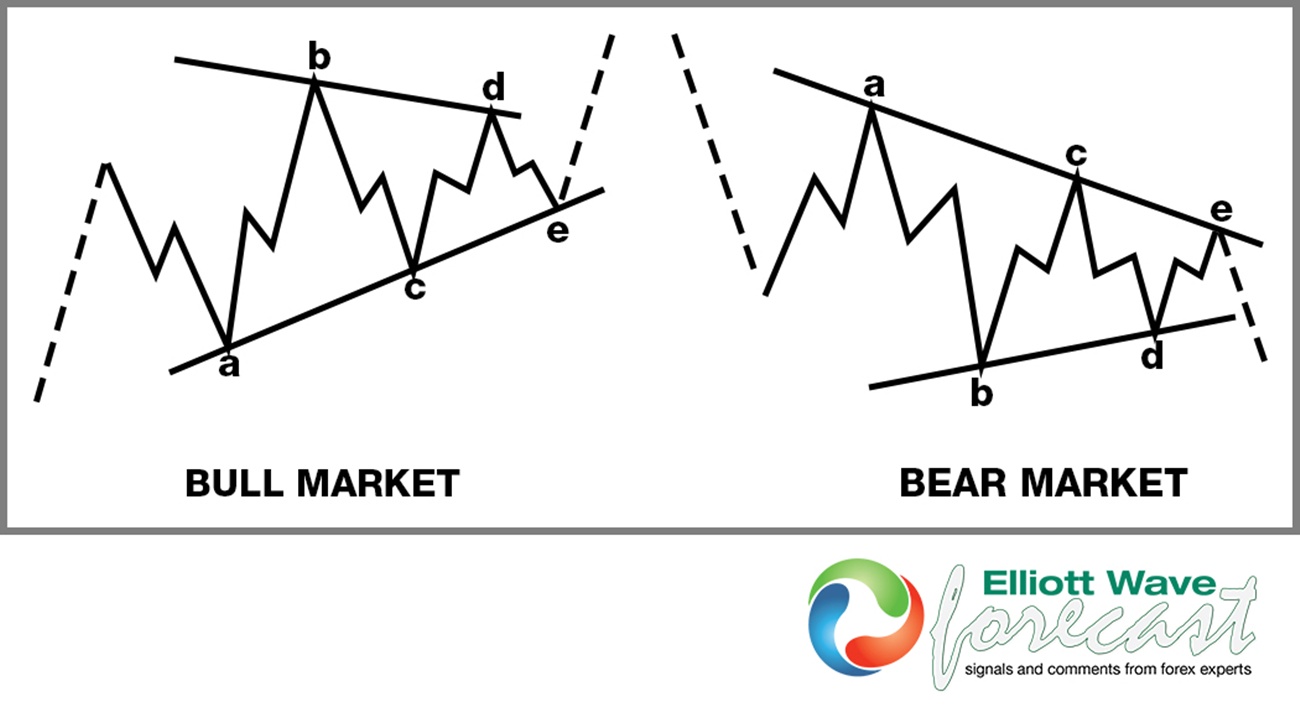
Triangles are overlapping five wave affairs that subdivide 3-3-3-3-3. They appear to reflect a balance of forces, causing a sideways movement that is usually associated with decreasing volume and volatility. Triangles fall into four main categories i.e. ascending, descending, contracting, expanding. It is quite common, particularly in contracting triangles, for wave b to exceed the start of wave a in what may be termed a running triangle.
Triangles, by far, most commonly occur as fourth waves. One can sometimes see a triangle as the Wave B or X of a three-wave correction. Triangles are very tricky and confusing. One must study the pattern very carefully prior to taking action. Prices tend to shoot out of the triangle formation in a swift thrust. When triangles occur in the fourth wave, the market thrusts out of the triangle in the same direction as Wave 3. When triangles occur in Wave B or X, the market thrusts out of the triangle in the same direction as the Wave A/W.
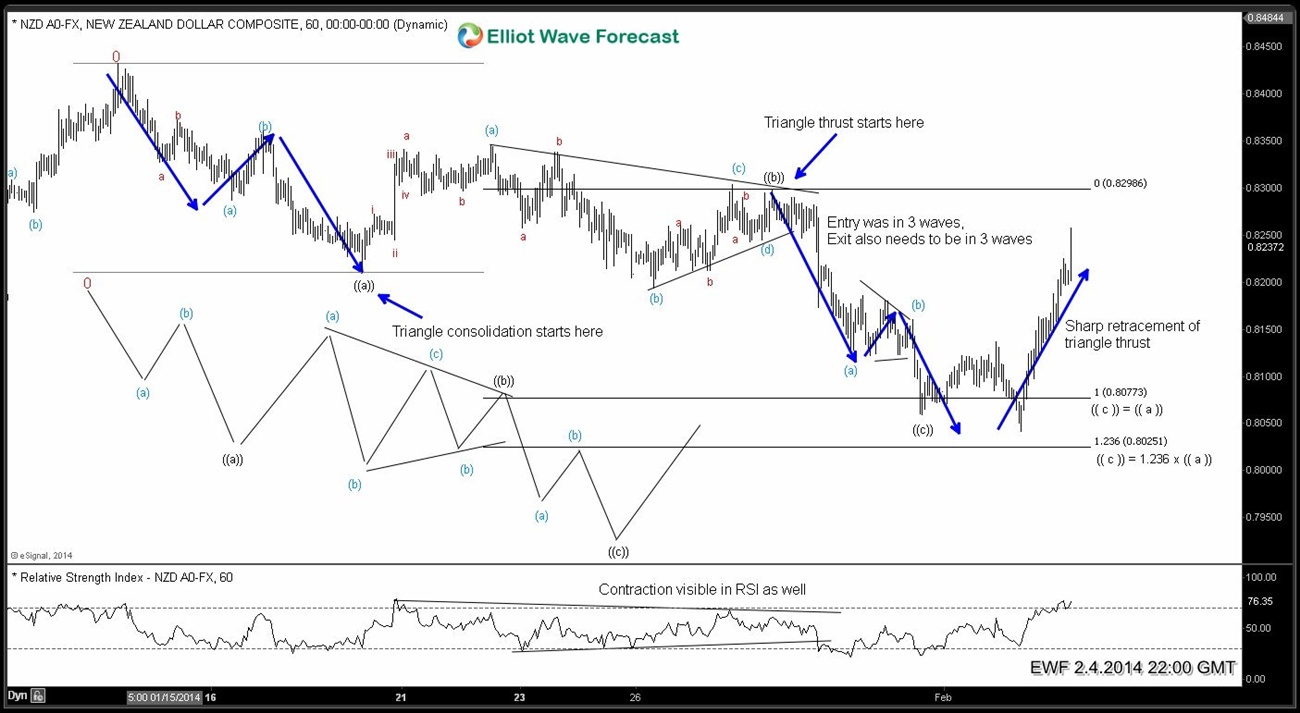
Many wavers ignore the importance of decreasing momentum in a triangle formation. We at EWF use RSI to filter out other types of sideways consolidations. We like to see contracting formation in RSI as well when looking at a triangle formation.
Today, we are going to look at what a bearish running triangle looks like in the real market
If you want to learn more about the techniques we use for analysis at EWF, check out the Educational Seminar recordings here or Sign up for 14 day Trial
Good Trading!
Back

