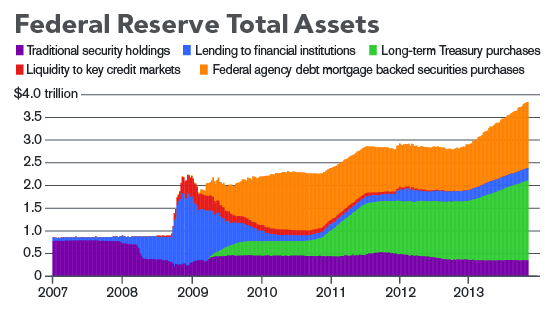
Quantitative easing mainly known as “QE program” was the biggest emergency economic stimulus in the history. The U.S. Federal Reserve’s once-in-a-lifetime program to buy immense piles of bonds, month after month, in an extraordinary effort to restart a recession-deadened economy came to an end in October 2014 after adding more than $3.5 trillion to the Fed’s balance sheet, an amount roughly equal to the size of the German economy. The bond-buying program, called quantitative easing or QE, had been controversial since its start in 2009, as had the Fed’s decision in 2013 to gradually reduce the monthly economic boost, a plan that became known as the taper. Whether the Fed tapered too soon, given global economic weakness, or too late, given signs of bubbles in some markets, was hotly debated. But even after the taper’s end the Fed continued to pump support into the economy the old-fashioned way, by holding its interest rates near zero for about up till by the end of 2015. Below is the Federal Reserve Total Assets Chart:
In the months after the crisis, the Fed bought $1.75 trillion in bonds. In 2010, with the recovery flagging, it bought $600 billion more in what was called “QE2”. In September 2012, with joblessness stubbornly high, the bank began snapping up $85 billion a month in Treasuries and mortgage-backed securities “QE3”. Unlike earlier rounds, the Fed’s purchase plan was described as open-ended, with officials saying it would continue until the labor market “improved substantially.” The idea was that reducing the bond purchases gradually that is, tapering them off would make clear that the central bank would continue to offer support for the economy, just at lower levels. While many of traders believes that Federal Reserve Bond-buying program caused the SPX to rally from 2009, however we at Elliottwave-Forecast.Com see that rally differently as we believe Technicals runs ahead of the Fundamentals.
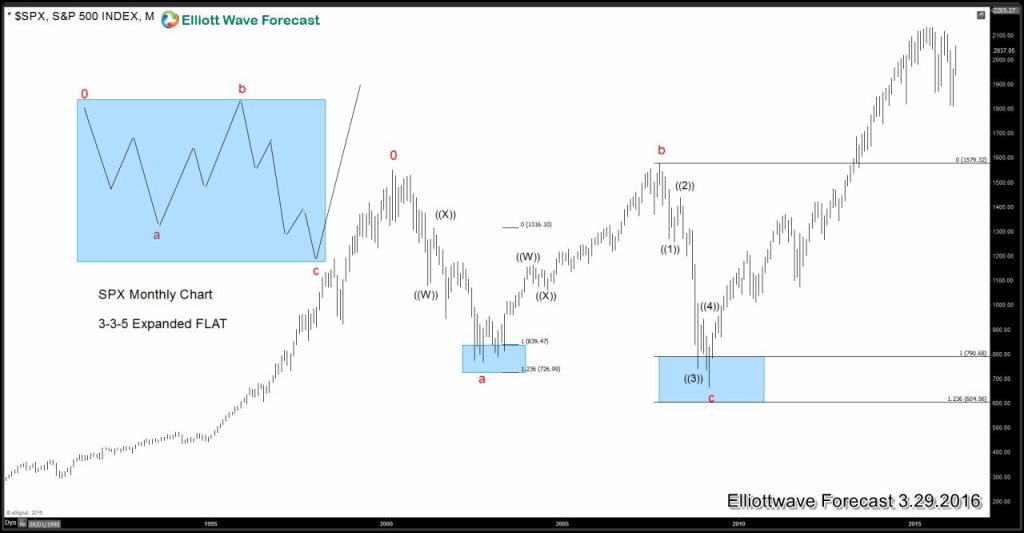
Below is the SPX monthly chart, in which we identify a 5 wave decline from 2007 peak to the low seen in 2009. Elliott Wave Theory states after completion of a 5 wave structure, at least a 3 wave reaction should happen in the opposite direction. This means after reaching a low in March 2009, regardless of the QE, market was due a bounce in 3 waves at least ideally toward the the 50 – 61.8 Fibonacci retracement area of the 5 wave decline (1120 – 1127). This was our initial expectation which was met in May 2011 (1370.58) as Index reached 61.8 Fibonacci retracement of the decline from 2007 peak. Followed by a drop to 1074 in October 2011, market started rallying again and made new highs above May 2011 peak (1370.578) which put the next logical extension target above 2007 peak suggesting 5 wave decline was not first leg of the correction but part of an expanded FLAT correction which started in the year 2000. Chart below shows the sub-divisions of the expanded FLAT structure.
Elliott wave Flat patterns are one of the common structures now a days, in today’s blog we will identify Elliott wave Expanded Flat structure in SPX monthly chart that unfolded from 2000 peak to 2009 lows, which almost lasted 9 years into the correction. Elliott wave Expanded Flat structure is a 3 wave pattern which inner subdivision consist of ( 3 – 3 – 5 ) sequence structure, which mainly labelled as A, B, C , Where wave A and B can be any form of corrective structure for example double three, Zigzag , Triple three etc. While wave C is always a 5 wave structure, which could be either motive impulse or ending diagonal pattern. Also it is important to note that wave B, will always complete above wave A starting point peak and wave C always ends below the starting point of wave A, where potential target area of wave C comes at 161.8% extension area of wave A and B but usually it also ends in between 100%-123.6% extension area as well.
Monthly Chart of $SPX (posted above) shows wave “a” and “b” to have unfolded as double three structure i.e. ((W))-((X))-((Y)) and wave c as a 5 wave impulse. Important to note that wave “b” bounce took the previous wave “a” starting point and wave “c” lower took the wave “a” low before completing the structure and starting the bounce. There are 3 Different types of Flat structures which exist in the market, which can be identified by knowing the difference in their overall shapes and structures, Flat can be occur in any degree of cycle either bullish or bearish trend.
Back


