For the last few months Canadian Dollar is one the weakest currencies in the market. It has been constantly showing the weakness against the all other currencies and our cycle analysis were suggesting the same – furhter collapse of Canadian Dollar. At the same time Indexes were doing pull backs in weekly charts, and we were aware that by the fact $Nikkei and other Indexes need more downsides, Japanese Yen is going to be suported (as the currency is inverse correlated to the Indexes). Consequently, strong Yen currency means more downside in all JPY pairs, so selling $CADJPY looked like a very good trade.
Besides selling the dips in $CADJPY we were making profits from its weakness by selling $CAD even against $USDX and $EUR.
In this blog we’re going to take a quick look at $CADJPY Elliott Wave charts from the begining of December, to see how we were guiding our members through the price structure.
From the 12/03 2015 date the price has made approximately 1300 points decline.
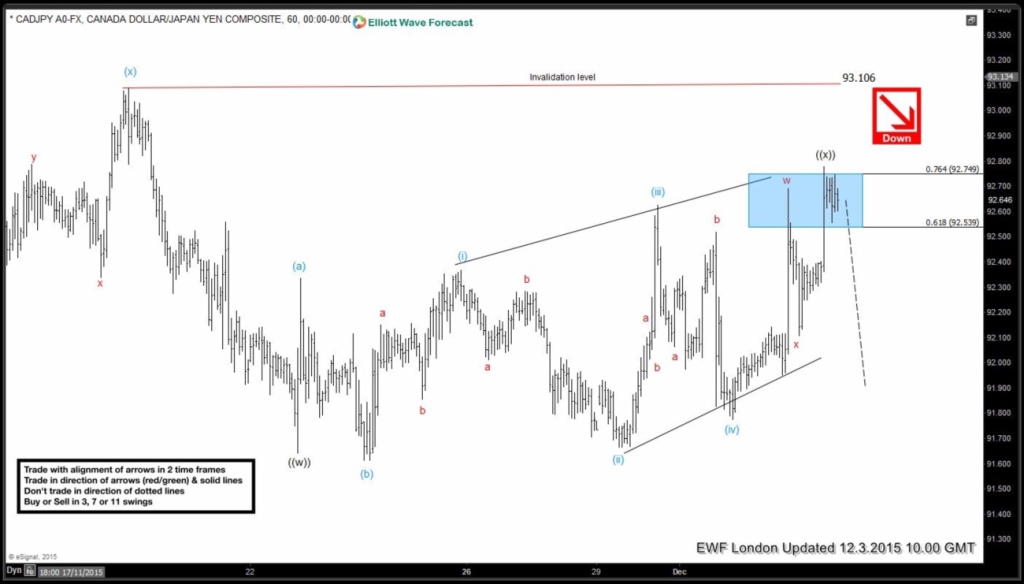
$CADJPY 12.03.2015 London Update The best reading of the cycles suggests that pair ended wave ((x)) recovery as Expanded Flat Structure at 92.77 high. While below that high and more importantly while below 93.16 high, the pair is expected to decline toward new lows during wave ((y)).
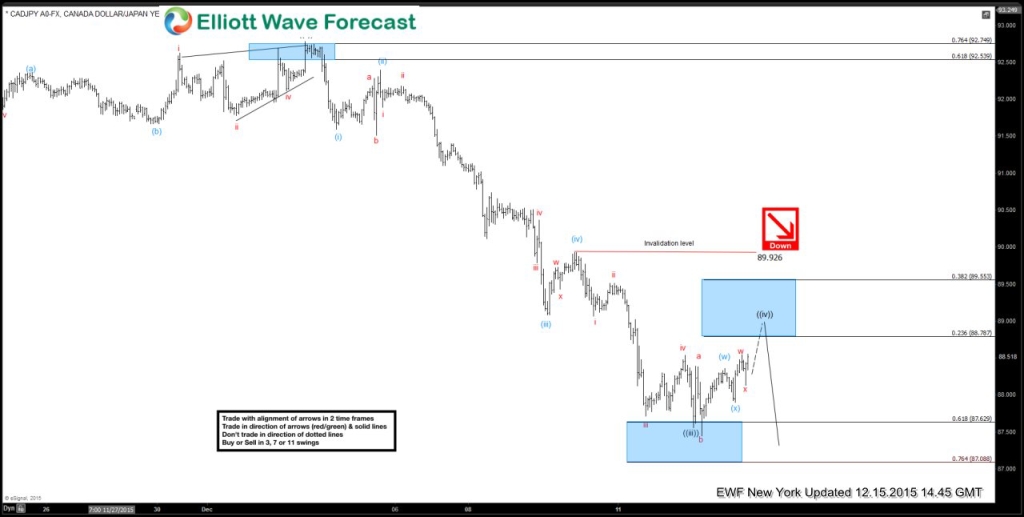
$CADJPY 12.15.2015 NY Update The pair gave us nice decline from marked area. We got approximately 500 pips decline and currently wave ((iv)) recovery is in progress toward 23.6-38.2 fibonacci retracment area that comes at 88.787-89.553. There CADJPY should ideally complete wave ((iv)) before decline makes new lows.
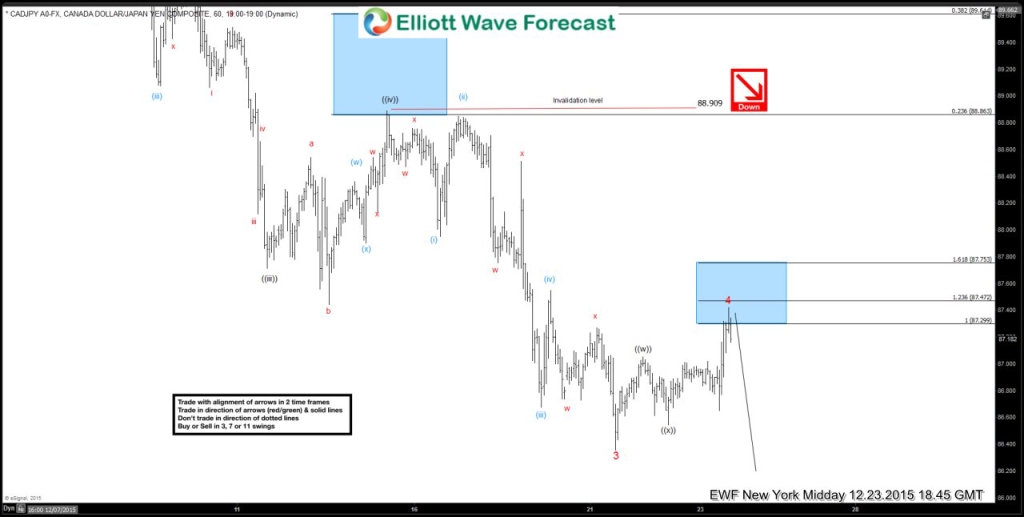
$CADJPY 12.23.2015 NY MiddayUpdate It has given us nice decline from the 0.236 fib zone and now the pair is showing 3 waves from the lows, correcting the cycle from the 88.909 high, another good opportunity to short the pair again at 87.29-87.47 area.
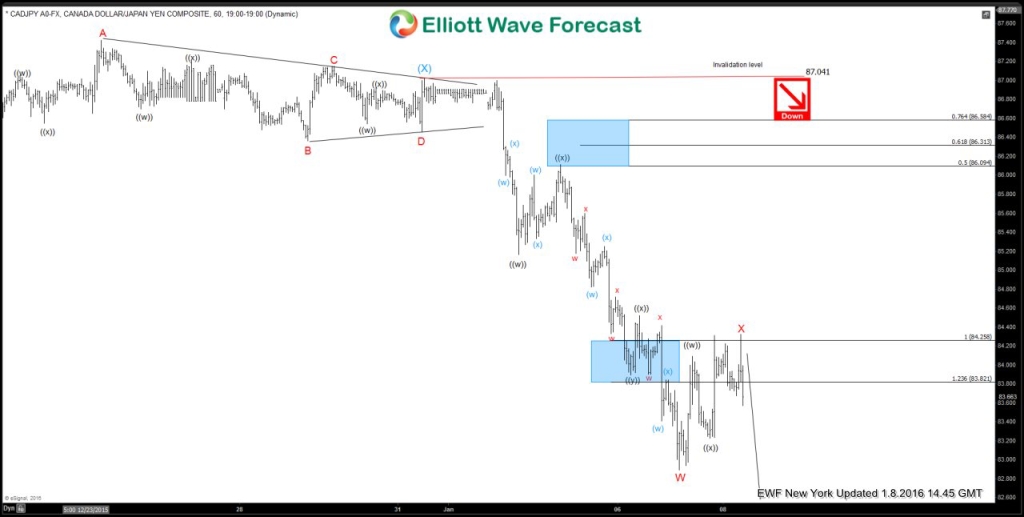
$CADJPY 1.8.2016 NY Update The pair has resumed sideways to lower from 87.29-87.47 area as expected. It gave us triangle consolidation and further drop from 87.041 high after the Triangle has ended. Current view suggests the pair has corrected the cycle from the 87.04 high and X red bounce has ended at 84.305 . The view resumes to be bearish and further decline toward new lows is expected.
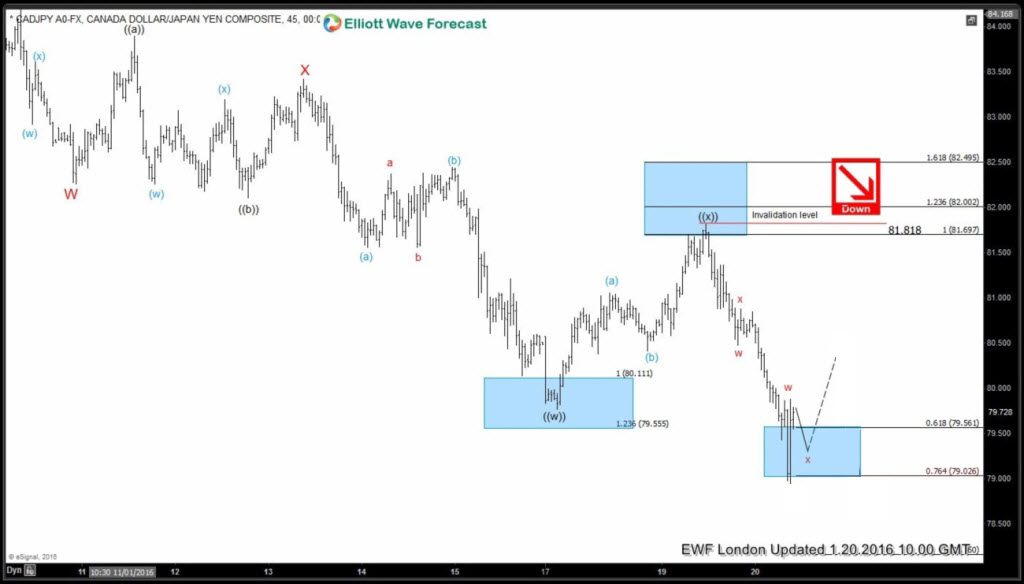
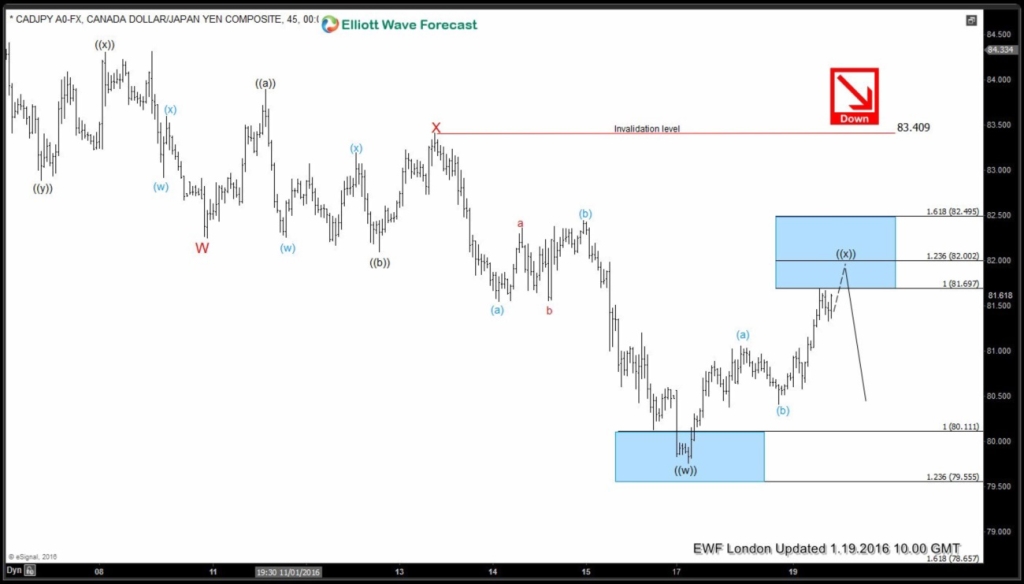
$CADJPY 1.19.2016 NY Midday Update The price made decline, reached important technical area 80.11- 79.55 and bouncing from there in wave ((x)) bounce, correcting the cycle from the 83.409 high. As the chart is showing, the price is approaching important technical area at 81.697-82.002 , another opportunity to sell the pair.
 $CADJPY 1.20.2016 London Update The pair turned lower from the marked area above and now it is expected to make a bounce from 79.56-79.02 area against the 81.81 high. Further path could be found in membership area of EWF.
If you want to see the current wave count and learn more about next trading opportunities in the pair, try us free for 14 days.
In Free Trial you get access to Professional Elliott Wave analysis of 50 instruments in 4 different time frames, Daily Elliott Wave Setups Video, 2 live Analysis Session done by our expert analysts every day, live trading room, 24 hour chat room support, market overview, daily and weekly technical videos and much more…
If you have any question, contact me through e-mail vlada@elliottwave-forecast.com or in twitter.
Welcome to Elliott Wave Forecast !
Back
