Hello fellow traders, in this technical blog we’re going to explain what Elliott Wave Zig Zag pattern looks like on real market example CADJPY price structure. Before we take a look at the $CADJPY chart, lets get through some basic EW theory and explain Zig Zag in a few words.
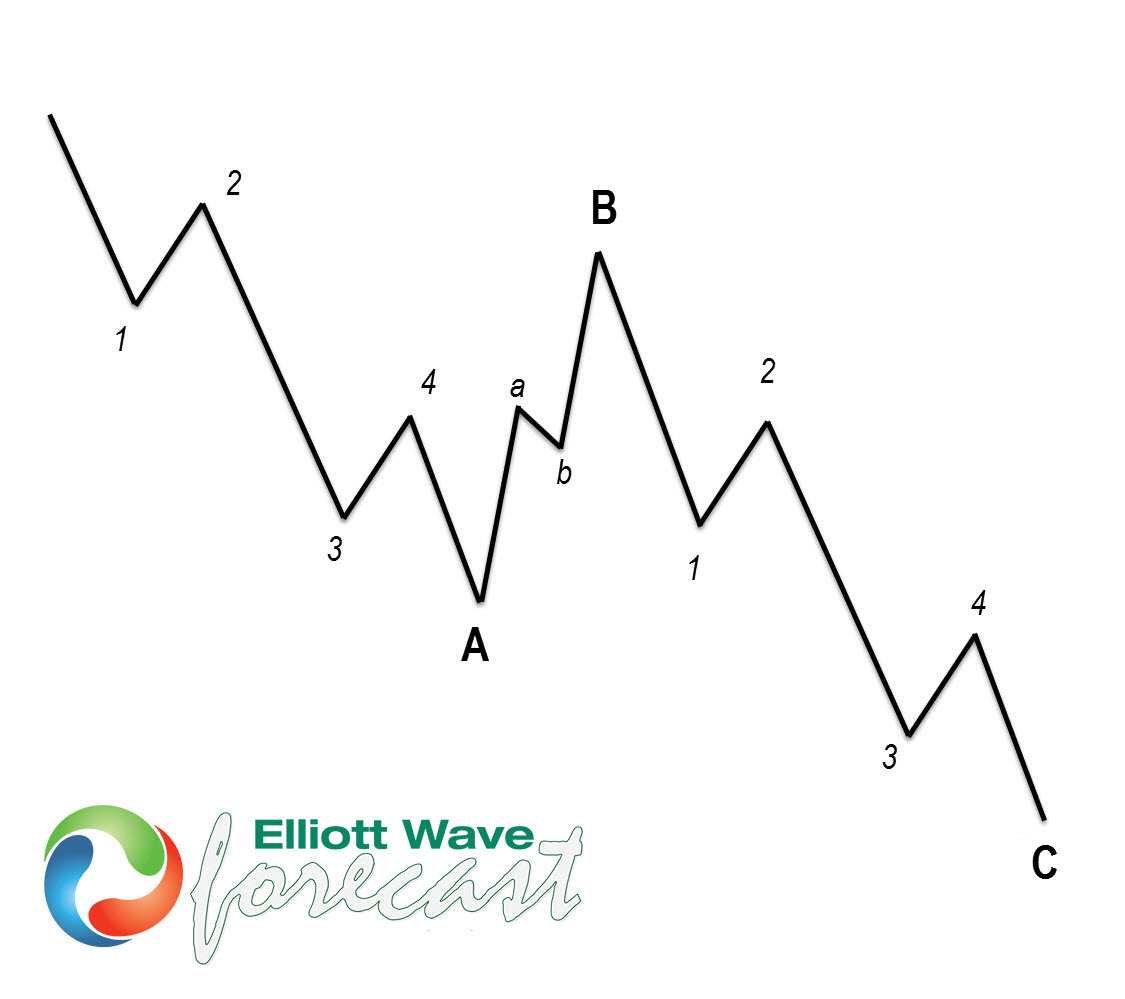
Zig zag is the most popular corrective pattern in Elliott Wave theory . It’s made of 3 swings which have 5-3-5 inner structure. Inner swings are labeled as A,B,C where A =5 waves, B=3 waves and C=5 waves. That means A and C can be either impulsive waves or diagonals (Leading Diagonal in case of wave A or Ending in case of wave C) . Waves A and C must meet all conditions of being 5 wave structure, such as: having RSI divergency between wave subdivisions, ideal Fibonacci extensions, ideal retracements and so on…
At the graphic below, we can see what Elliott Wave Zig Zag structure looks like. 5 waves down in A, 3 wave bounce in B and another 5 waves down in C.
Before we take a look at the price structure of $CADJPY, here is a short reminder to check out New Educational blogs and Free Elliott Wave analysis .
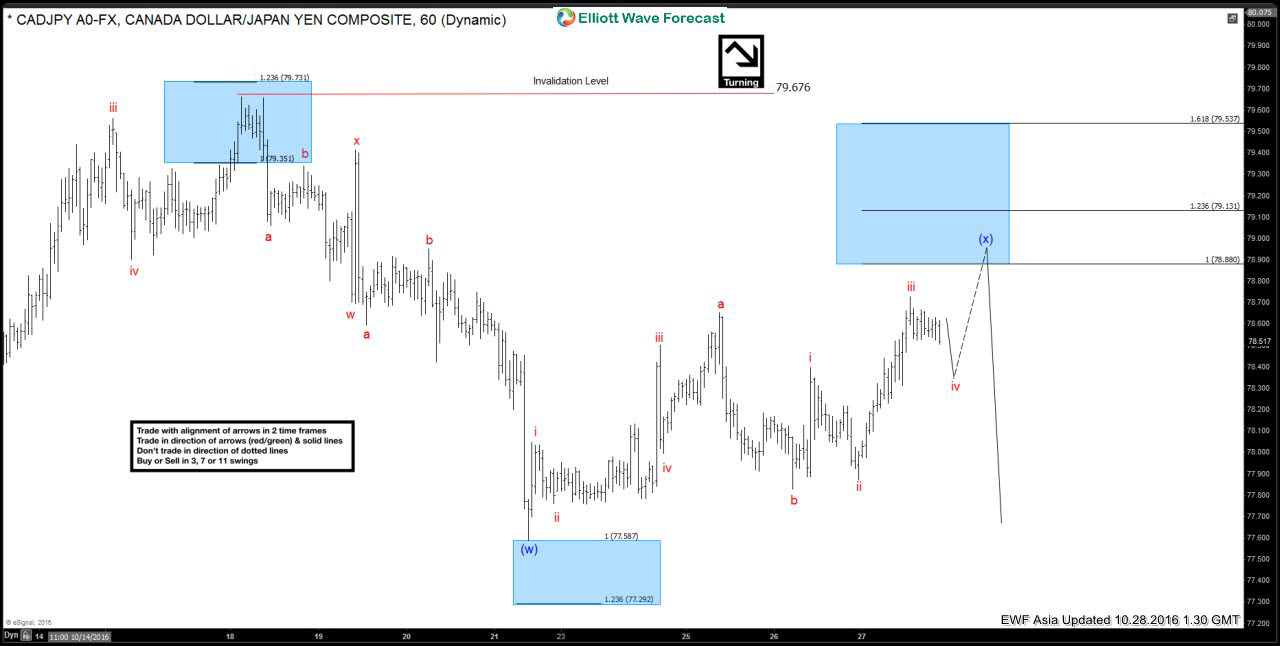
$CADJPY H1 Asia update 10/28 2016 The pair is doing wave (x) blue recovery, correction against the 79.67 peak , which is unfolding as Elliott Wave Zig-Zag pattern. It’s showing clear 5 waves in the first leg a red, and due to a fact c red has only 3 waves so far, we’re calling for another short term swing up toward c=a area at 78.88-79.13 to complete c red as 5 waves and whole (x) blue correction as zigzag. Once (x) correction completes, we expect further decline in wave (y) blue toward new lows below 10/21 low.
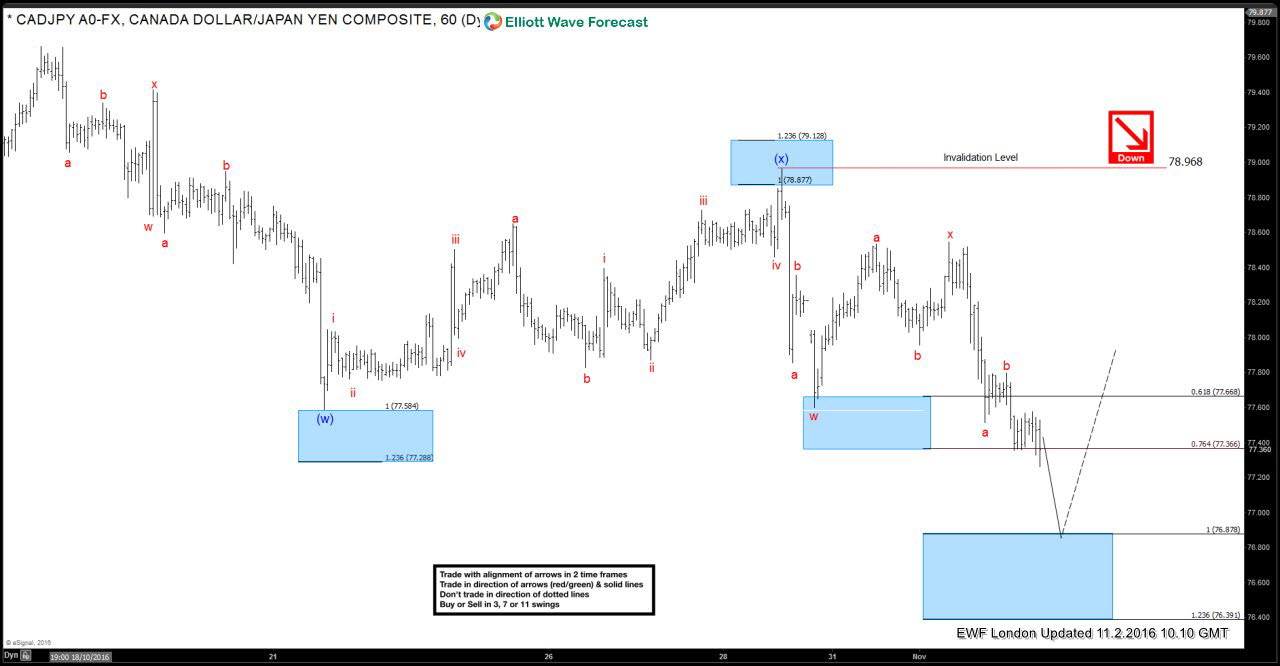
$CADJPY H1 Asia Update 11/02 The pair made short term push up in wave v of c red, reached proposed technical zone at 78.88-79.13 and completed blue (x) recovery at 78.968 peak as 5-3-5 structure. We got the nice decline , new lows have been made and now the pair is targeting 76.87-76.40 area.
Note: some labels have been removed from the chart in order to protect clients’ privileges. If you’re interested in the future path of $CADJPY or in any of the other 50+ instruments we cover, you can find Elliott Wave analysis in the membership area. ( If not a member yet, all you have to do is to Sign Up for 14 Days Trial )
Proper Elliott Wave counting is crucial in order to be a successful trader. If you want to learn more on how to implement Elliott Wave Theory in your trading, fell free to join us. You will get access to Professional Elliott Wave analysis in 4 different time frames, 2 Live Analysis Sessions and Live Trading Room by our expert analysts every day, 24 hour chat room support, market overview, daily and weekly technical videos and much more…
If you are not member yet or Elliott Wave Subscribers, just sign up now to get your 14 days Premium Plus Trial.
Welcome to Elliott Wave Forecast !
Back


