One of the most common patterns in New Elliott Wave theory is 7 swings structure (double three). We spot it in the market every day in many instruments. It’s a very reliable structure by which we can make good analysis and what is most important it’s giving us good trading entries with clearly defined invalidation levels and target areas.
Last few weeks we were guiding our members through the 7 swings pattern in GBPCHF , forecasting paths of swings 4,5,6 and 7
Let’s take a look at the GBPCHF charts:
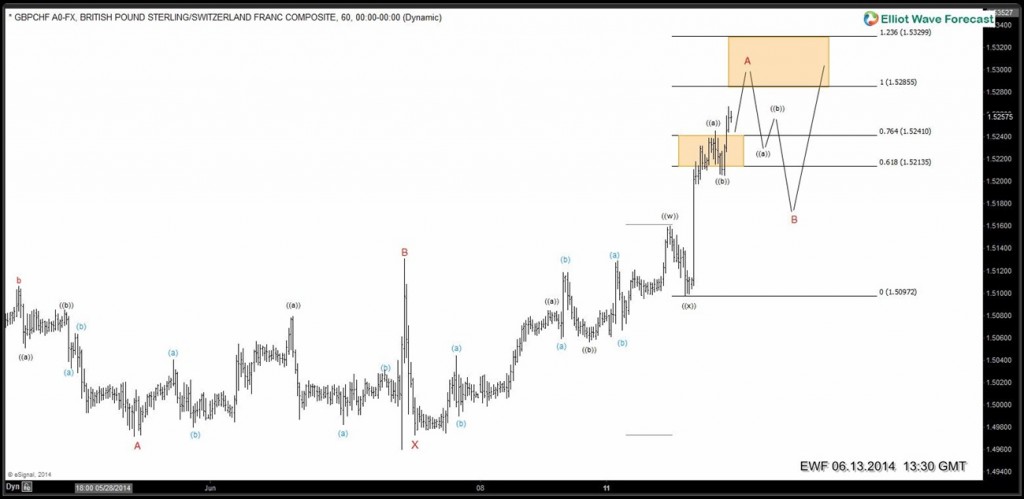
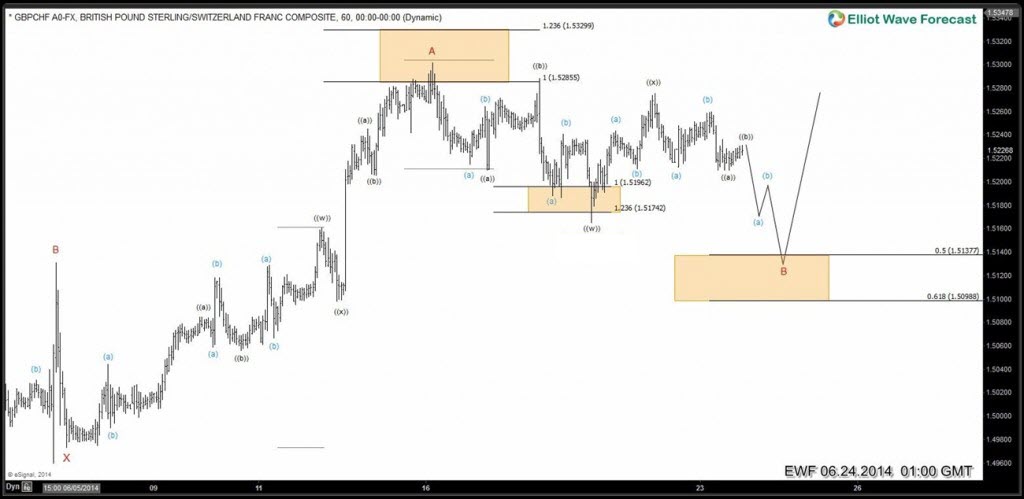
June 12/2014 (Asia Update) We were calling for another leg higher toward 1.52855-1.53299 area to complete wave A (as 3 swings structure), and from there we expected pull back ( 4th swing )
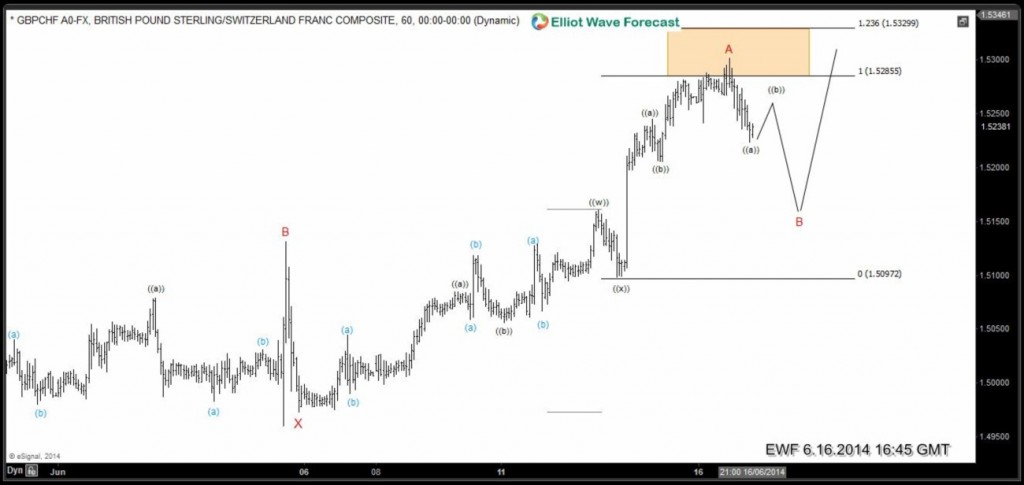
June 16/20144 (Mid day update) The price has reached proposed area and bounce lower from there as expected.
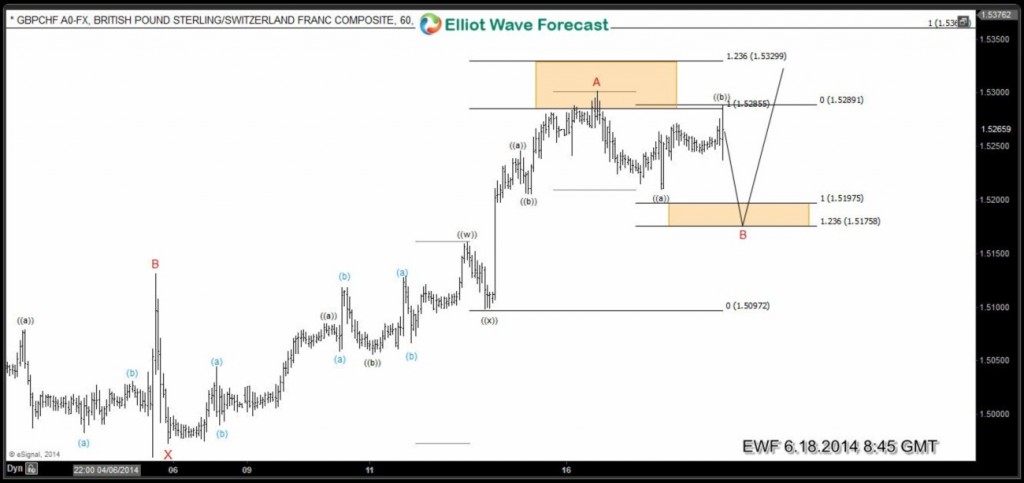
June 18/2014 (London Update ) We were calling for another leg lower toward 1.51975 -1.51758 area, from where the rally was expected.
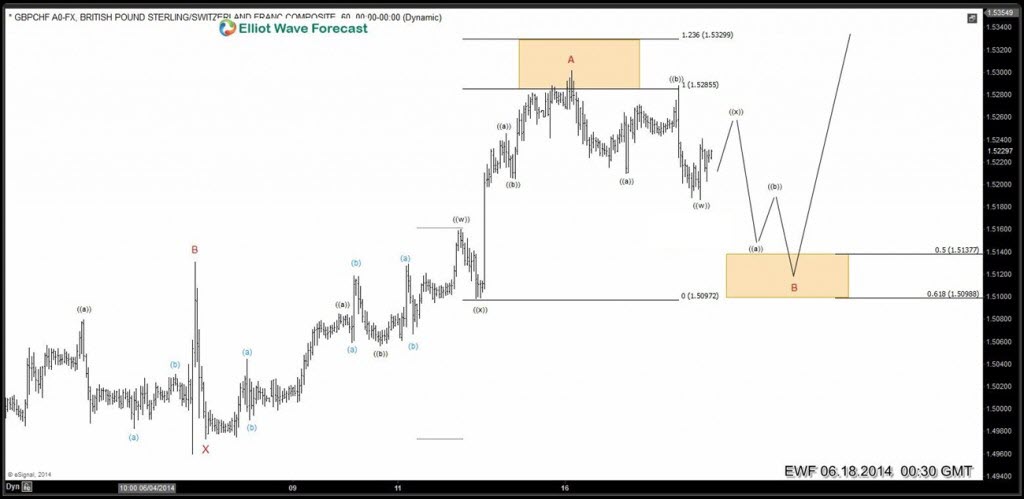
June 18/2014 (Asia Update ) GBPCHF reached proposed area and bounce higher from there, but because of market corelation and the price structure, the count had been adjusted to the new market conditions calling for more downside toward 50-61.8 fibonacci area 1.51377-1.50988 after ((x)) connector is done.
June 24/2014 (Asia Update) ((x)) had completed and we still expected 50-61.8 fibonacci area
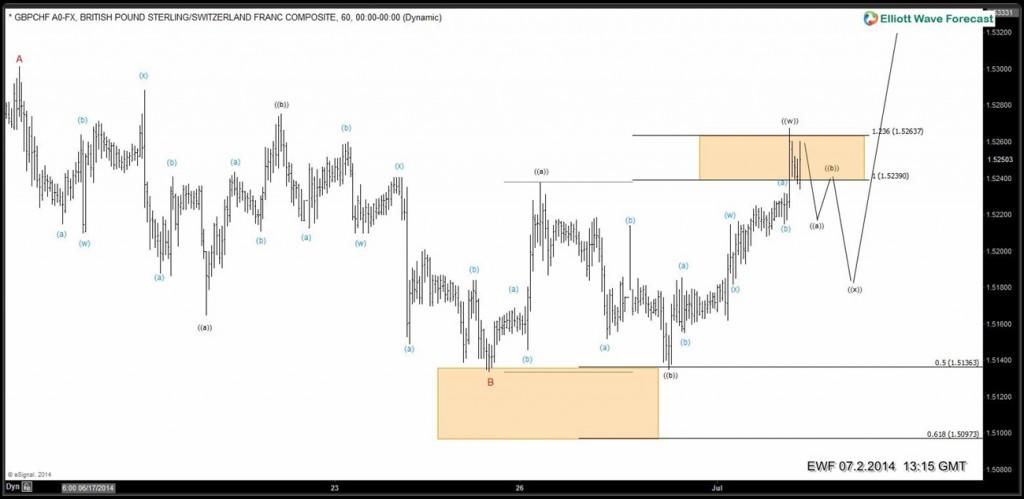
July 2/2014 (NY Update) GBPCHF had given us rally , retested 50 fib area and bounced higher again as expected, pull back in ((x)) were expected before further rally
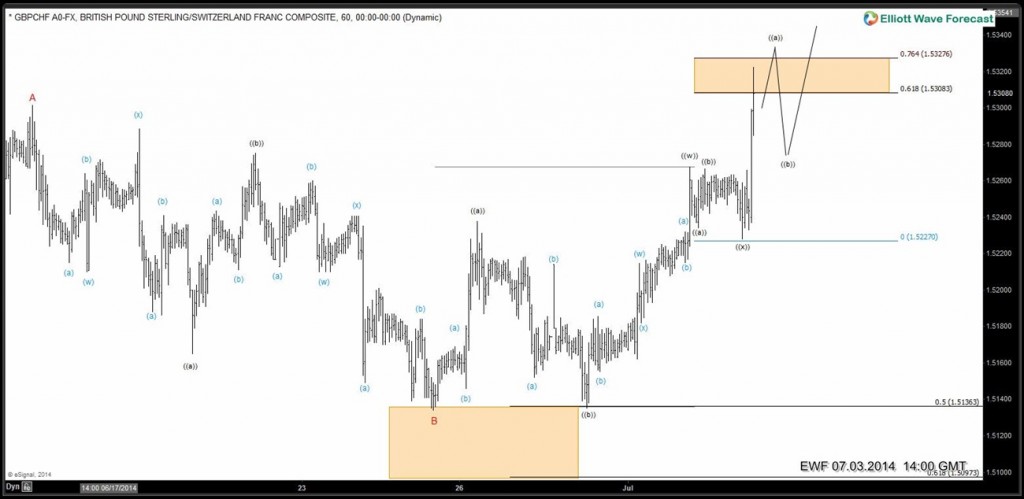
July 3/2014 (NY Update) We got shallow pull back ((x)) and rally took place… pull back was expected.
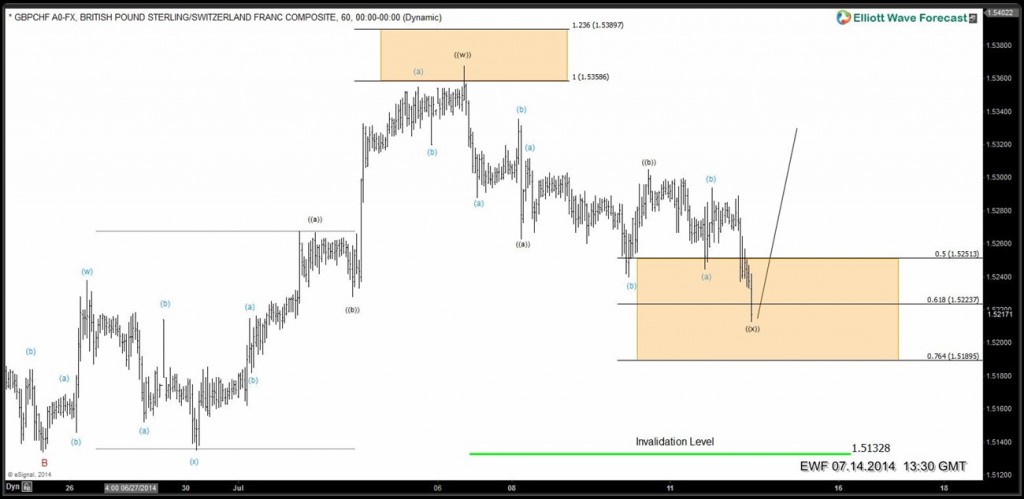
July 9/2014 (Mid Day Update) pull back were in progress, but because the price had reached important technical area, obviously 5th swing was done at 1.5365 and we were approaching technical area to complete 6th swing – wave ((x)) … another push lower was expected.
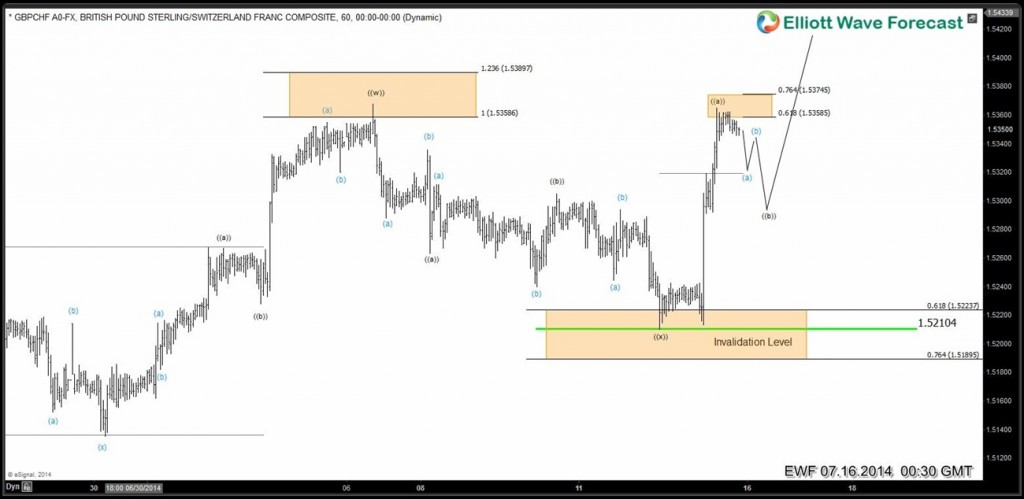
July 14/ 2014 (NY Update) the price gave us push lower as expected, slightly exceeded 61.8 fib area… we had been assuming that ((x)) were done at 1.52104 … further rally was expected in 7th swing
July 16/2014 (NY Update) We got rally in 7th swing from 1.5210 low toward 1.5401, the price had entered important technical area to complete first leg of 7th swing and we were calling for pull back before another extension higher.
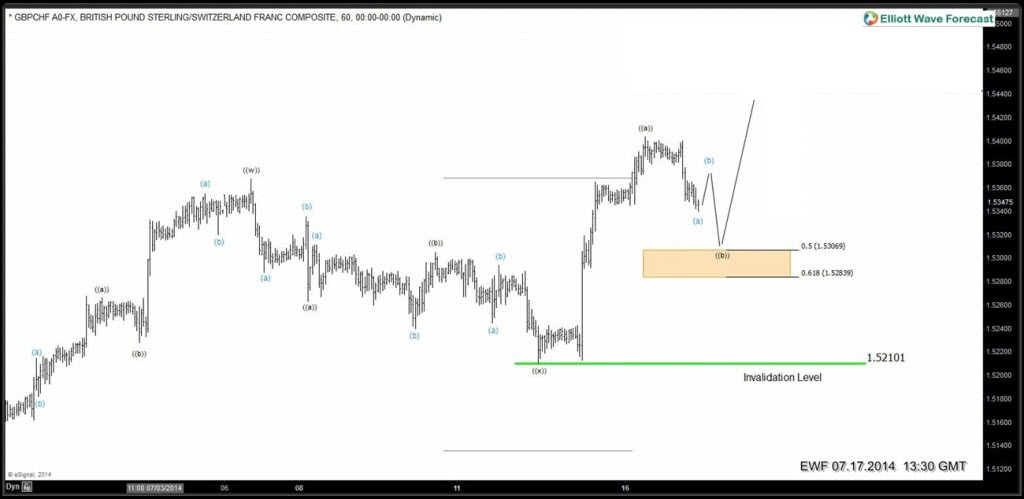
July 17/2014 (NY Update) Pull back was in progress toward 50-61.8 fibonacci area (potential reversal zone)
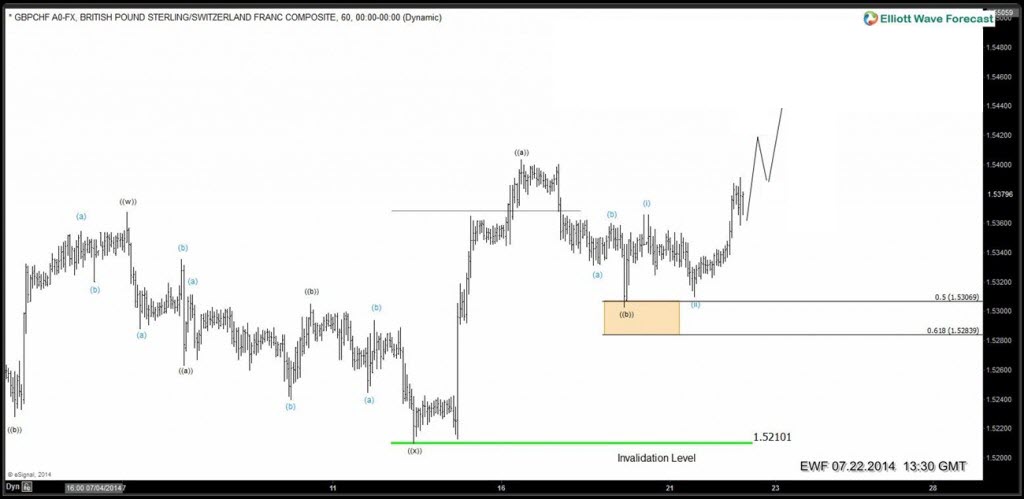
July 22/2014 (NY Update) Pull back had completed at proposed area and we were doing another extension higher as expected …
If you would like to have access of EWF analysis in real time and become a Successuful Trader & master Elliott Wave like a Pro ,we invite you to join us and learn from our Market Experts. Now you have an opportunity to sign up for Free Trial here and get acces of Premium Plus Plan in 2 weeks for Free. We provide Elliott Wave charts in 4 different time frames, 2 live webinars by our expert analysts every day, 24 hour chat room, market overview,daily and weekly technical videos and much more.
If you are interested to learn more about trading in 7 swing structure ,we advise you to attend every day EWF Live Analysis Sessions (or watch recording later) , you will learn a lot from our Market Experts. Also, as our member you have an opportunity to purchase great Instructional EWF video “Elliott Wave structure & Sequences” at very affordable price.
Back
