
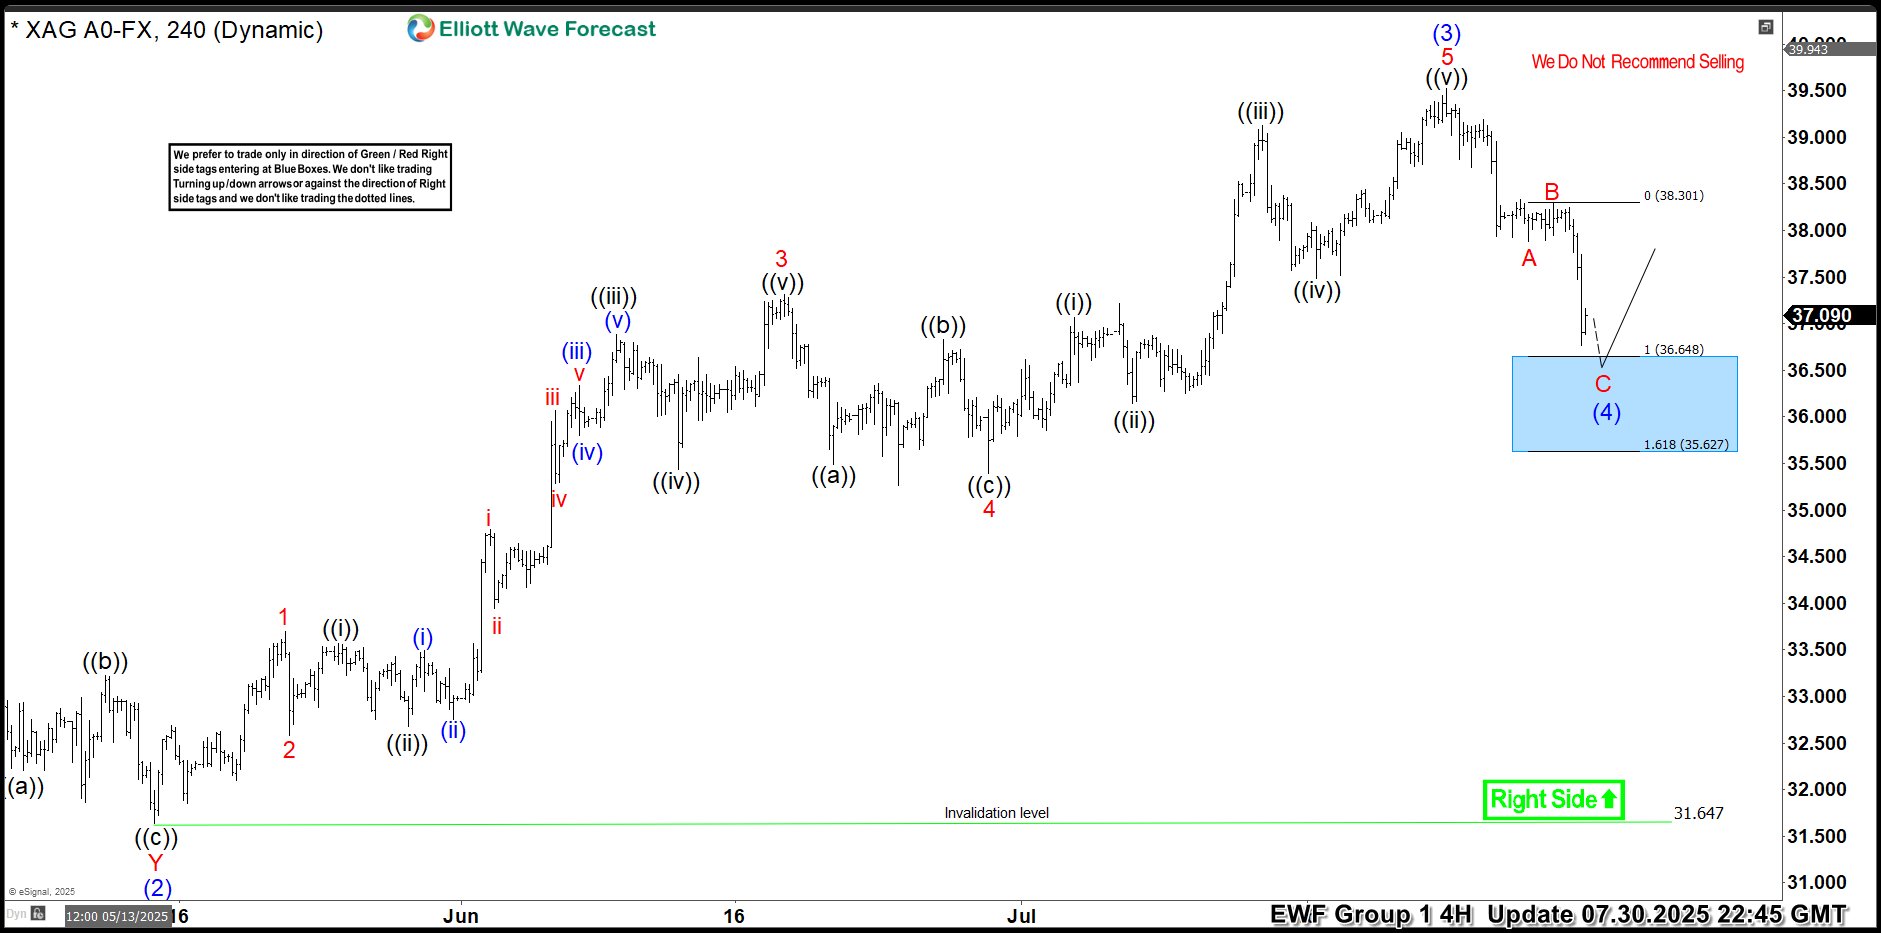
Hello traders. As our members know, we have had many profitable trading setups recently. In this technical article, we are going to talk about another Elliott Wave trading setup we got in Silver (XAGUSD). The commodity has completed its correction exactly at the Equal Legs zone, also known as the Blue Box Area. In this […]
-
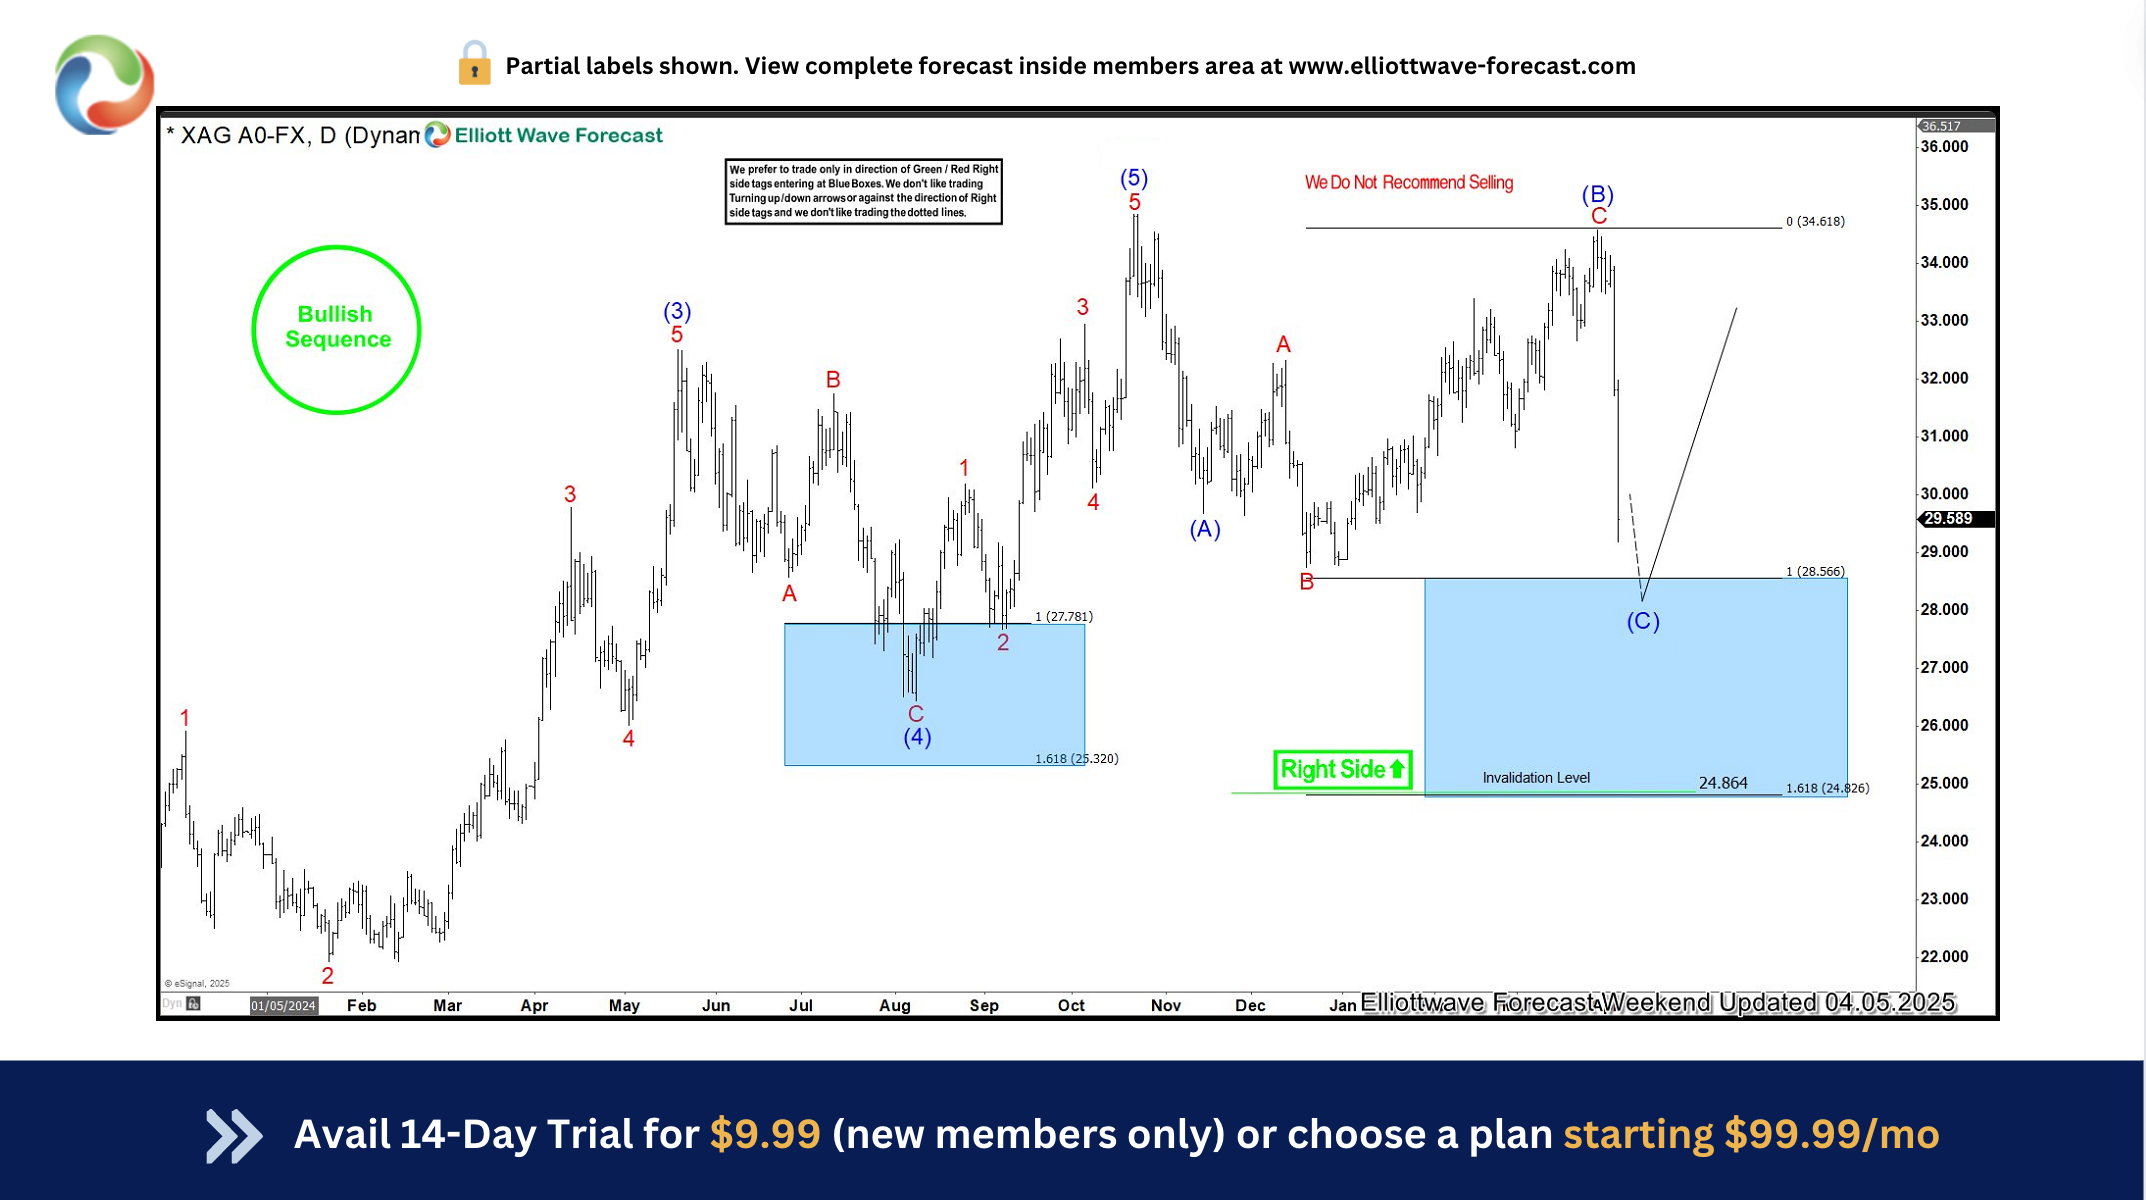
Silver’s Surge: XAGUSD Reacts Strongly from Blue Box Area
Read MoreIn this blog, we take a look at the past performance of $XAGUSD charts. In which, the Silver reacts strongly from blue box area.
-
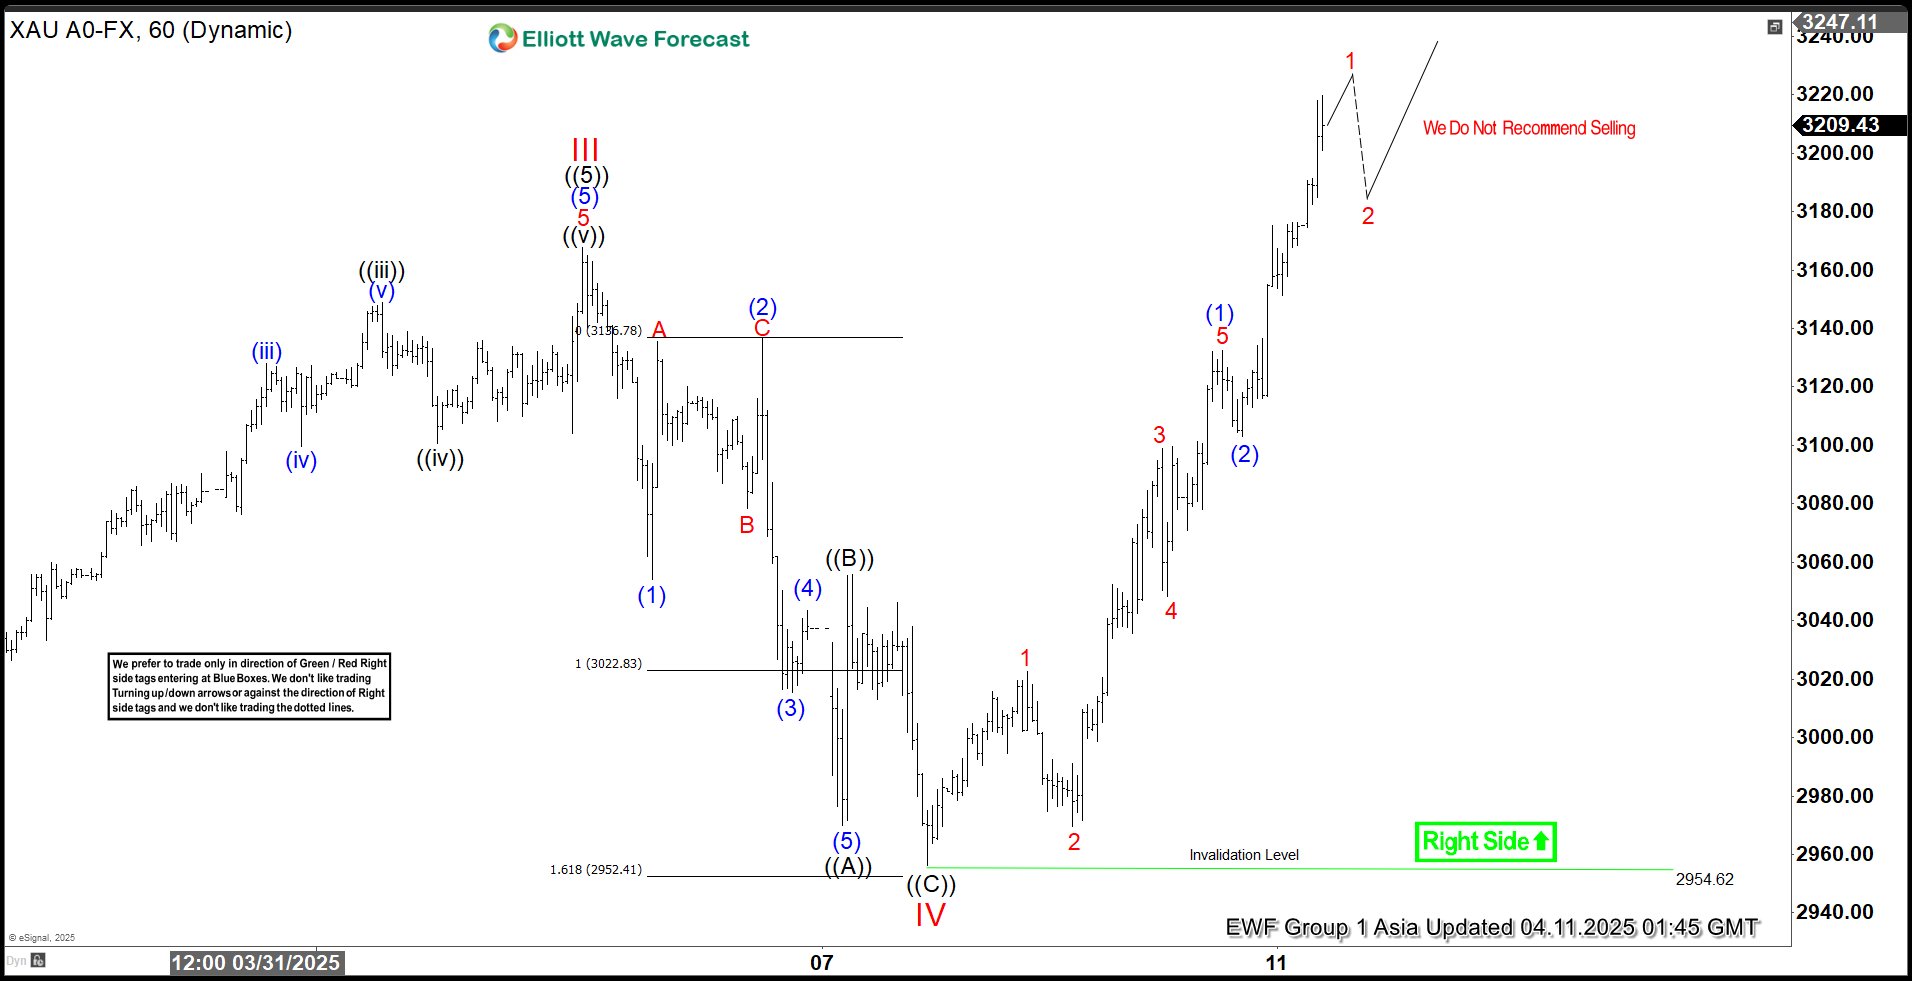
Gold touches all-time high. Overbought or poised for more upside?
Read MoreGold (XAUUSD) breaks to new all-time high and the metal should see more upside. This article and video look at the Elliott Wave path.
-
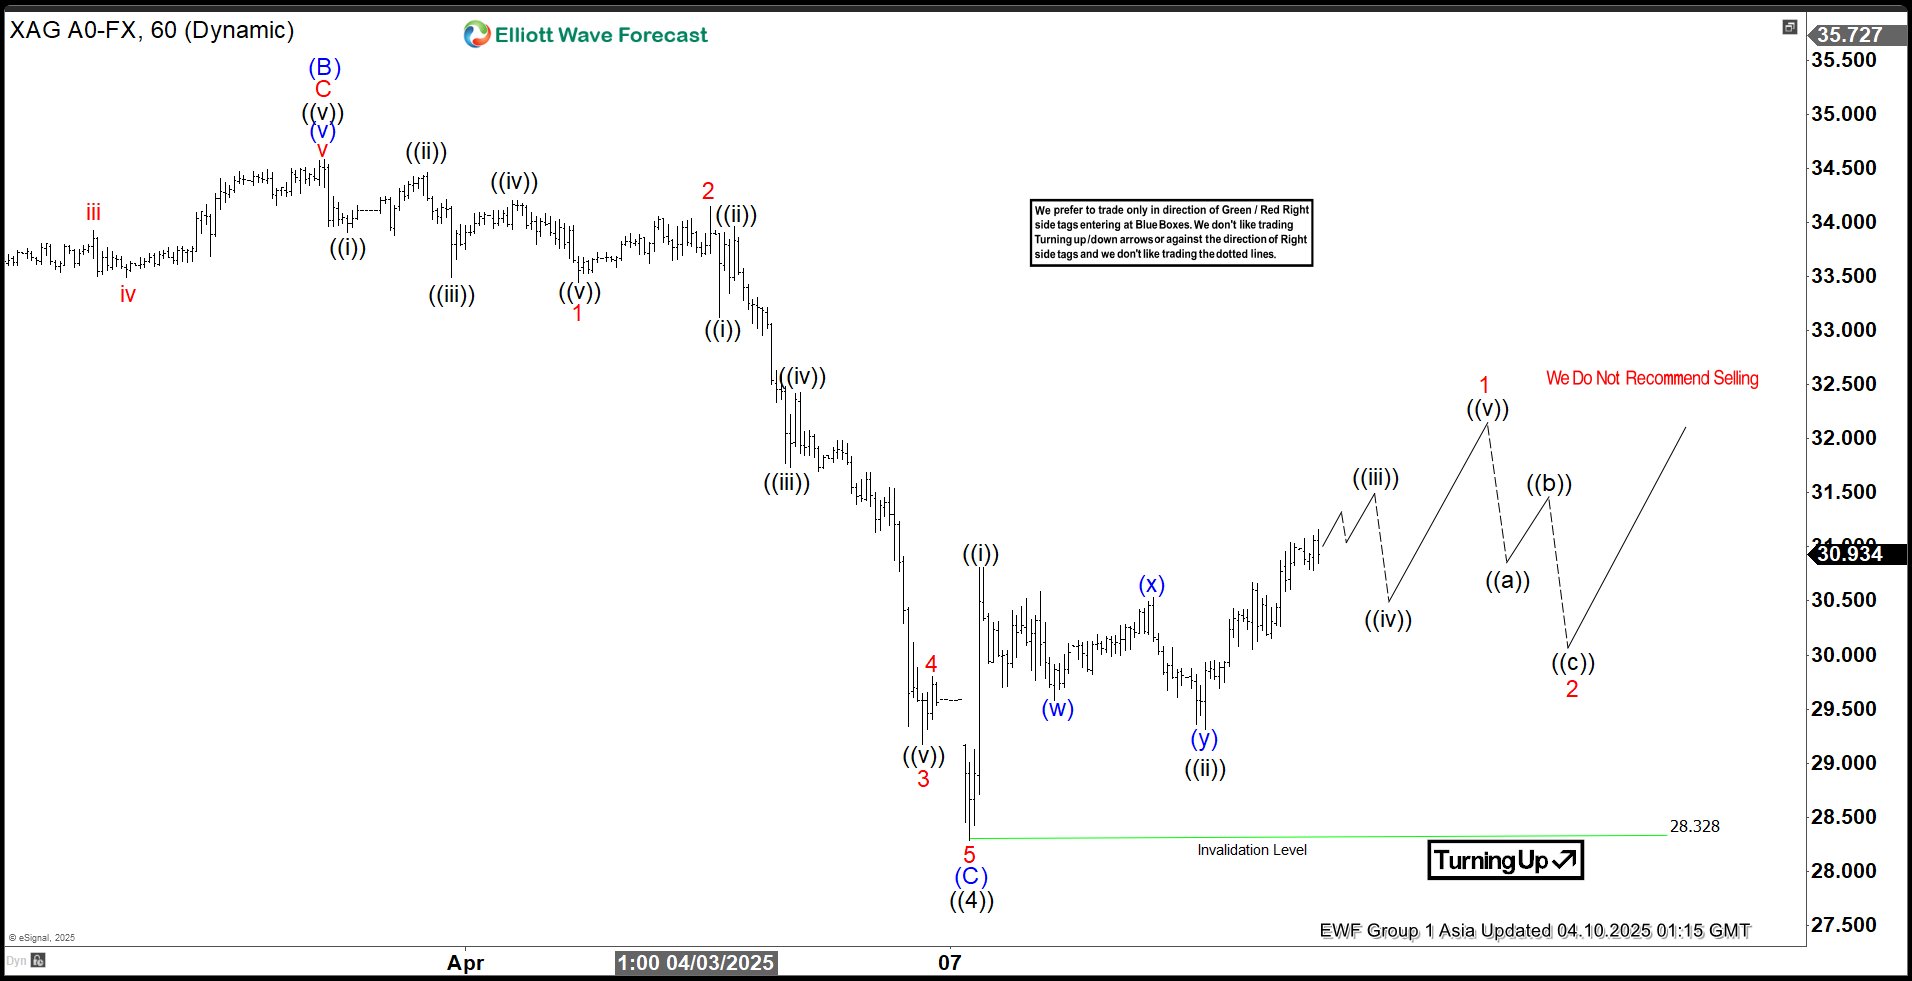
Elliott Wave Outlook: Silver (XAGUSD) might have launched into the following leg higher
Read MoreSilver (XAGUSD) has ended correction and turned higher. This article and video look at the Elliott Wave path of the metal.
-
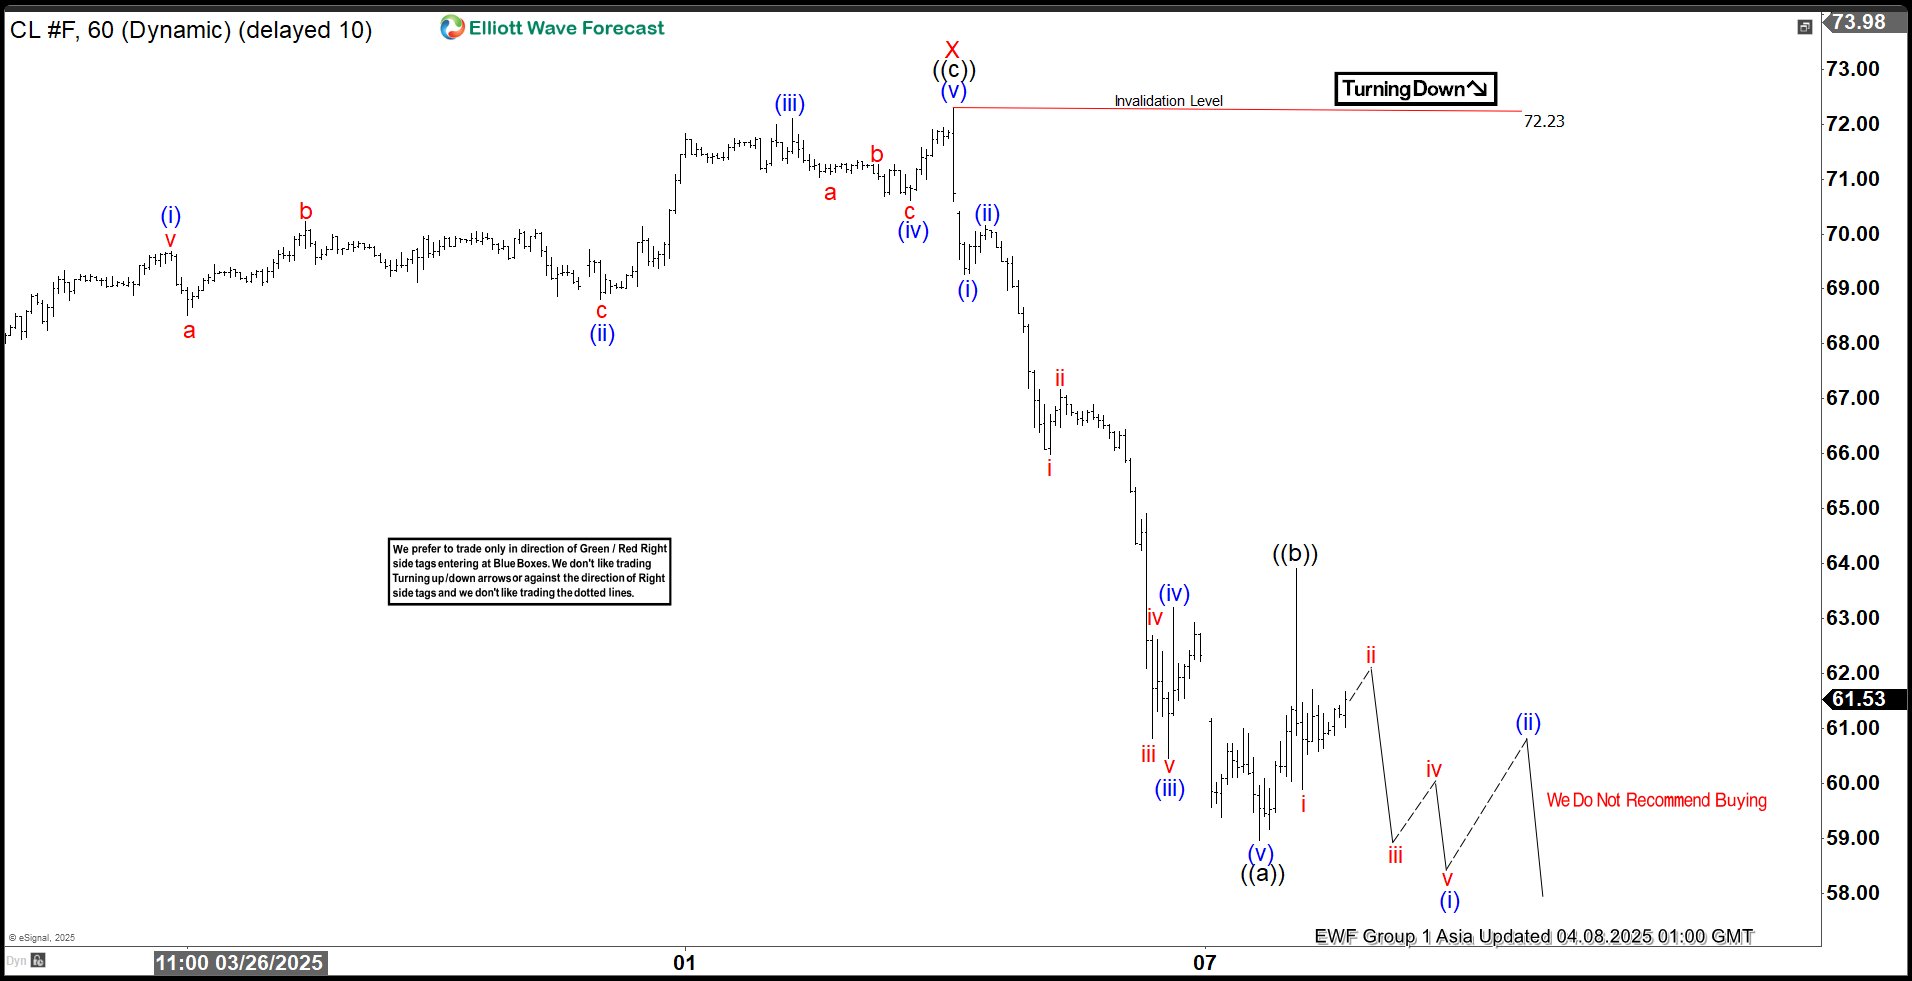
Light Crude Oil (CL) is Targeting Further Declines in the Near Term
Read MoreThe bearish sequence in Light Crude Oil (CL) remains unfinished, indicating room for more downside. This article & video examine the Elliott Wave outlook.
-
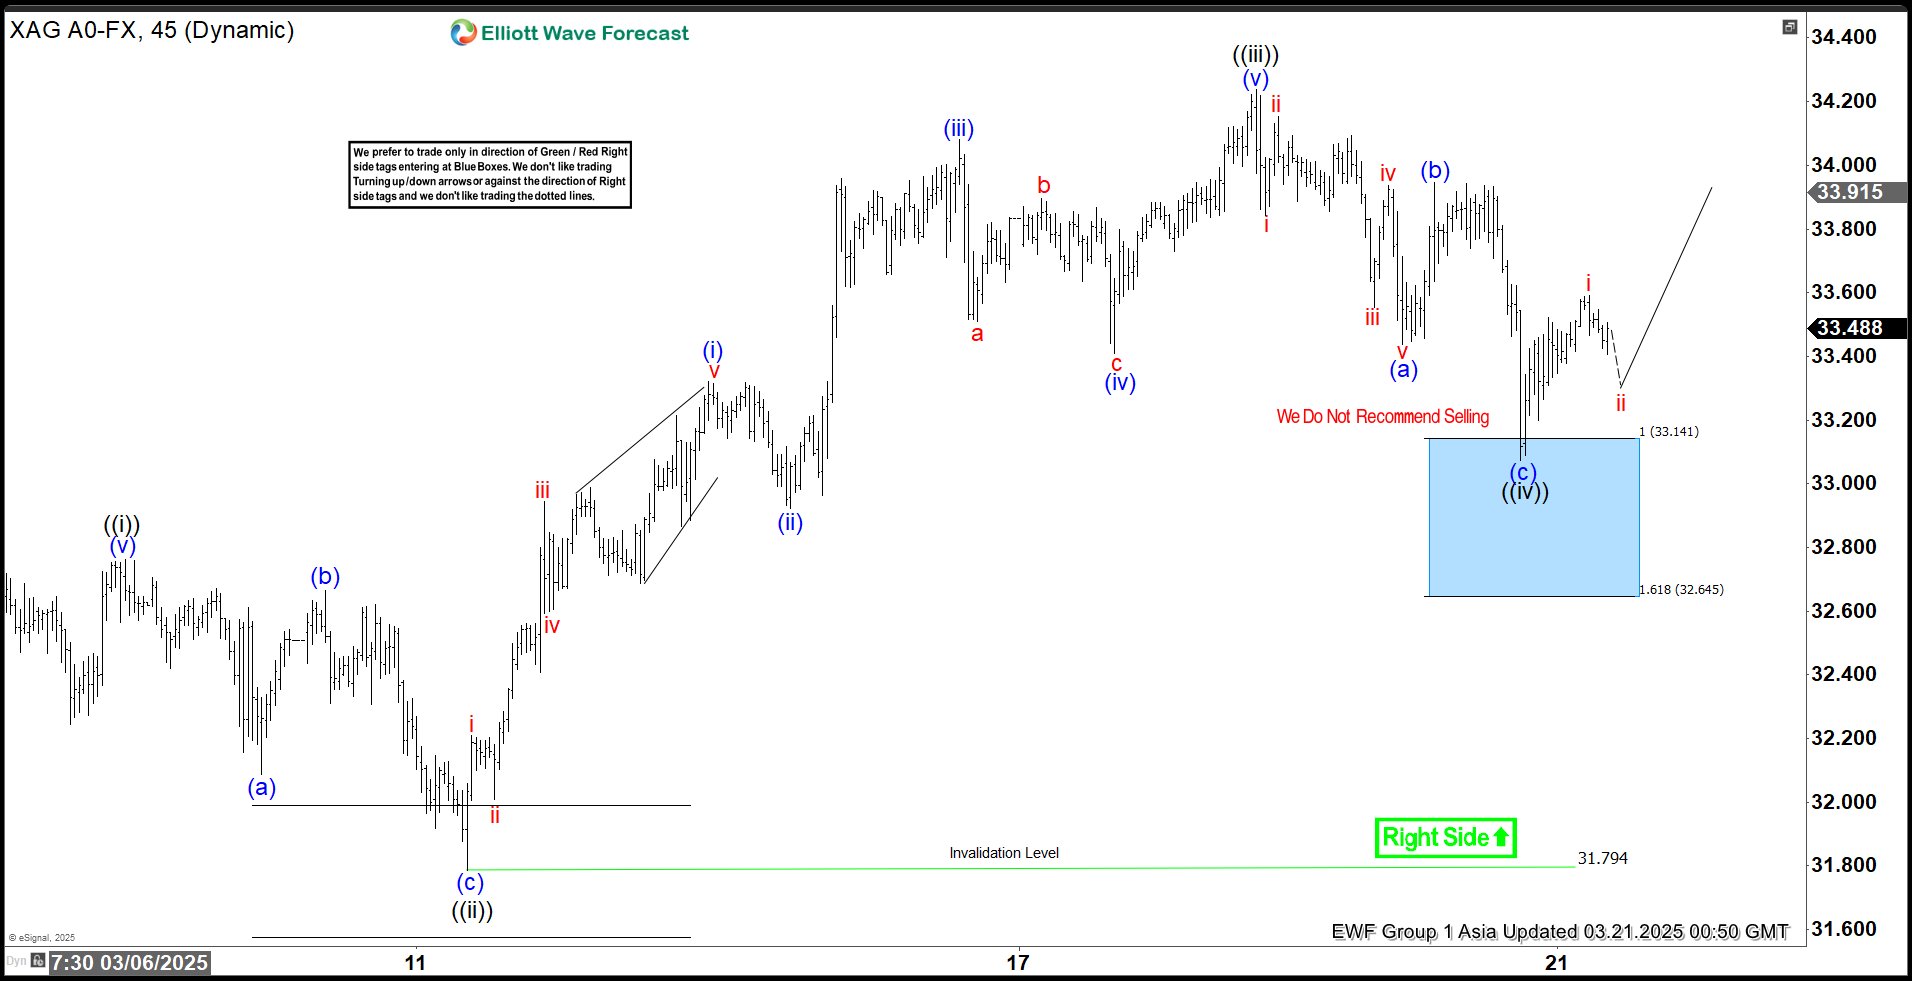
Elliott Wave View: Silver (XAGUSD) Pullback Remains Supported
Read MoreSilver (XAGUSD) is rallying as an impulse and pullback should continue to find support. This article and video look at the Elliott Wave path.
-

Natural Gas Reacted Strongly From The Blue Box Area
Read MoreIn this blog, we take a look at the past performance of Natural Gas charts. In which, the $NG_F reacted strongly from the blue box area.