
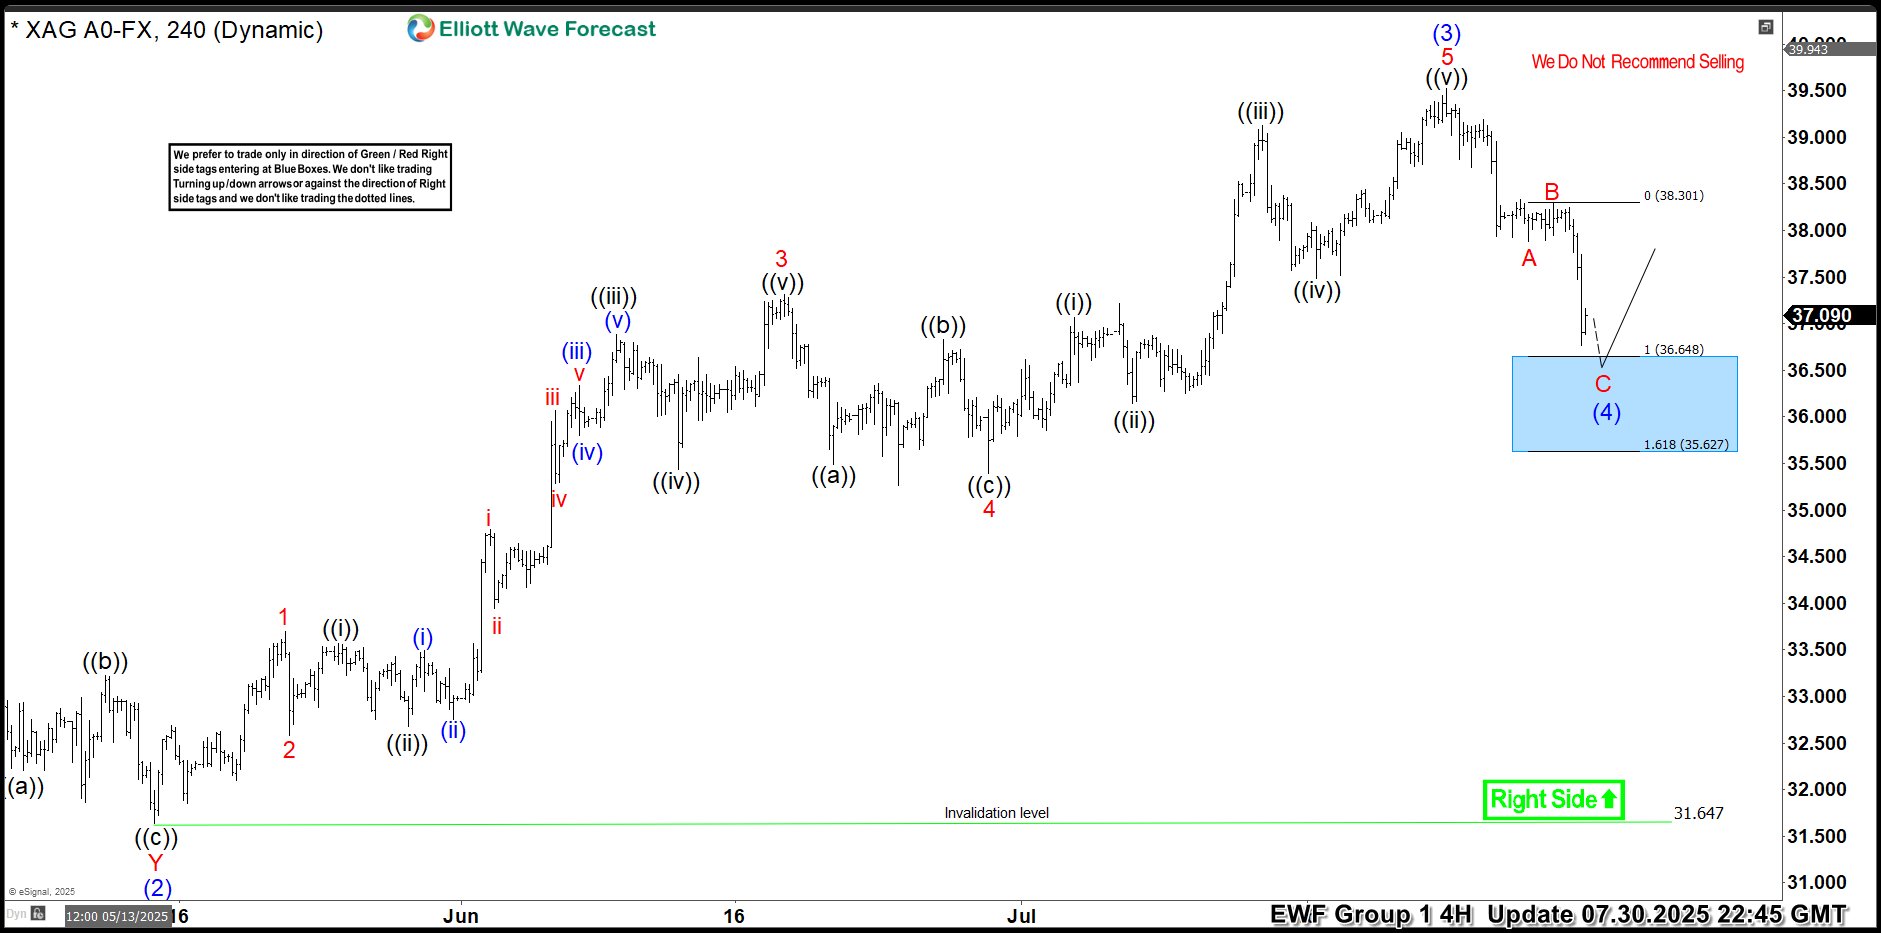
Hello traders. As our members know, we have had many profitable trading setups recently. In this technical article, we are going to talk about another Elliott Wave trading setup we got in Silver (XAGUSD). The commodity has completed its correction exactly at the Equal Legs zone, also known as the Blue Box Area. In this […]
-
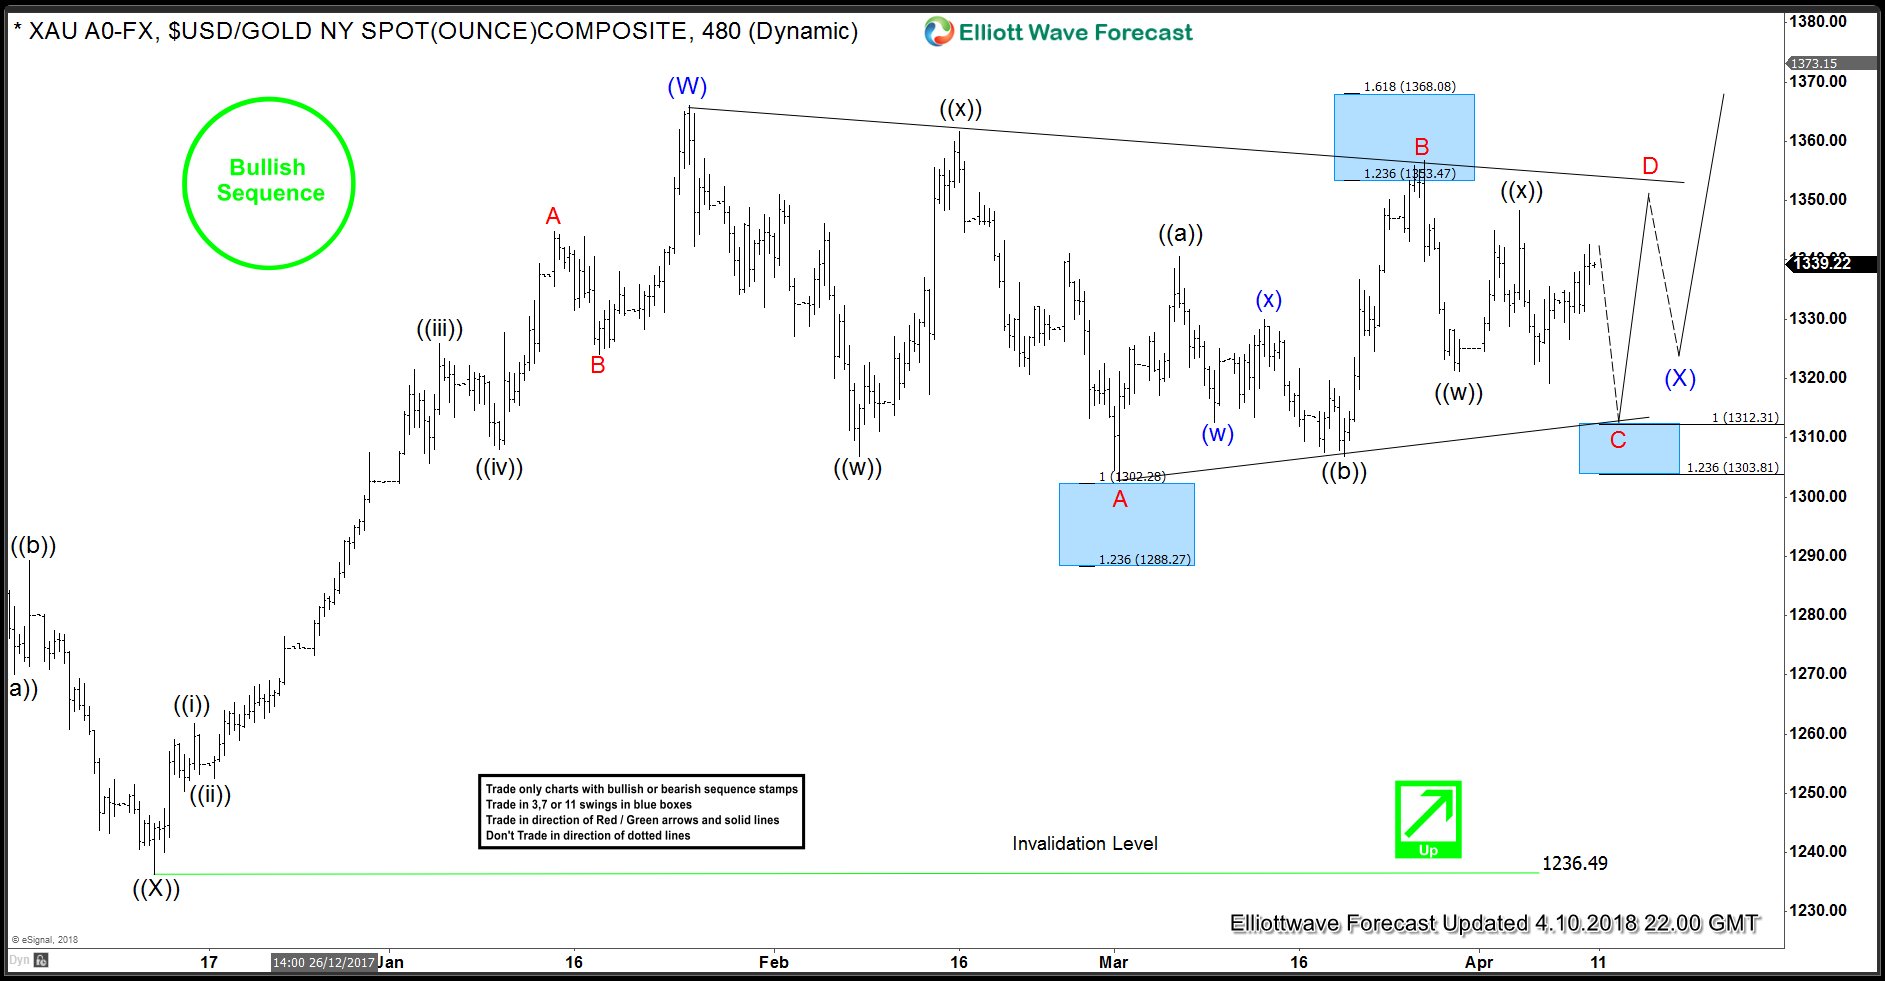
Gold Elliott Wave View: Bullish Triangle Consolidation
Read MoreGold has been trading in a sideways range between $1366 and $1302 for nearly 3 months now and has not yet managed to break the consolidation on either side. This consolidation is increasingly looking like a Bullish Triangle Consolidation and once completed, should result in a thrust out of the triangle. We will also present […]
-
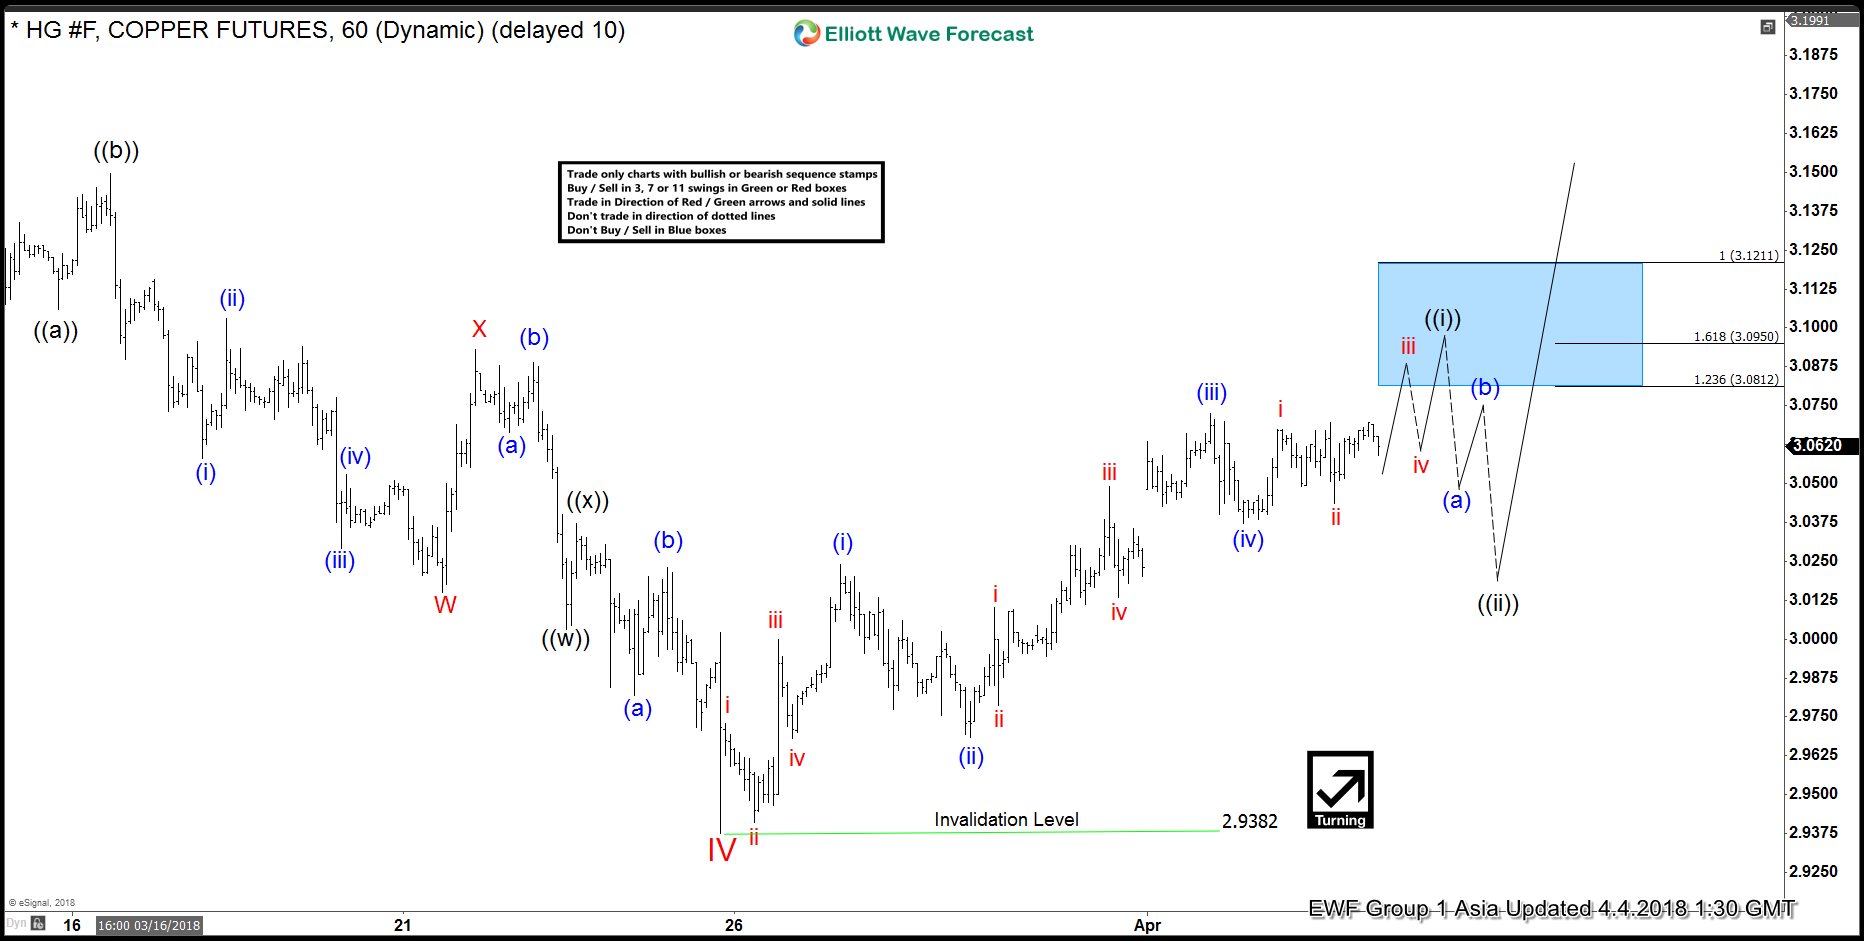
Elliott Wave View: Copper Starts a New Leg Higher
Read MoreShort Term Elliott Wave view in Copper suggests that the decline to 2.938 on 3.26.2018 ended Minor wave IV. The metal started a new leg higher from there in Minor wave V. Subdivision of Minor wave V is unfolding as an impulse Elliott Wave structure. An Impulse Elliott Wave structure is a 5 waves structure where […]
-
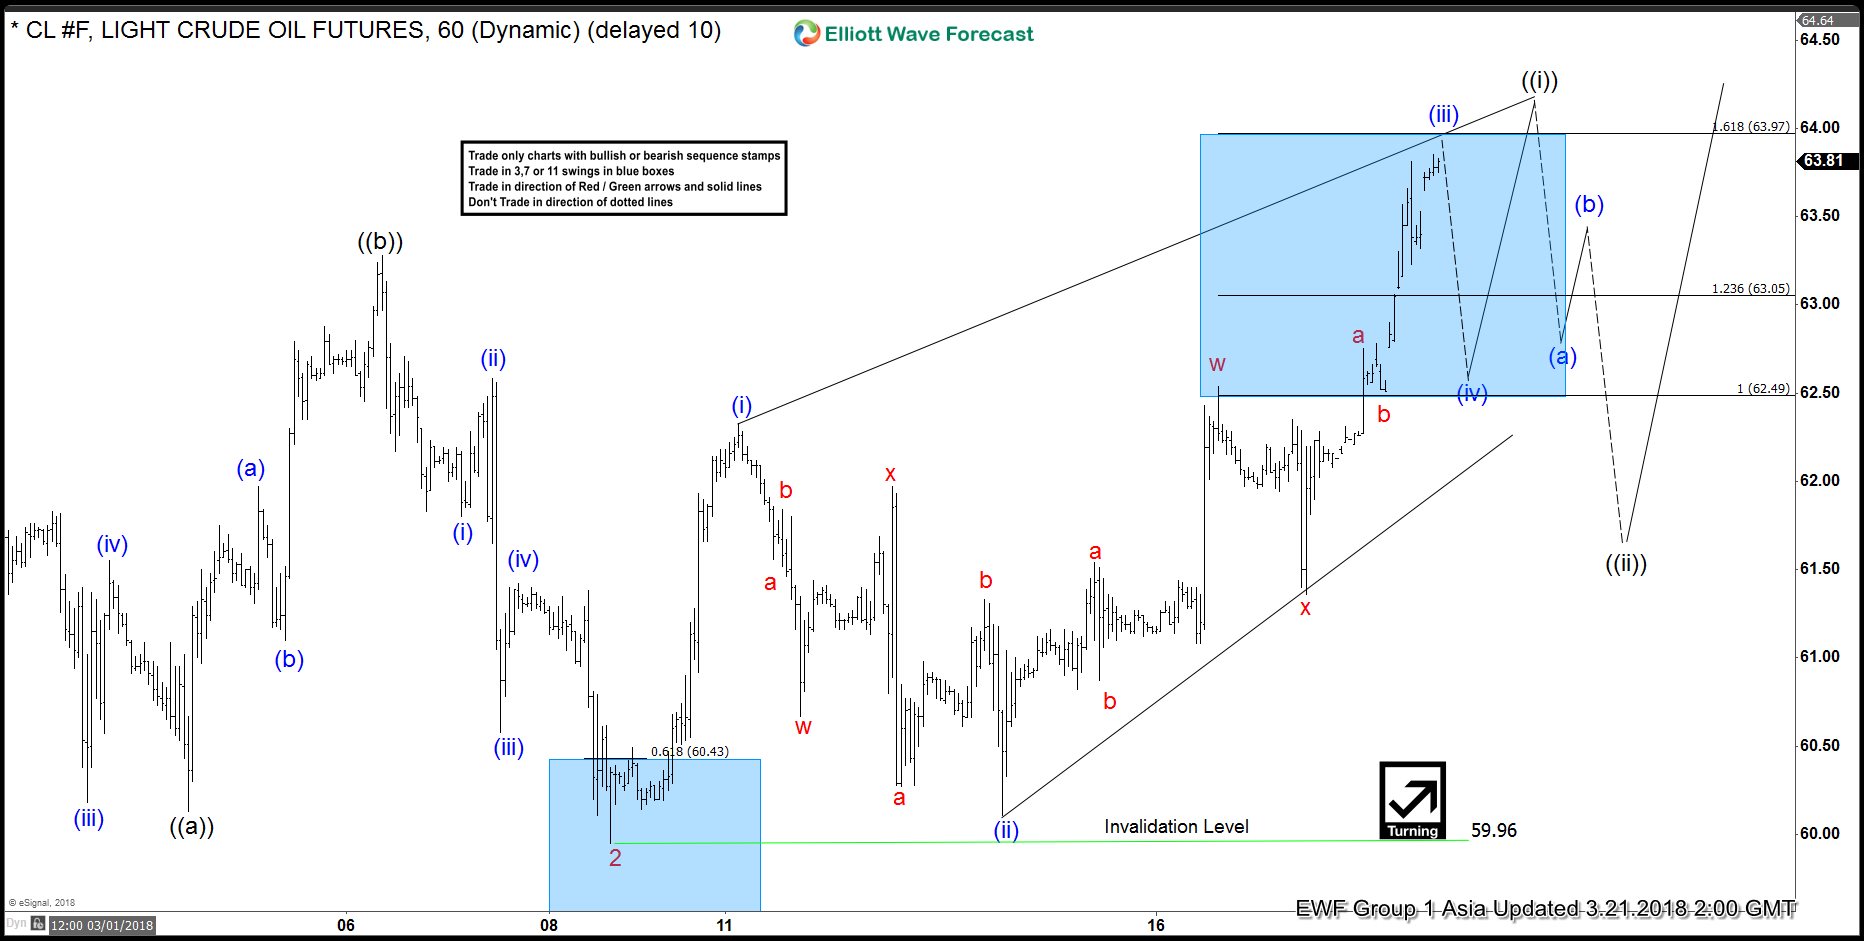
Elliott Wave Analysis: Oil (CL_F) Looking to Extend Higher in Wave 3
Read MoreOil (CL_F) Short Term Elliott Wave view suggests that the decline to 59.95 on 3/9 ended Minor wave 2. Minor wave 3 is unfolding as a 5 waves impulse Elliott Wave Structure where Minute wave ((i)) of 3 is currently in progress as a leading diagonal. Up from 59.96, Minutte wave (i) ended at 62.33, Minutte […]
-

Elliott Wave Analysis: Copper at Risk of Further Weaknesses
Read MoreCopper (HG_F) broke below $3.5 low ($3.095) earlier today. As a result, it shows a bearish sequence from 2/16 peak ($3.272), risking for further downside. Current short term Elliott Wave view in Copper suggests that the rally to $3.272 on 2/16 ended Primary wave ((X)). The decline from there is unfolding as a double three Elliott […]
-
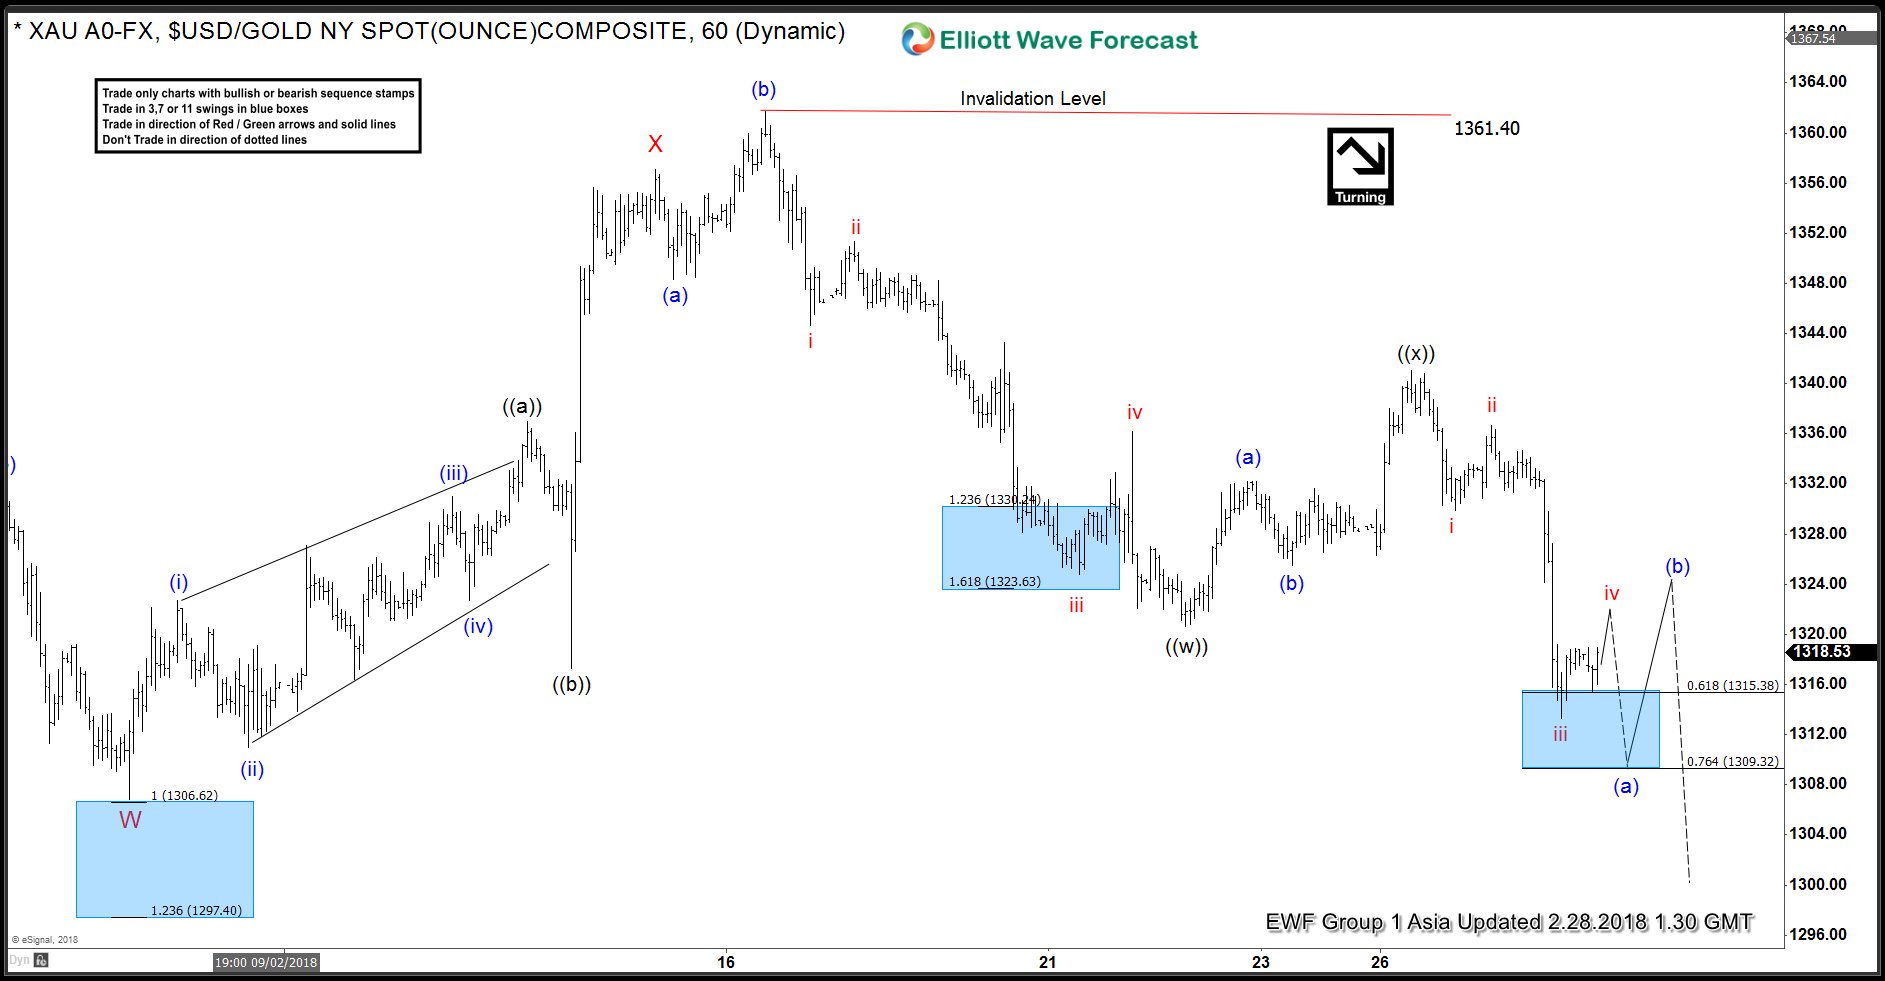
Elliott Wave Analysis: Gold in Double Correction
Read MoreRevised Short Term Elliott Wave view in Gold suggests that the yellow metal is still correcting cycle from 12/13/2017 low ($1236.3) as a double three Elliott Wave structure. Up from 12/13/2017 low, Intermediate wave (W) ended at $1366.06 and Intermediate wave (X) pullback remains in progress as a double three. Down from $1366.06, Wave W of […]
-
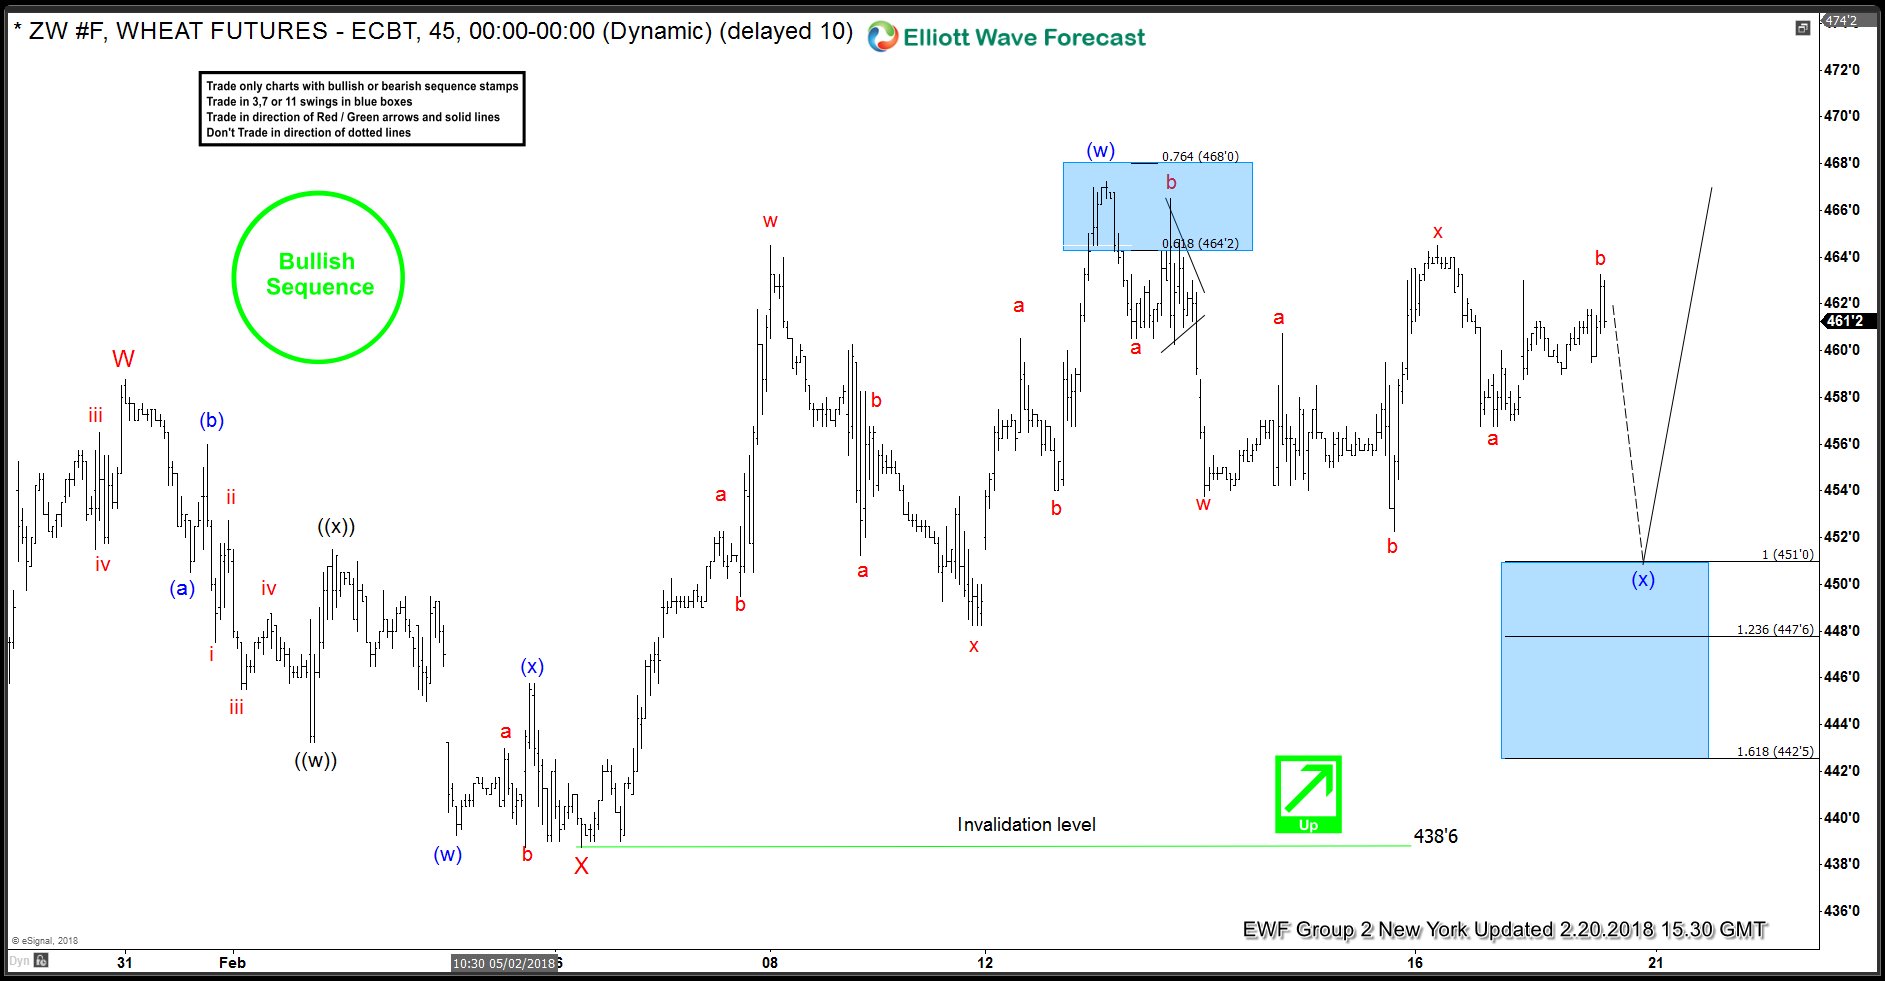
WHEAT (ZW #F) Forecasting Rally & Buying Dips
Read MoreHello fellow traders. Another trade setup we have advised to members recently is WHEAT (ZW #F). In this technical blog we’re going to take a quick look at the past Elliott Wave charts of ZW #F published in members area of www.elliottwave-forecast.com, explain the forecast and trading setup. As our members know, WHEAT have incomplete and […]