
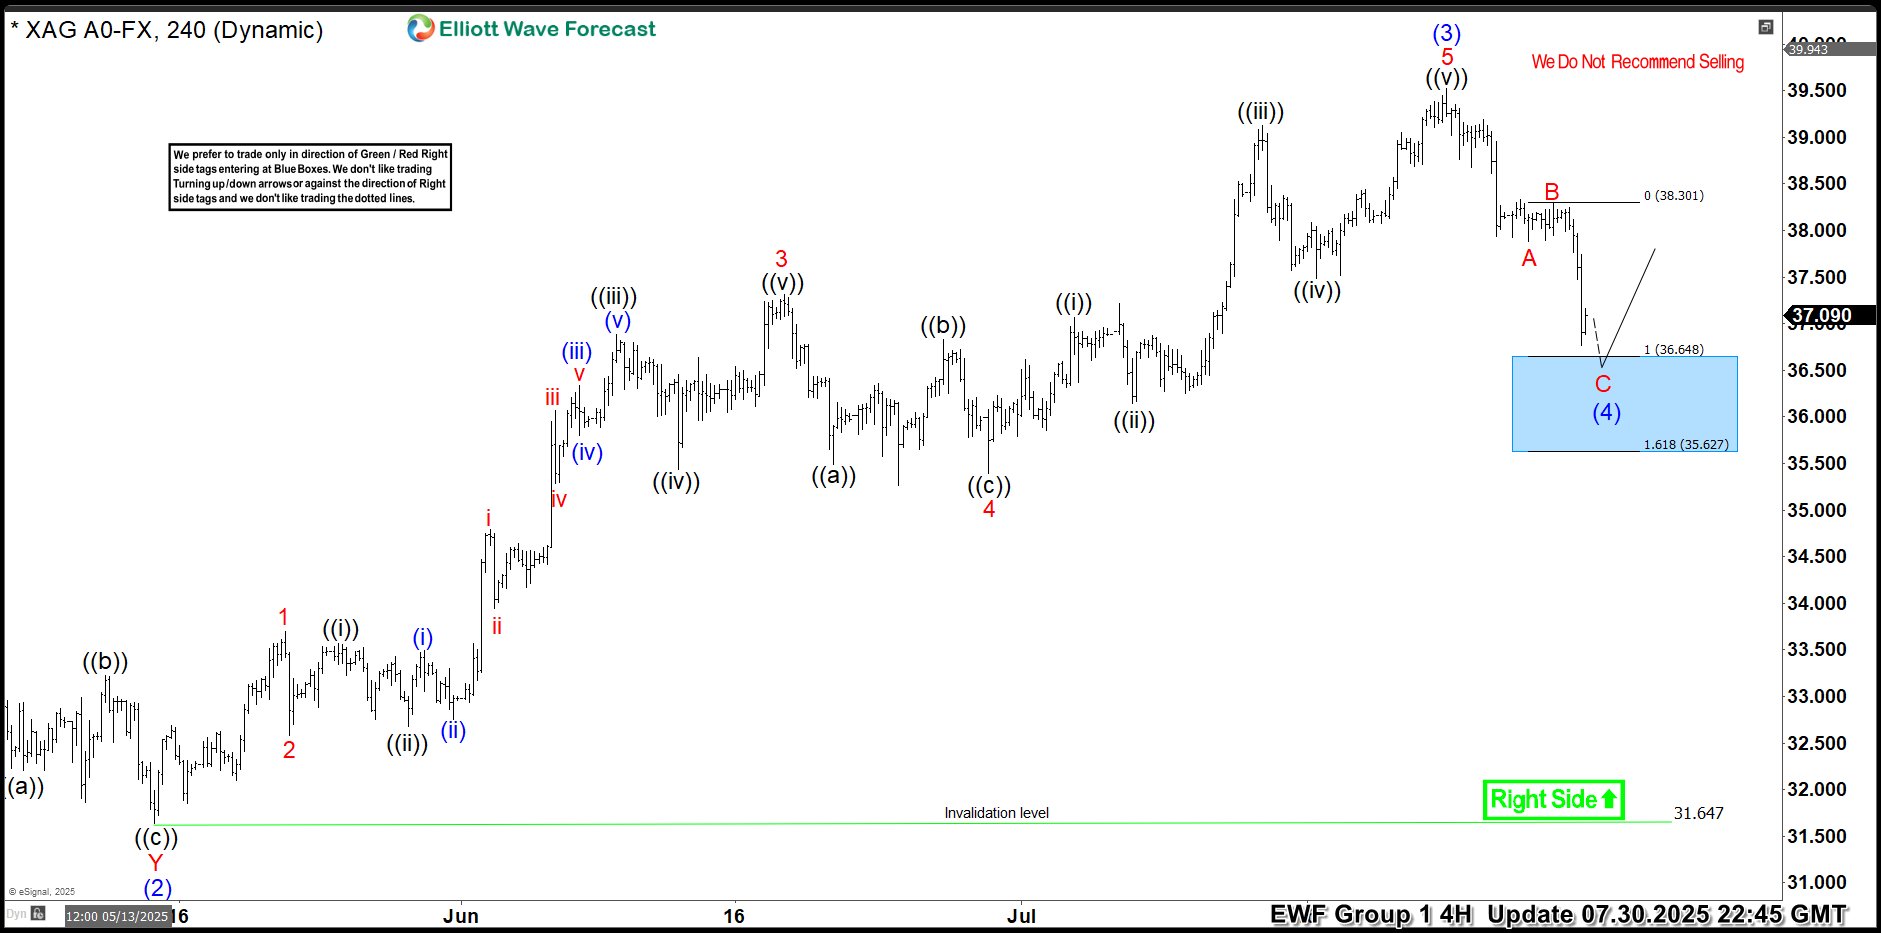
Hello traders. As our members know, we have had many profitable trading setups recently. In this technical article, we are going to talk about another Elliott Wave trading setup we got in Silver (XAGUSD). The commodity has completed its correction exactly at the Equal Legs zone, also known as the Blue Box Area. In this […]
-
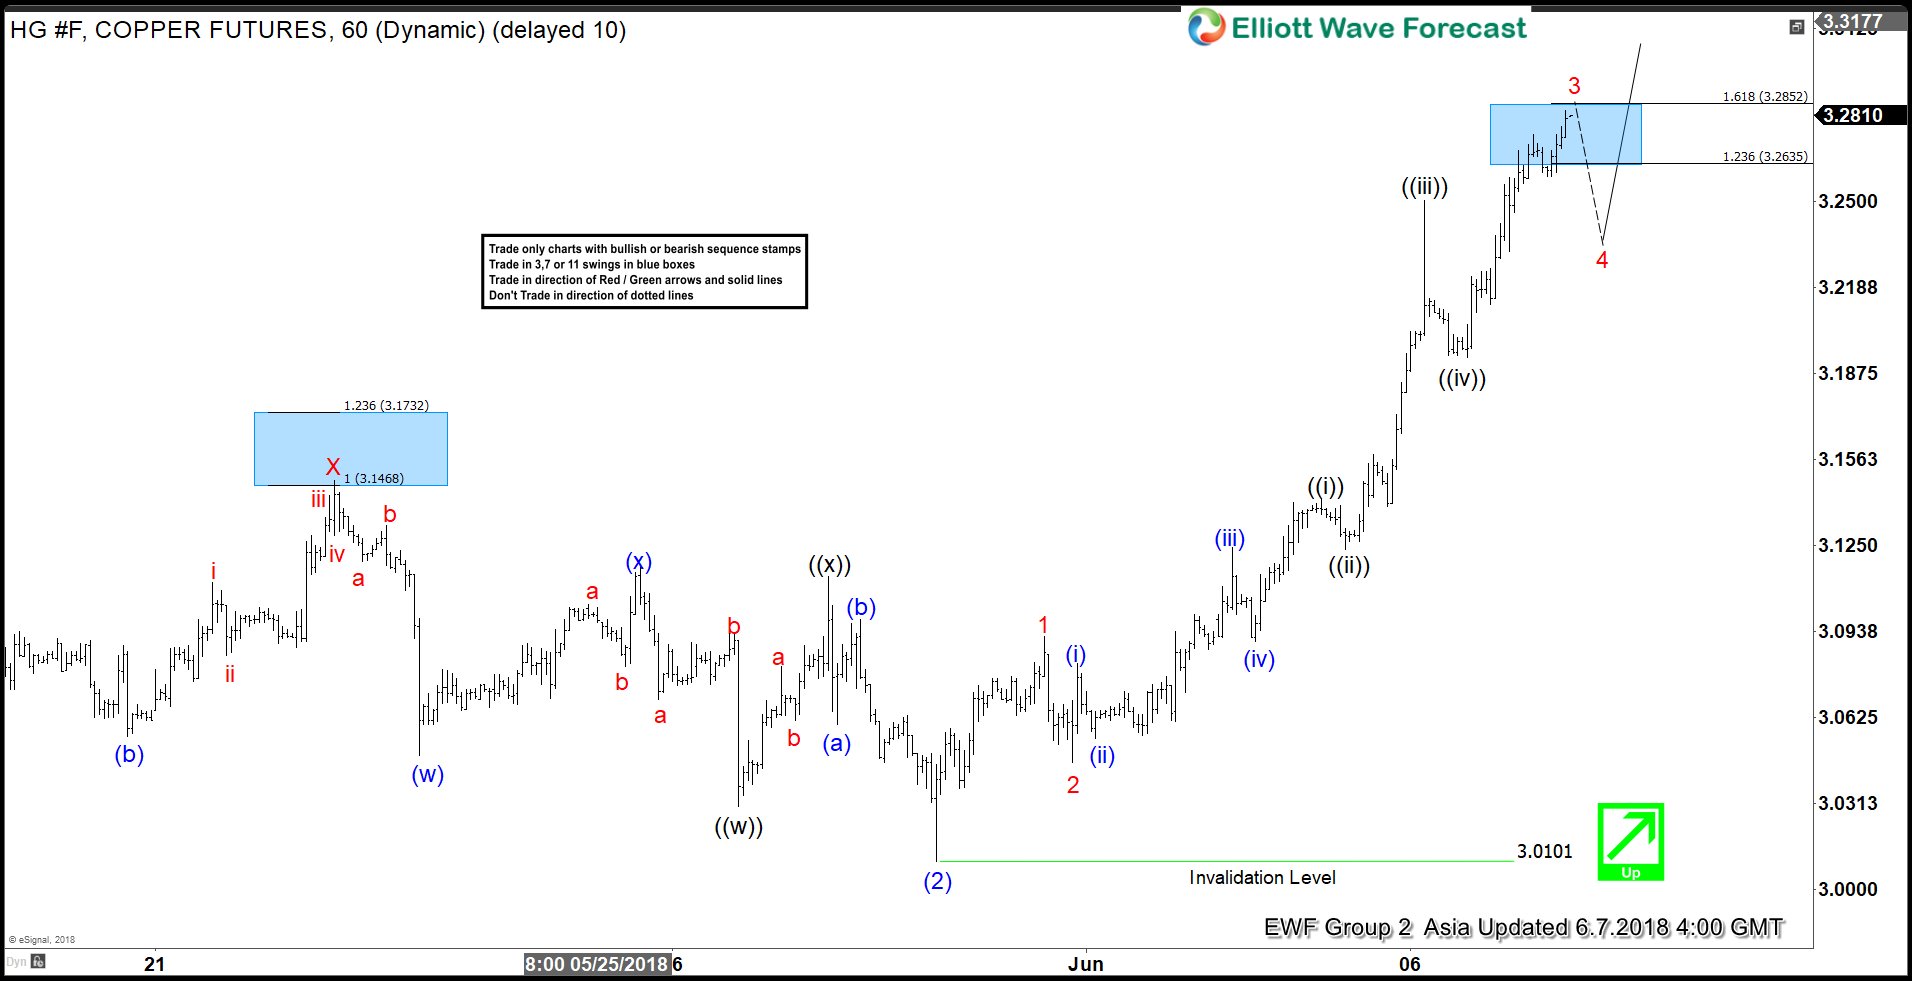
Copper Elliott Wave View: Next Extension Higher may have started
Read MoreCopper ticker symbol: HG_F short-term Elliott wave view suggests that the pullback to 3.0101 on 5/30/2018 ended Intermediate wave (2). The internals of Intermediate wave (2) unfolded as Elliott wave double three structure where Minor wave W ended at 3.0195. Minor wave X ended at 3.1485 high and the decline to 3.0101 low ended Minor […]
-
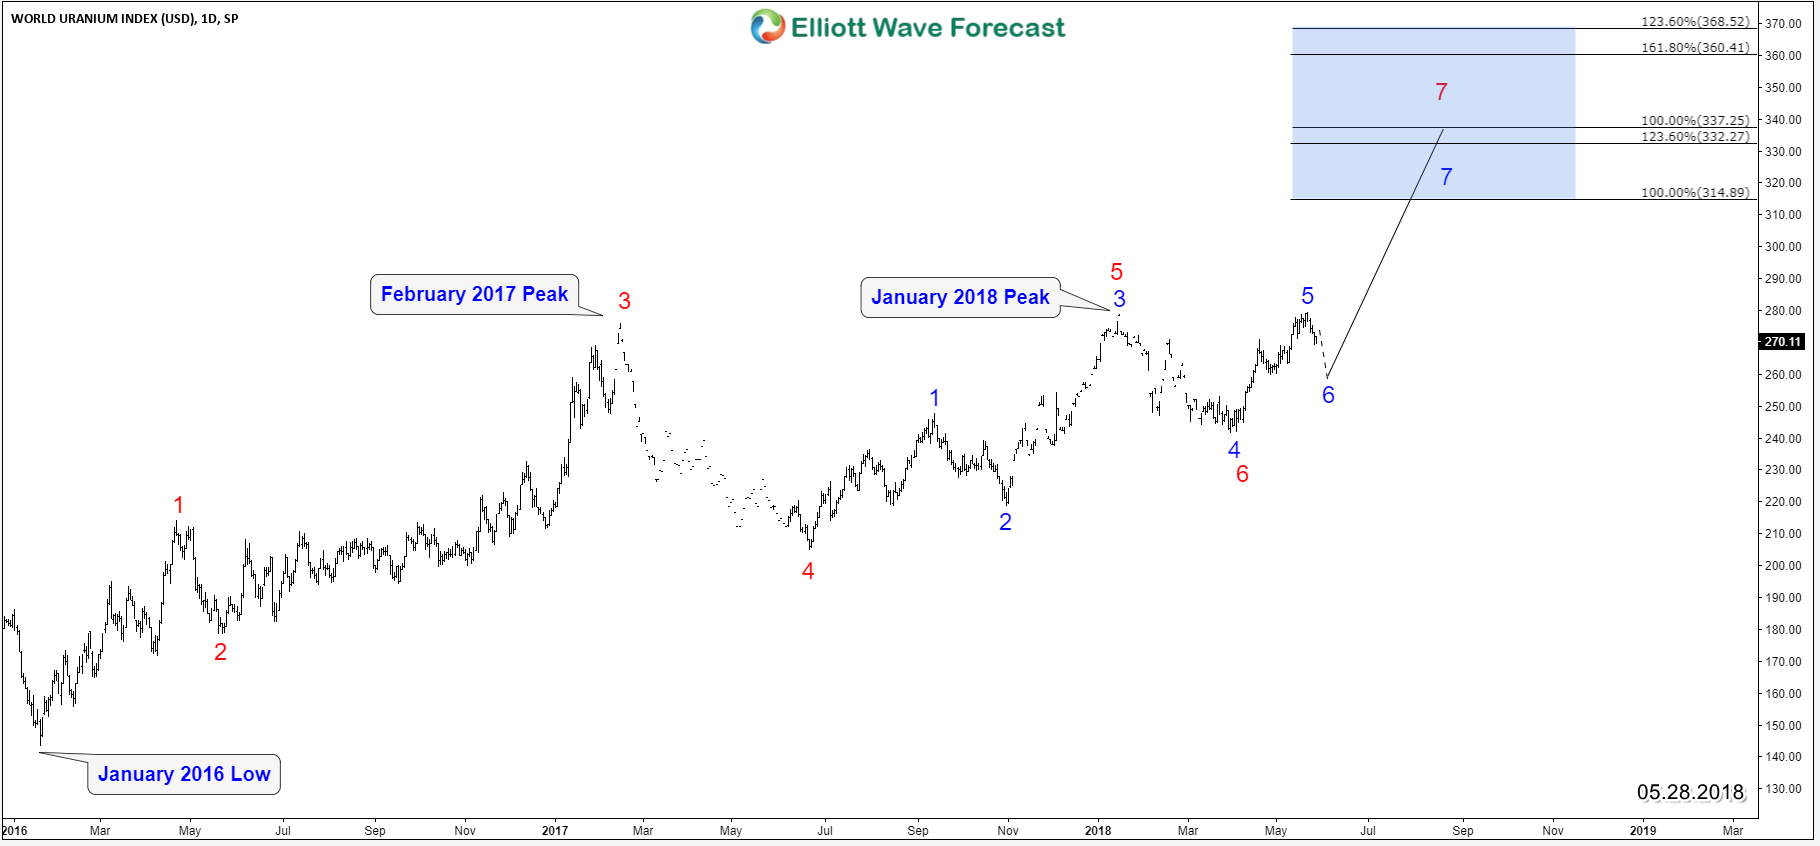
World Uranium Index Suggesting Higher price for the metal
Read MoreWorld Uranium Index (URAXPD) and Uranium Futures contract tracking the spot price of the metal which ended the downtrend cycle from 2007 peak and been bouncing higher since 2016 lows. The two instrument may have different dates for the peak or low but they share the same swings and URAXPD is the one leading move at current […]
-
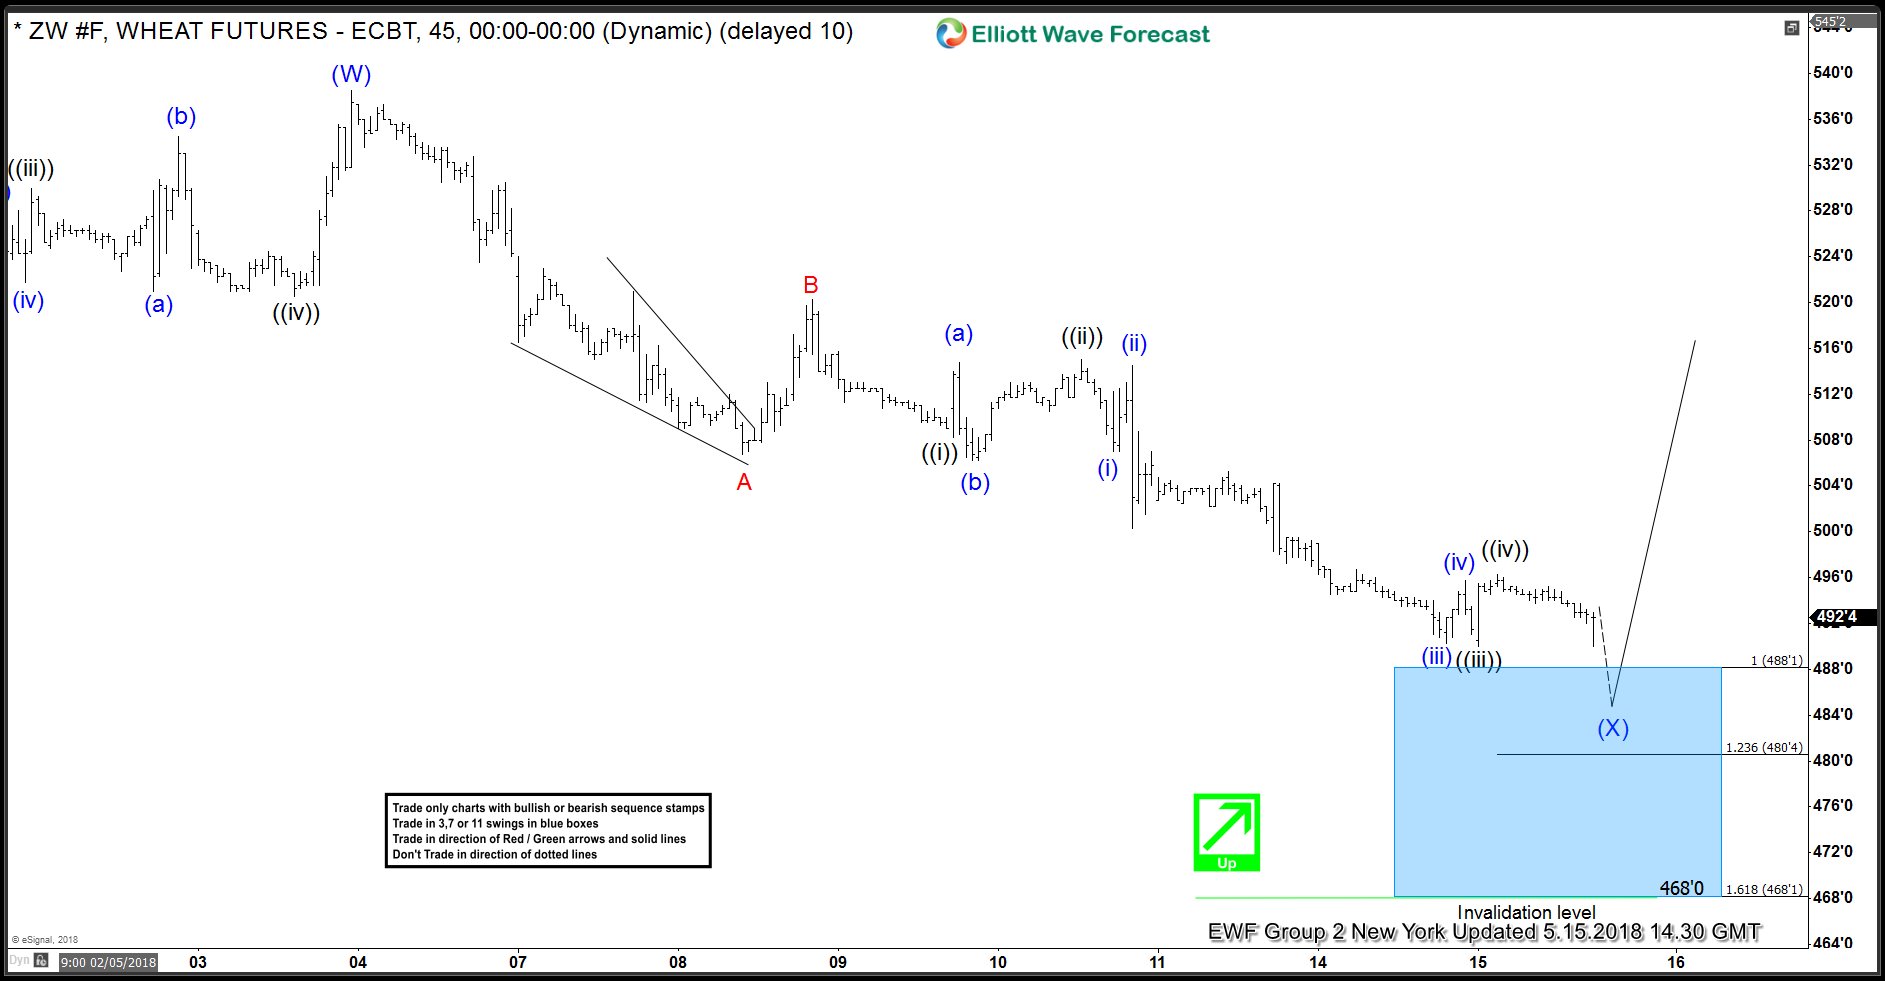
Wheat Elliott Wave Analysis: Forecasting And Buying The Rally
Read MoreIn this blog, I want to share some short-term Elliott Wave charts of Wheat Futures which we presented to our members in the past. Below, you see the 1-hour updated chart presented to our clients on the 05/15/18 showing Wheat reaching a blue box buying area as a Zig-zag Elliott wave structure. Wheat ended the cycle from […]
-
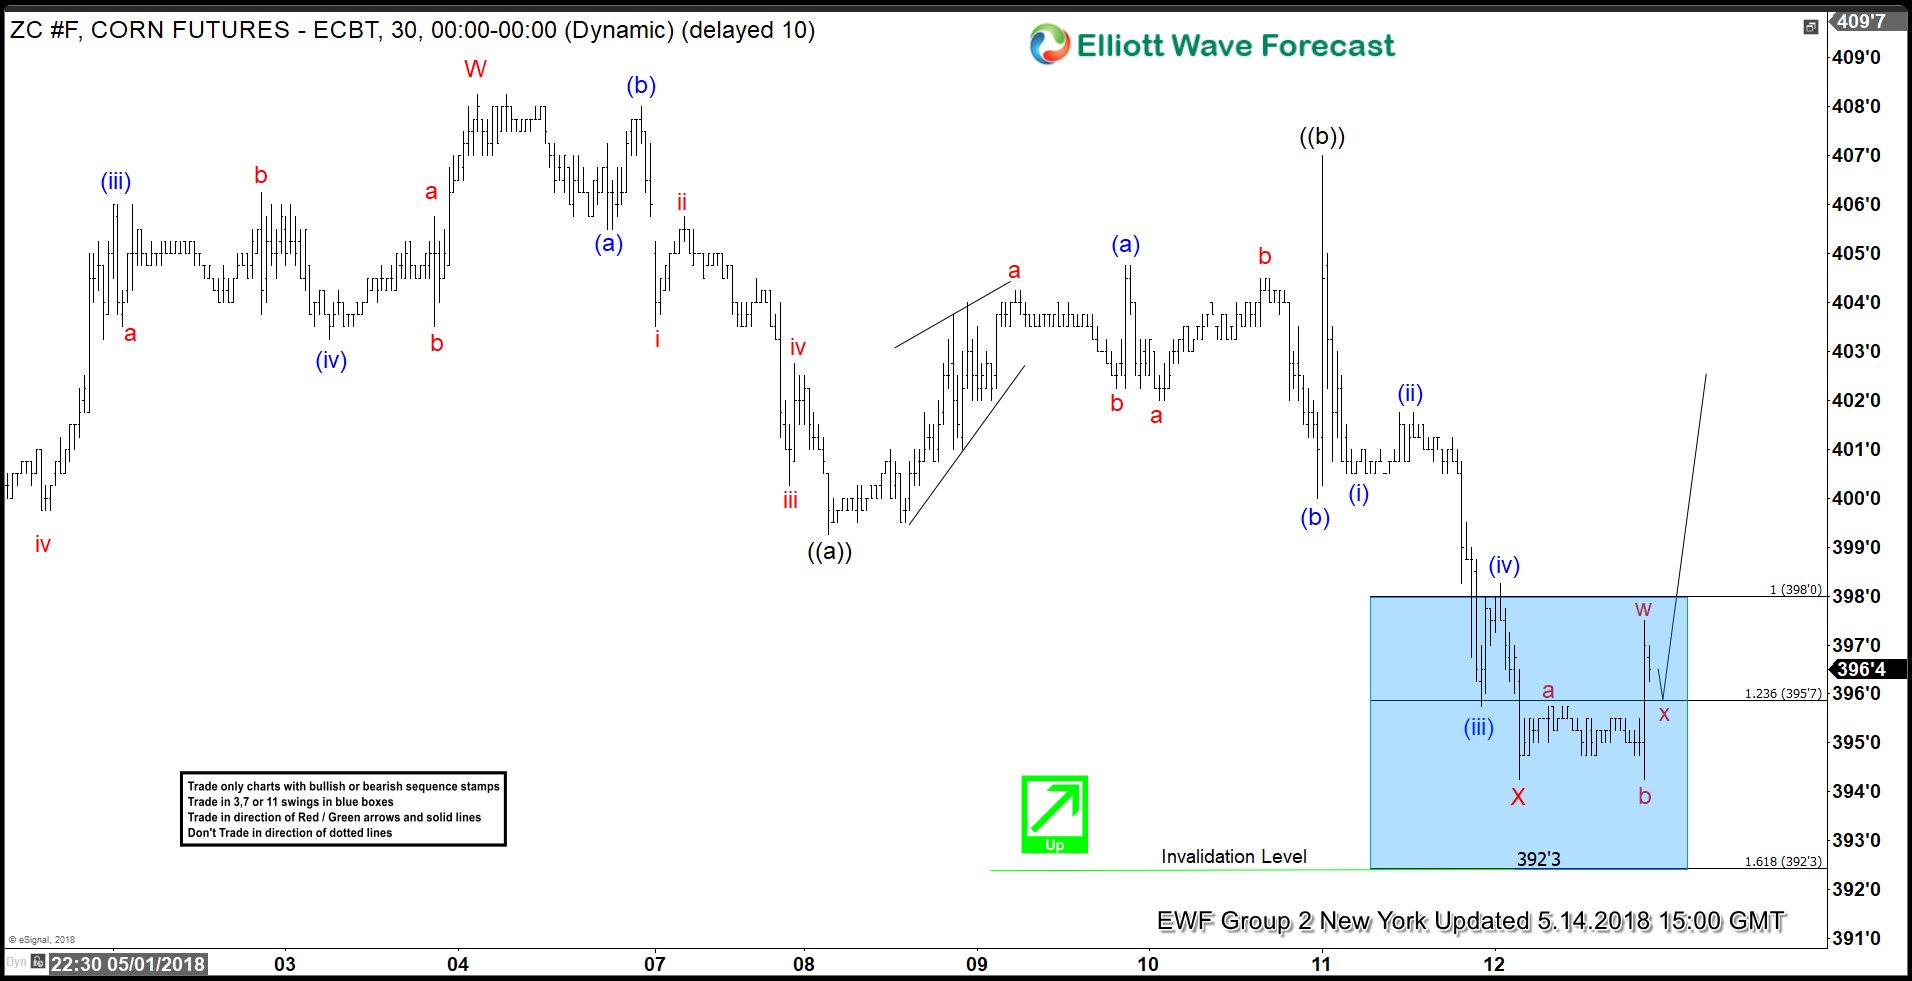
CORN (ZC #F) Futures Forecasting the Rally & Buying The Dips
Read MoreHello fellow traders. Another trading opportunity we have had lately is Corn Futures. In this technical blog we’re going to take a quick look at the Elliott Wave charts of ZC #F published in members area of the website. In further text we’re going to explain the forecast and trading setup. As our members know, […]
-
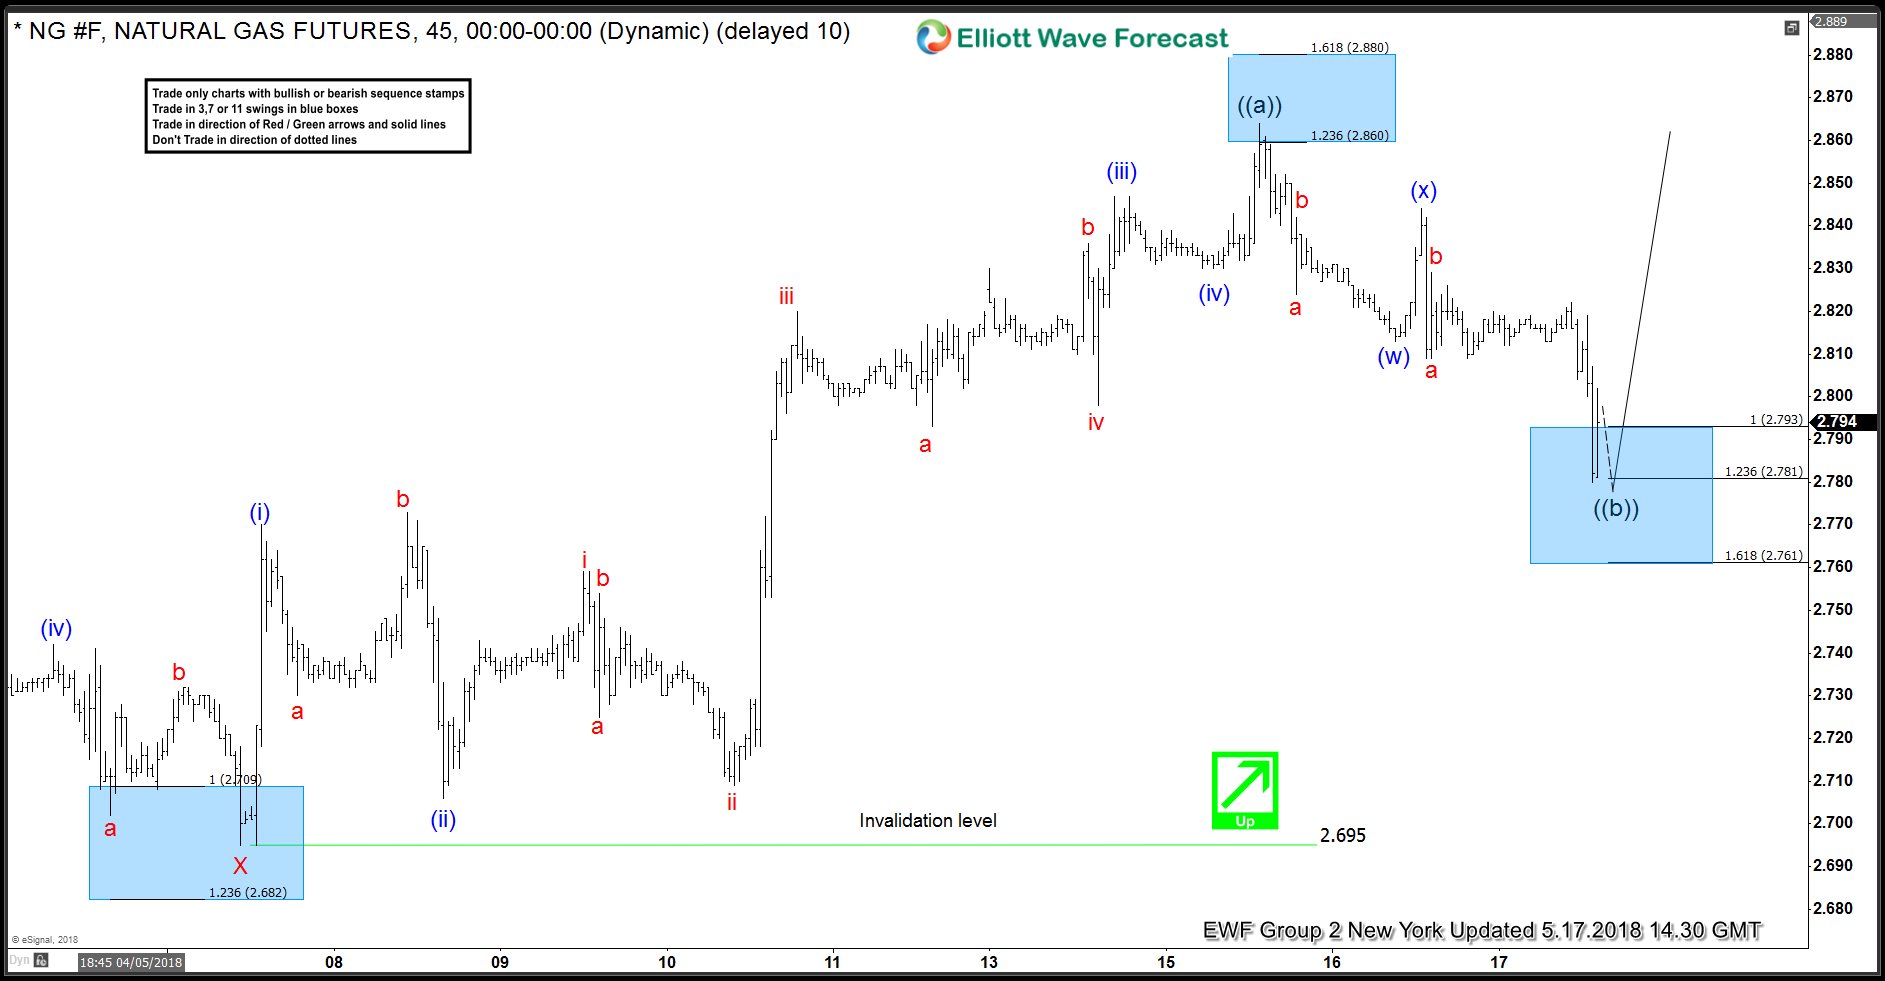
Natural Gas ( NG #F) Buying The Dips
Read MoreHello fellow traders. Another trading opportunity we have had lately is Natural Gas (NG #F). In this technical blog we’re going to take a quick look at the past Elliott Wave charts of NG #F published in members area of the website. In further text we’re going to explain the forecast and trading setup. Natural […]
-
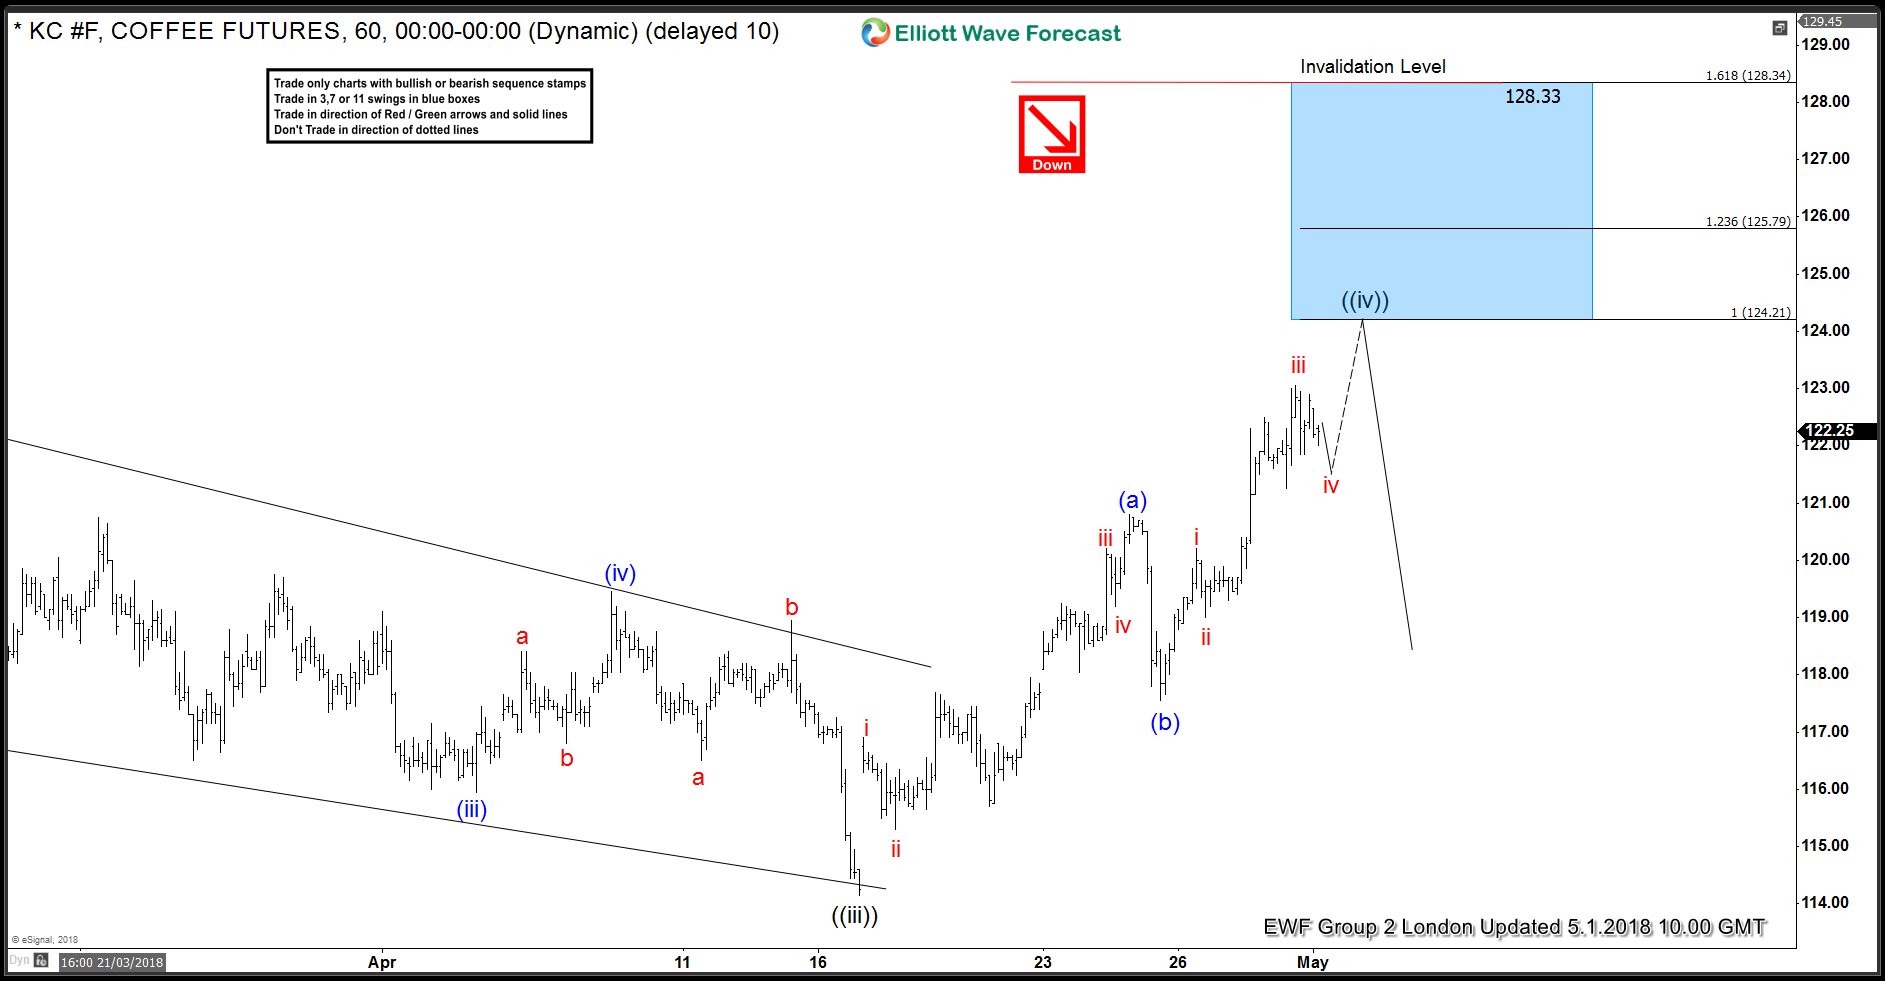
COFFEE Futures (KC#F) Selling The Bounce
Read MoreHello fellow traders. In this technical blog we’re going to take a quick look at the charts of COFFEE Futures (KC#F) . In further text we’re going to explain the Elliott Wave structure, forecast and trading strategy. As our members know, KC#F has had incomplete bearish sequences in H4 cycle according to Sequence Report. Consequently […]