
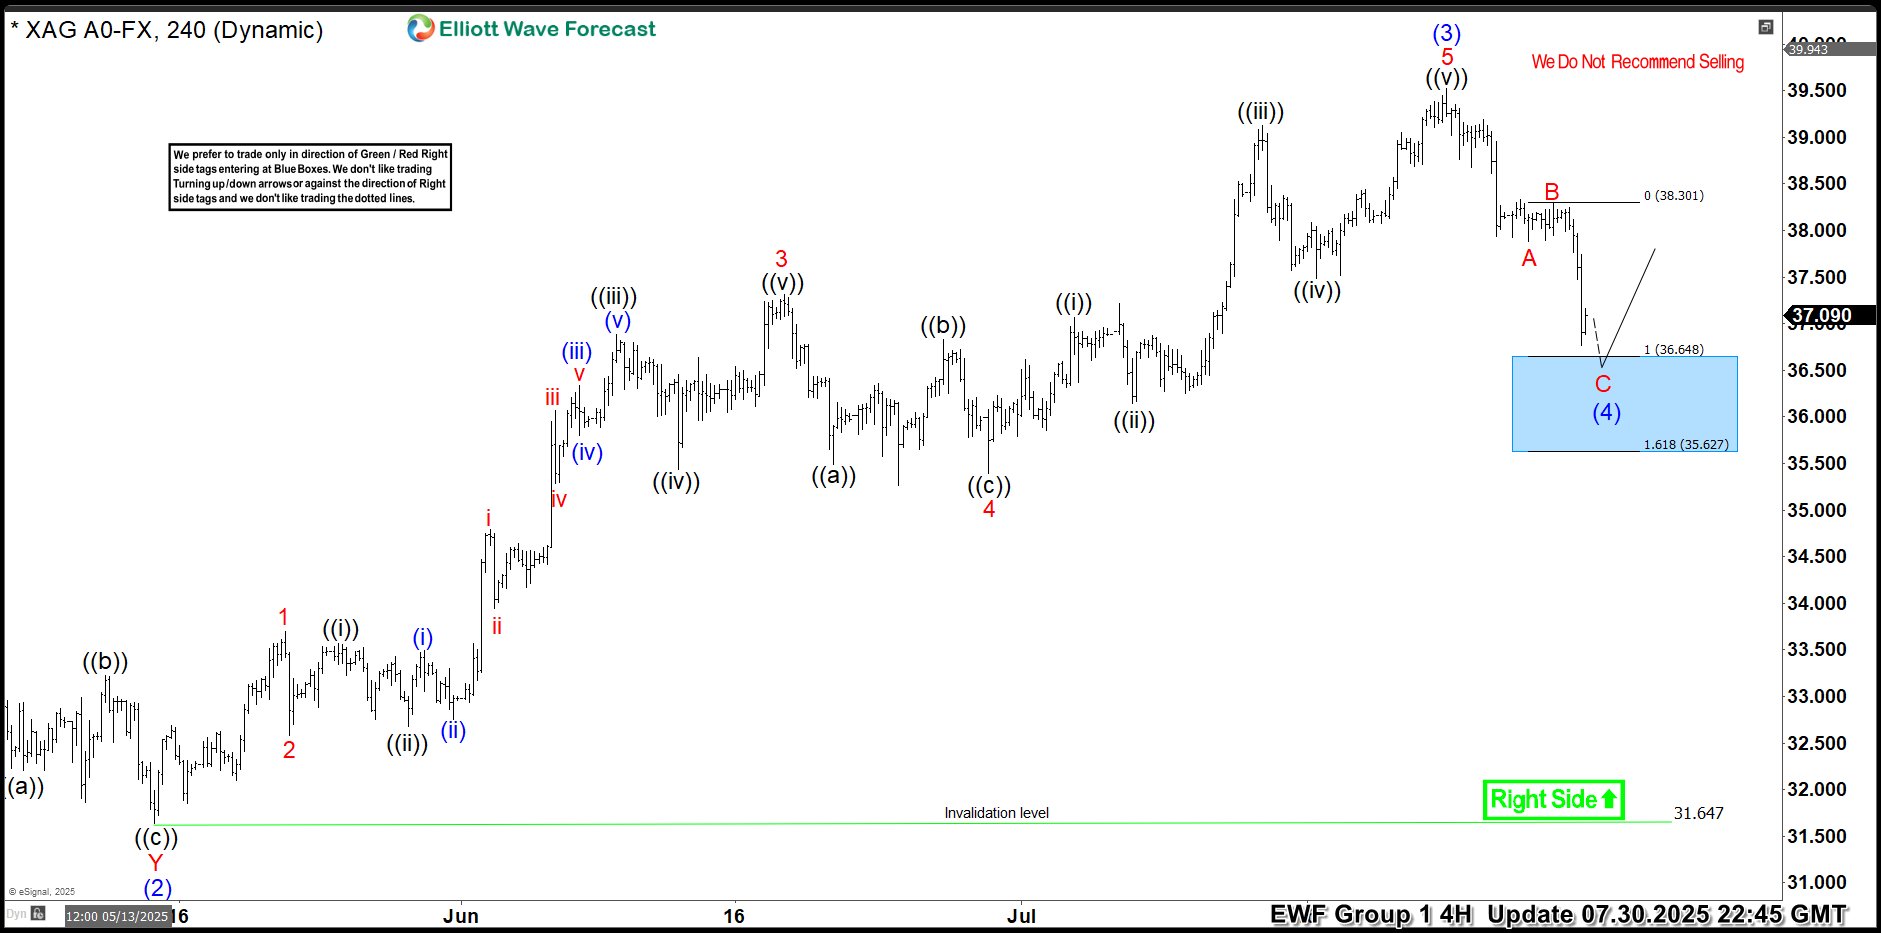
Hello traders. As our members know, we have had many profitable trading setups recently. In this technical article, we are going to talk about another Elliott Wave trading setup we got in Silver (XAGUSD). The commodity has completed its correction exactly at the Equal Legs zone, also known as the Blue Box Area. In this […]
-
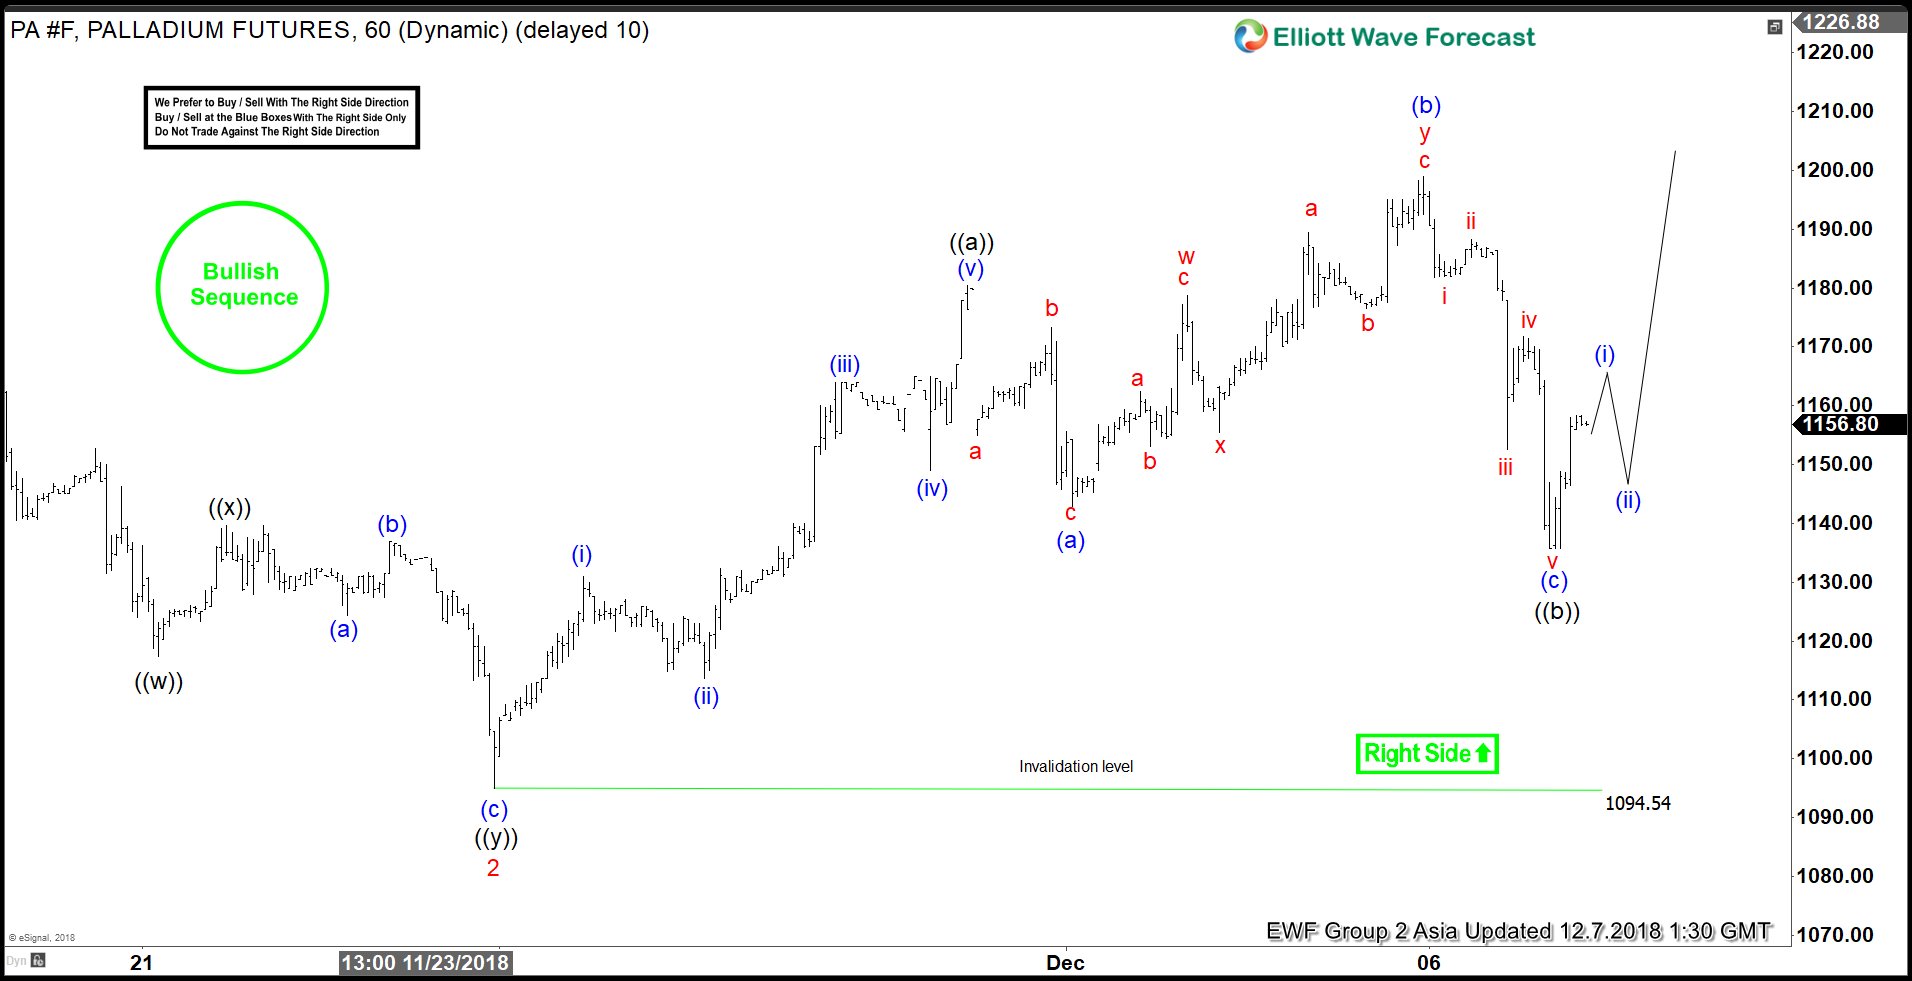
Elliott Wave Analysis: Palladium Extended Higher
Read MoreHere, we will look at past short-term Elliott Wave charts of Palladium’s (PA) price action presented to our members. Below, you can see the 1-hour updated chart posted on the 12/07/18 with our Elliot count perspective at the time. We expected prices to extend higher due to the 11/16 high broken on 11/29, hence our […]
-
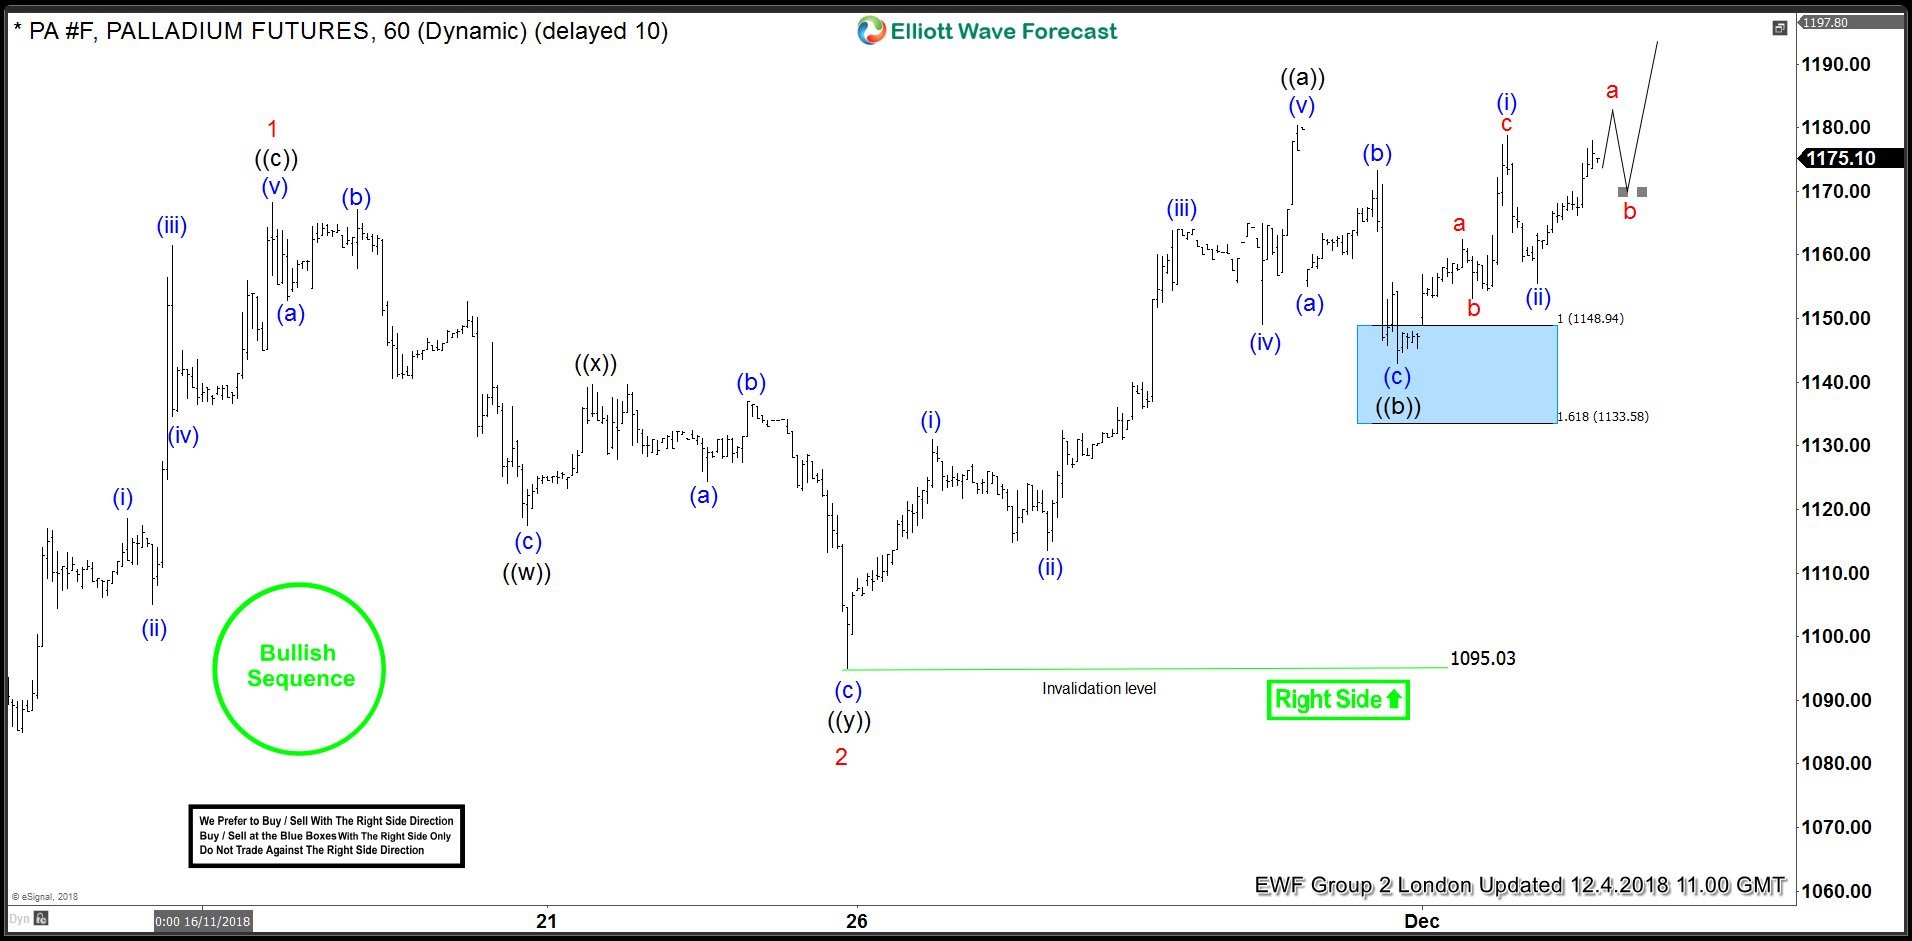
Palladium Elliott Wave Analysis: Forecasting And Buying The Rally
Read MoreIn this blog, I want to share some short-term Elliott Wave charts of Palladium which we presented to our members in the past. Below, you see the 1-hour updated chart presented to our clients on the 11/30/18 indicating that Amazon ended the cycle from 11/23 low (1094.70) in black wave ((a)) at 11/30 peak (1198.1). As Palladium […]
-
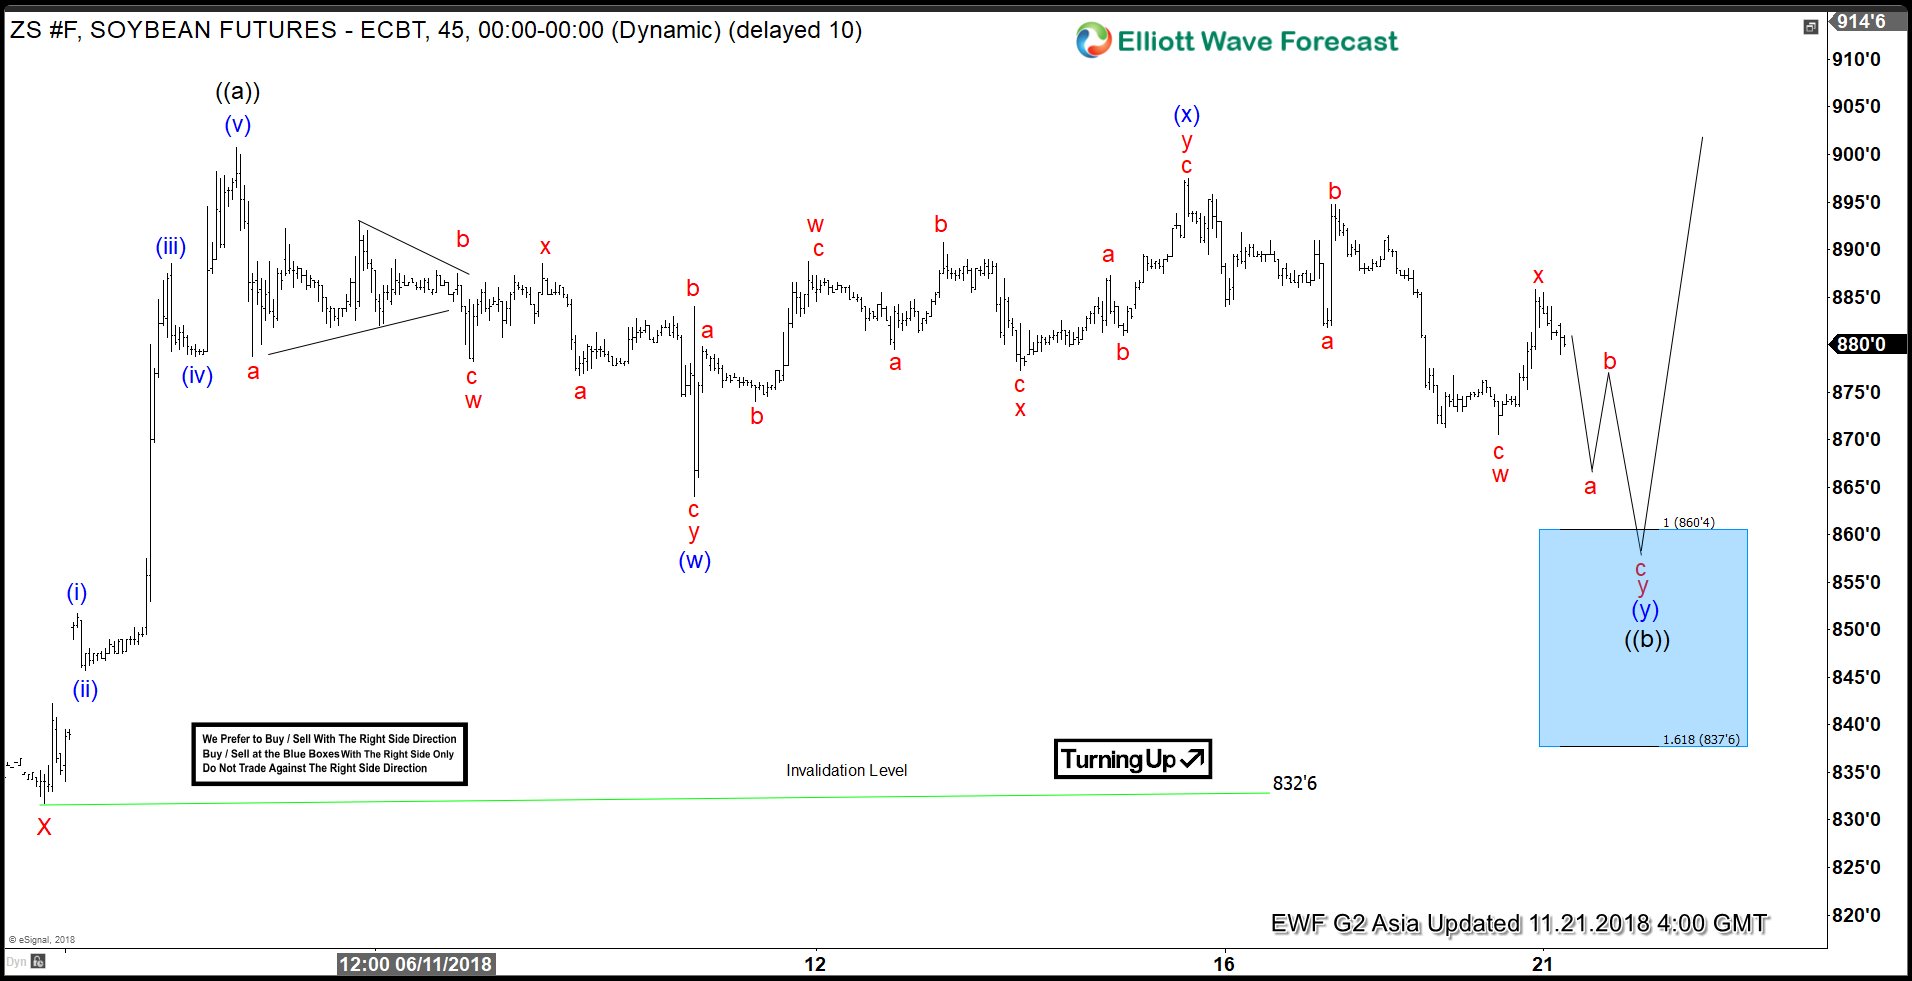
Soybean Reacted Higher From The Blue Box Area
Read MoreIn this technical blog, we are going to take a look at the past 1-hour performance of Soybean ticker symbol: ZS_F Elliott Wave charts that we presented to our clients. We are going to explain the structure and the forecast below. Soybean Elliott Wave 1 Hour Chart From November 21.2018 Above is the 1-hour Chart from 11/21/2018 […]
-
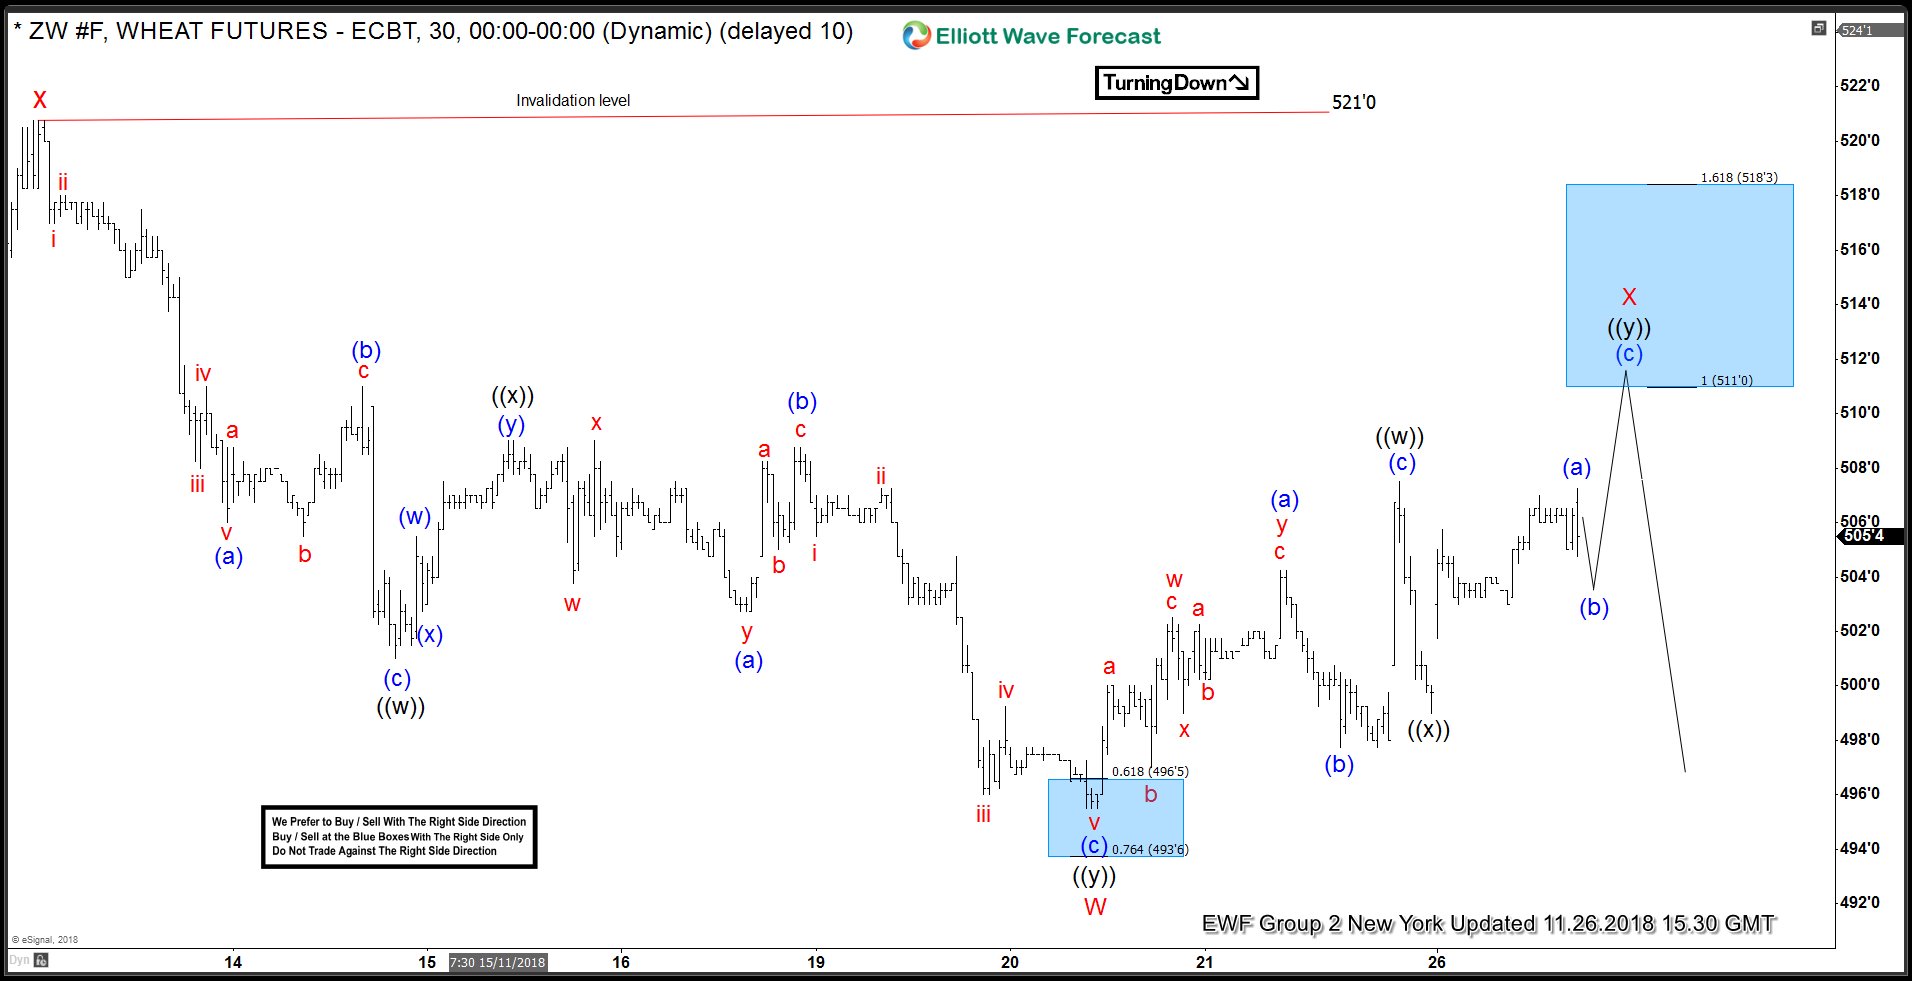
ZW #F Wheat Futures Reacted Lower from Blue Box
Read MoreHello fellow traders. In this technical blog we’re going to take a quick look at the Elliott Wave charts of Wheat Futures, published in members area of The Website. As we can see at the charts below, ZW #F is doing short term recovery against the 521’0 peak, labelled as wave X red . Proposed short […]
-
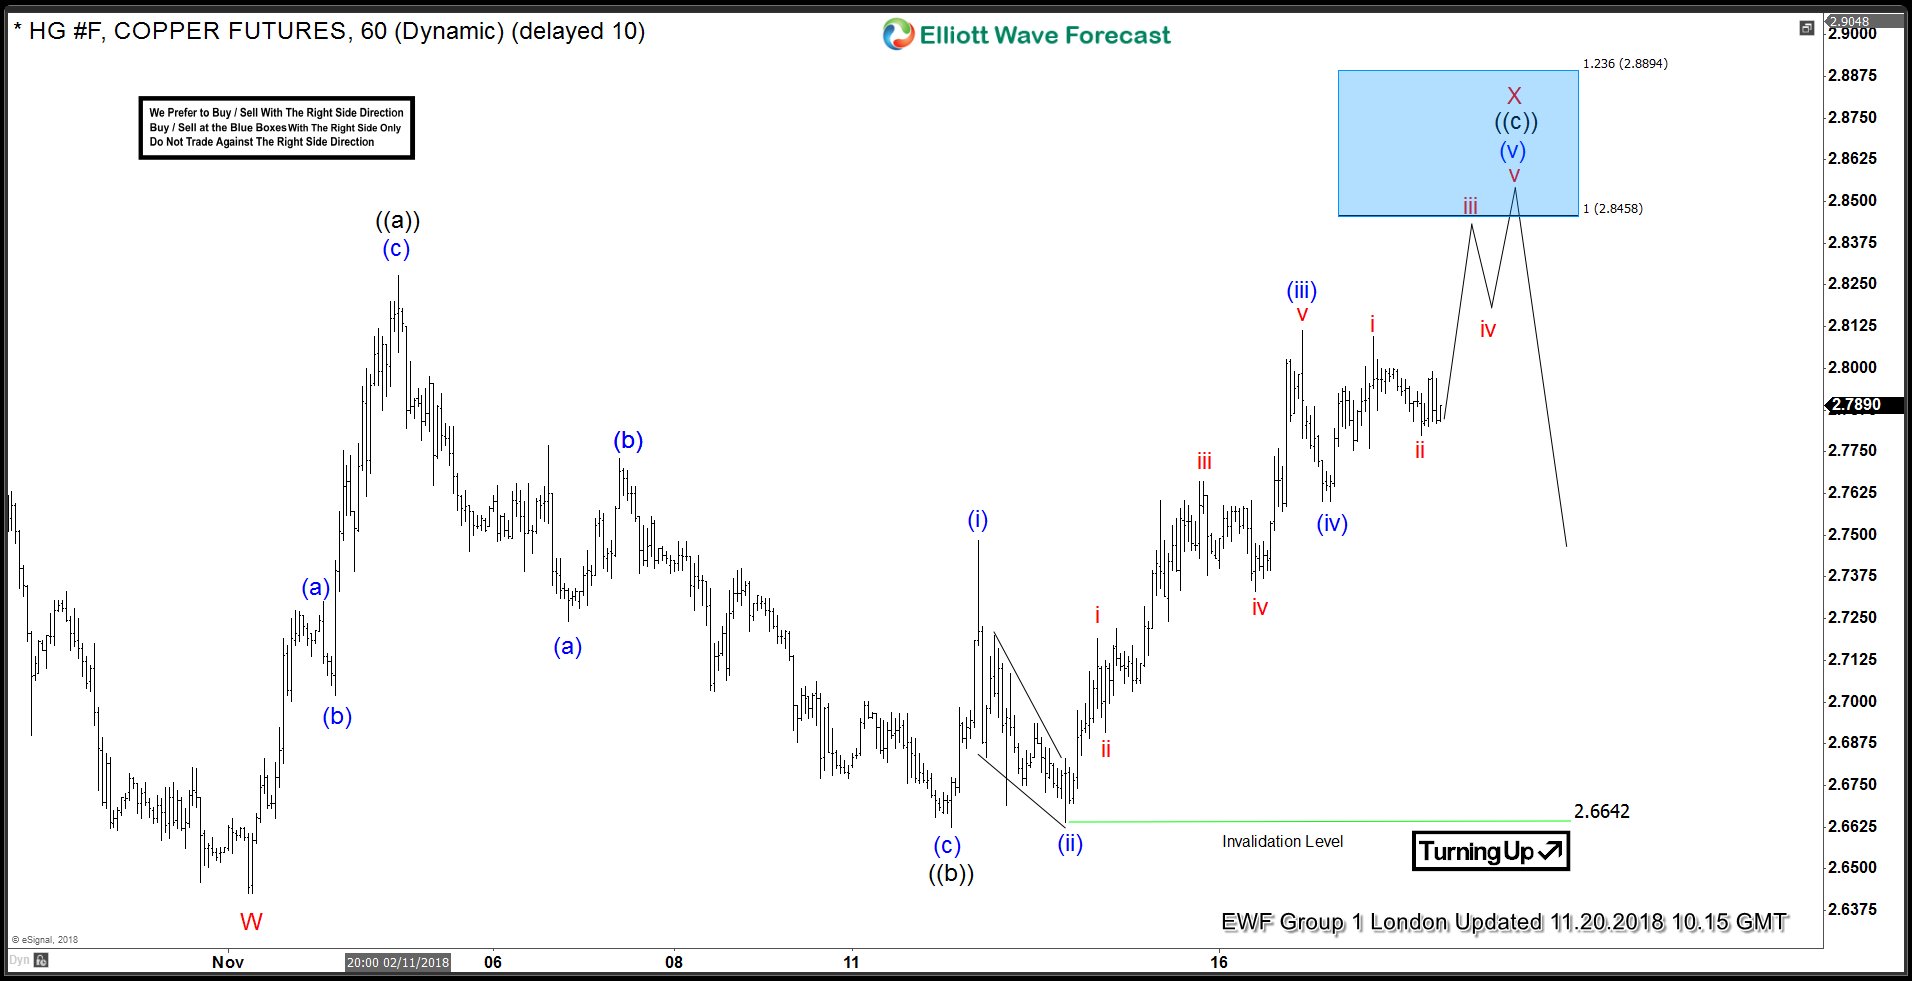
Copper Elliott Wave View: Found Sellers in Blue Box
Read MoreIn this blog, I want to share some short-term Elliott Wave charts of Copper which we presented to our members in the past. Below, you see the 1-hour updated chart presented to our clients on the 10/20/18 indicating that Copper ended the cycle from 09/21/18 peak in red wave W at 11/01/18 low (2.6435). As Copper ended the […]
-
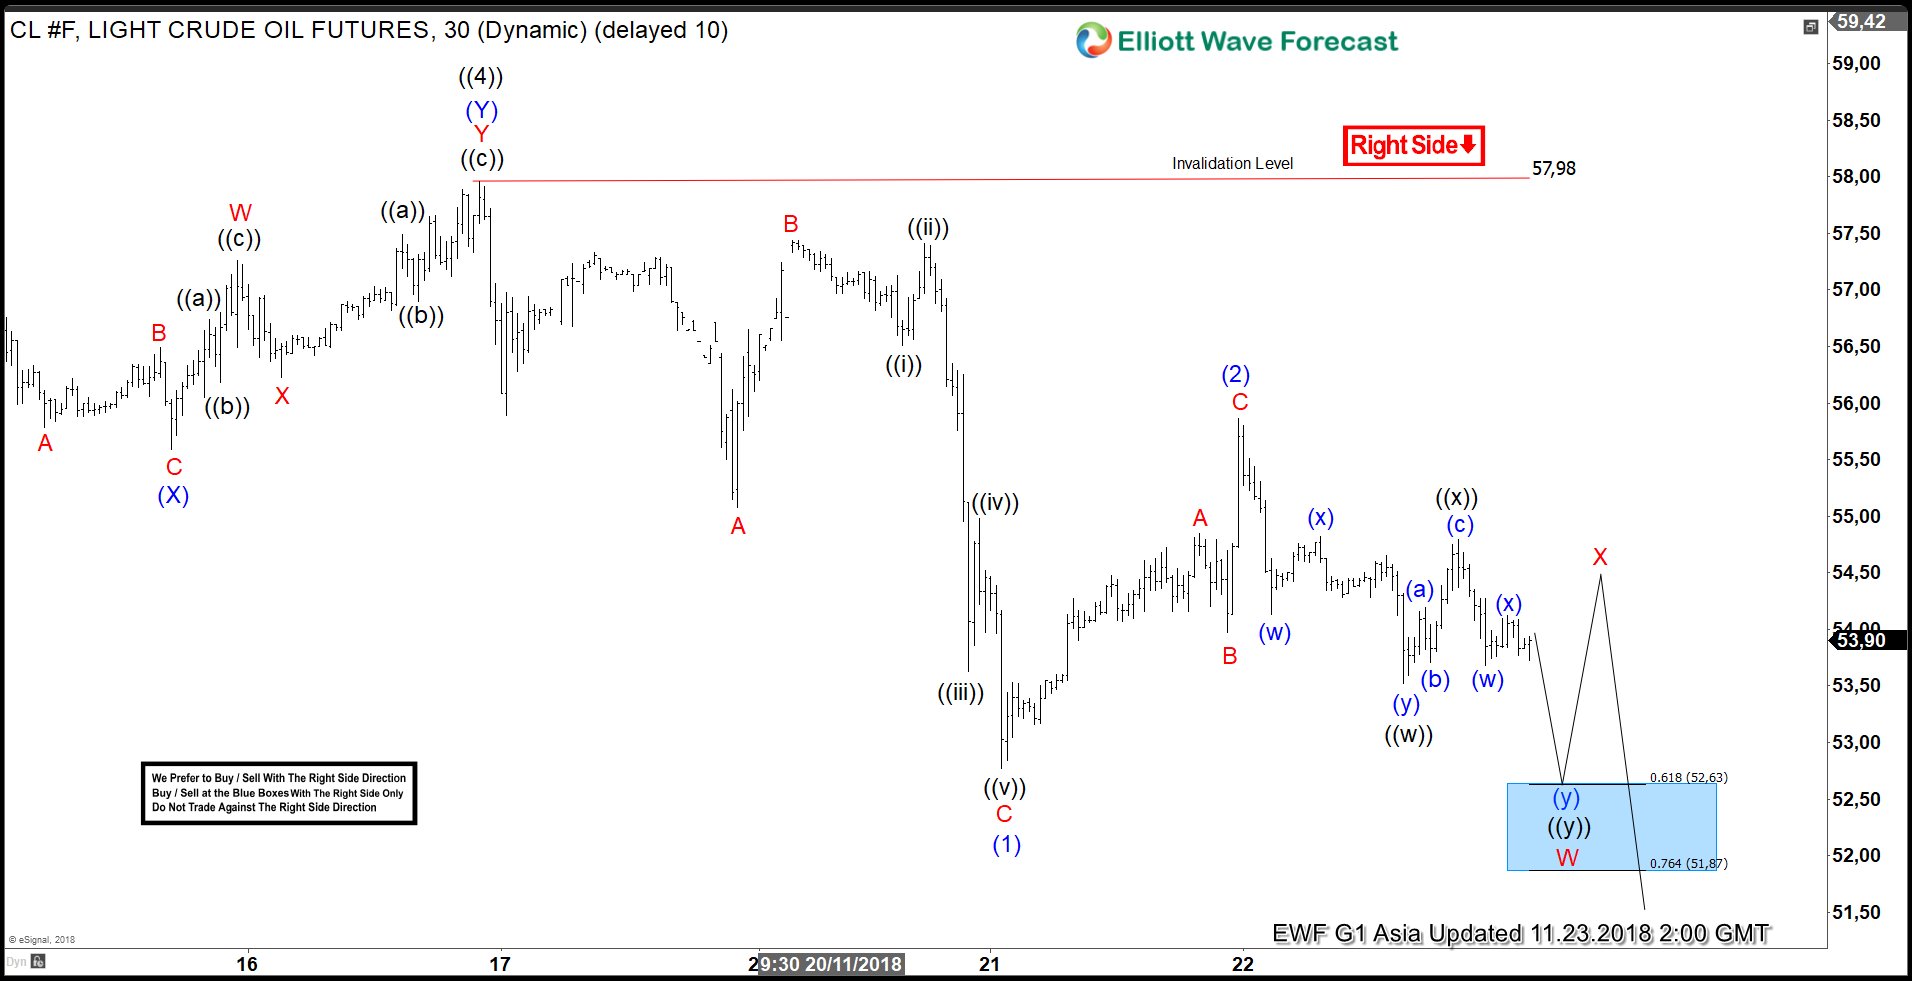
Elliott Wave Analysis: Further Downside Expected in Oil
Read MoreSince forming the high on Oct 3 at $76.9, Oil (CL_F) has dropped more than 30% in just less than 2 months. The move lower is pretty fast and short term Elliott Wave view suggests the decline is unfolding as an impulse Elliott Wave structure. Down from $76.9, Primary wave ((1)) ended at $68.47, Primary […]