
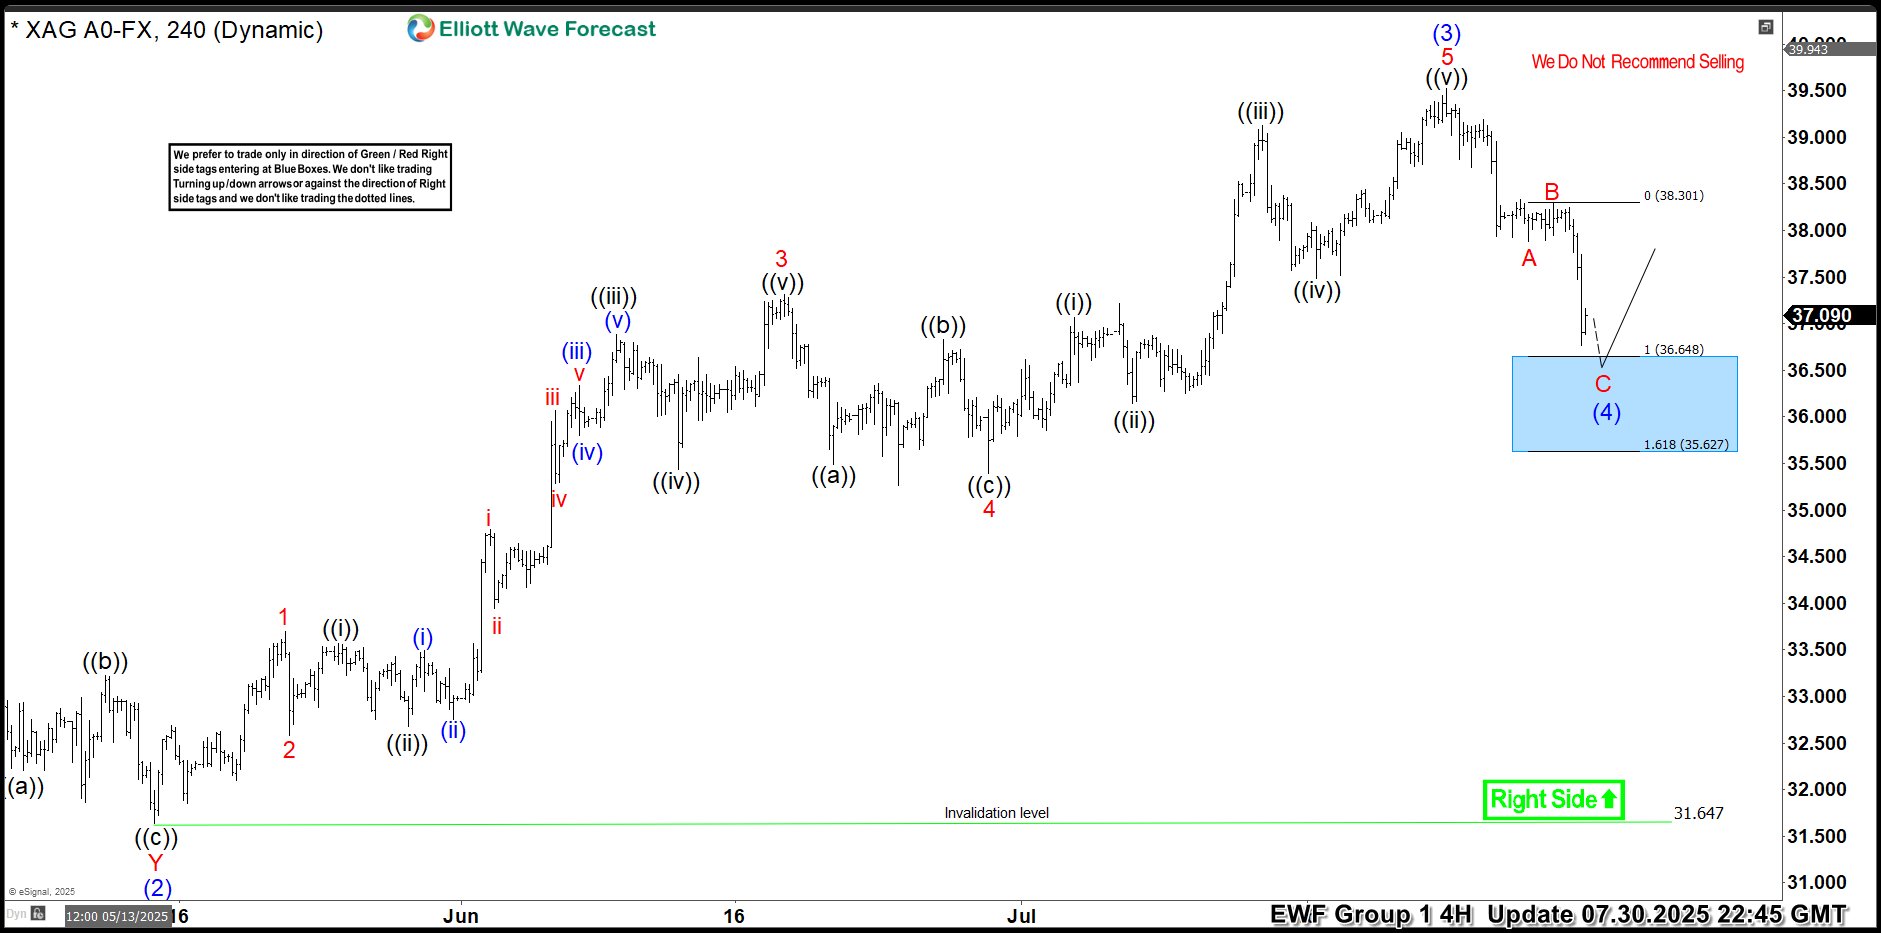
Hello traders. As our members know, we have had many profitable trading setups recently. In this technical article, we are going to talk about another Elliott Wave trading setup we got in Silver (XAGUSD). The commodity has completed its correction exactly at the Equal Legs zone, also known as the Blue Box Area. In this […]
-
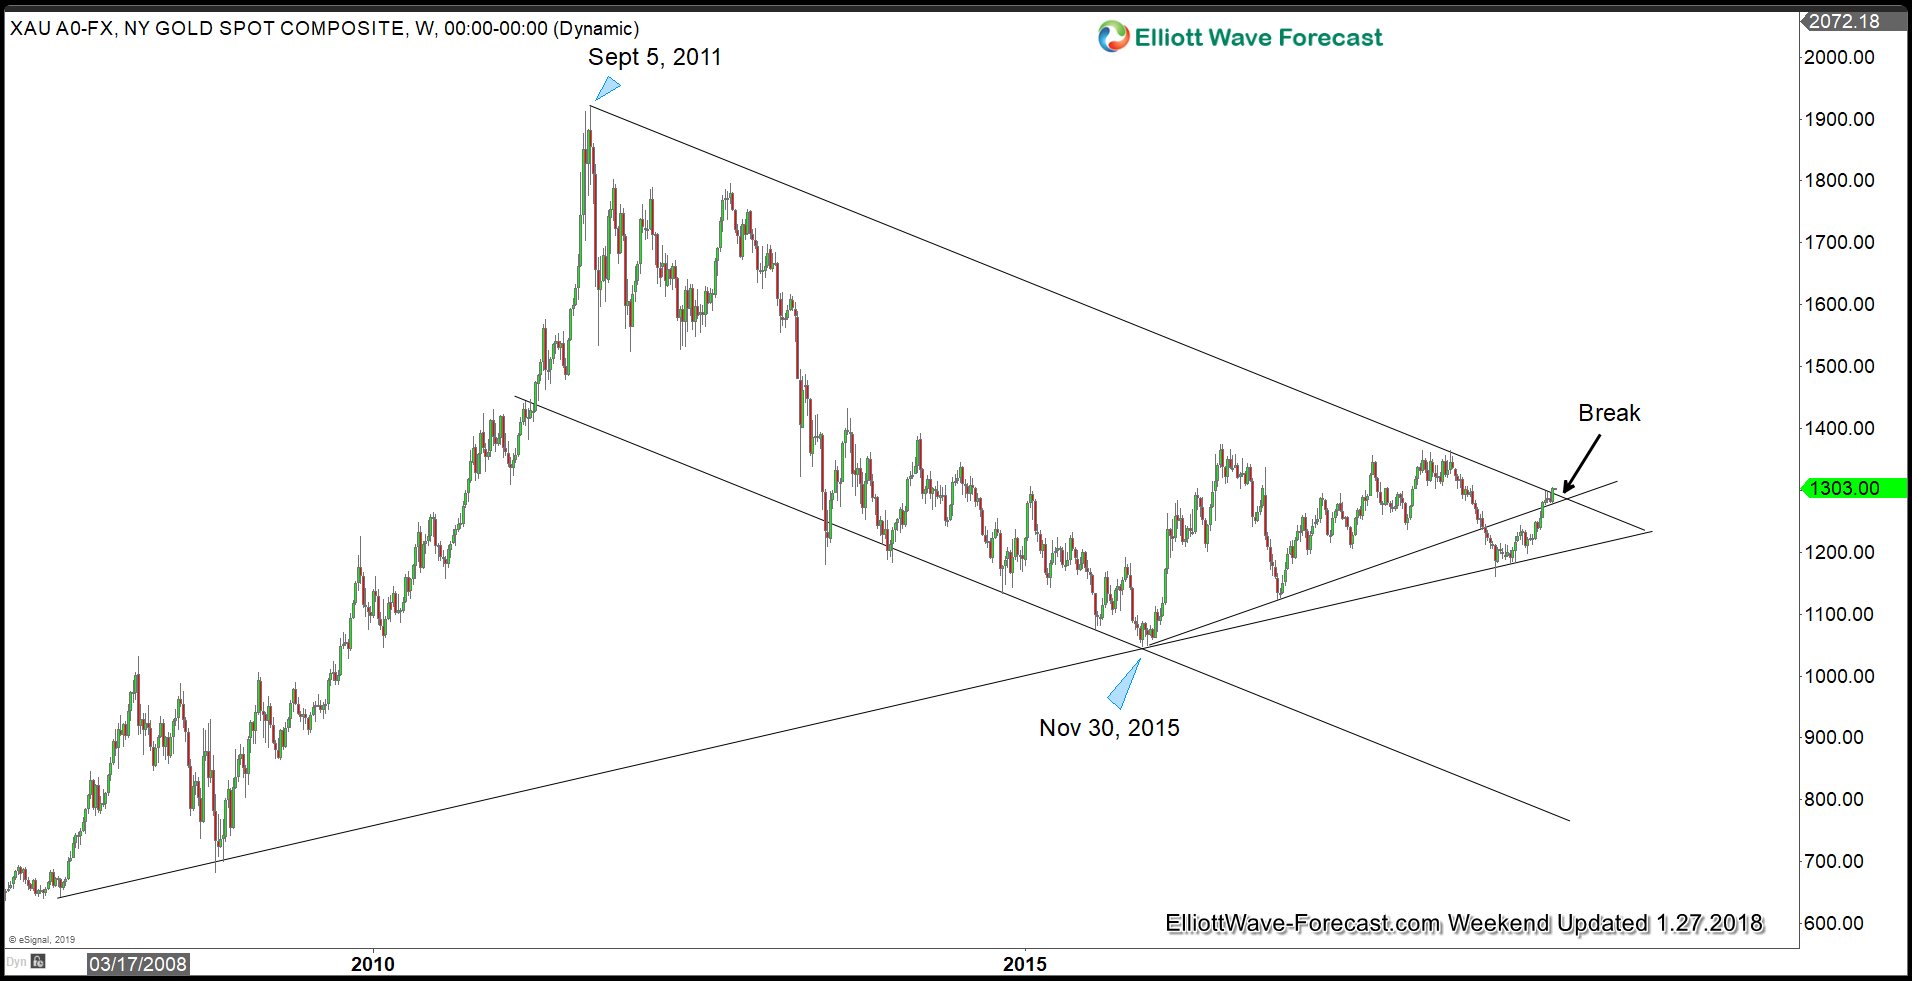
Break above $1300 in Gold Forms Elliott Wave Impulse
Read MoreThis article explains why the break above $1300 in Gold is important and suggests potential Impulsive move in the metal and next expected target
-
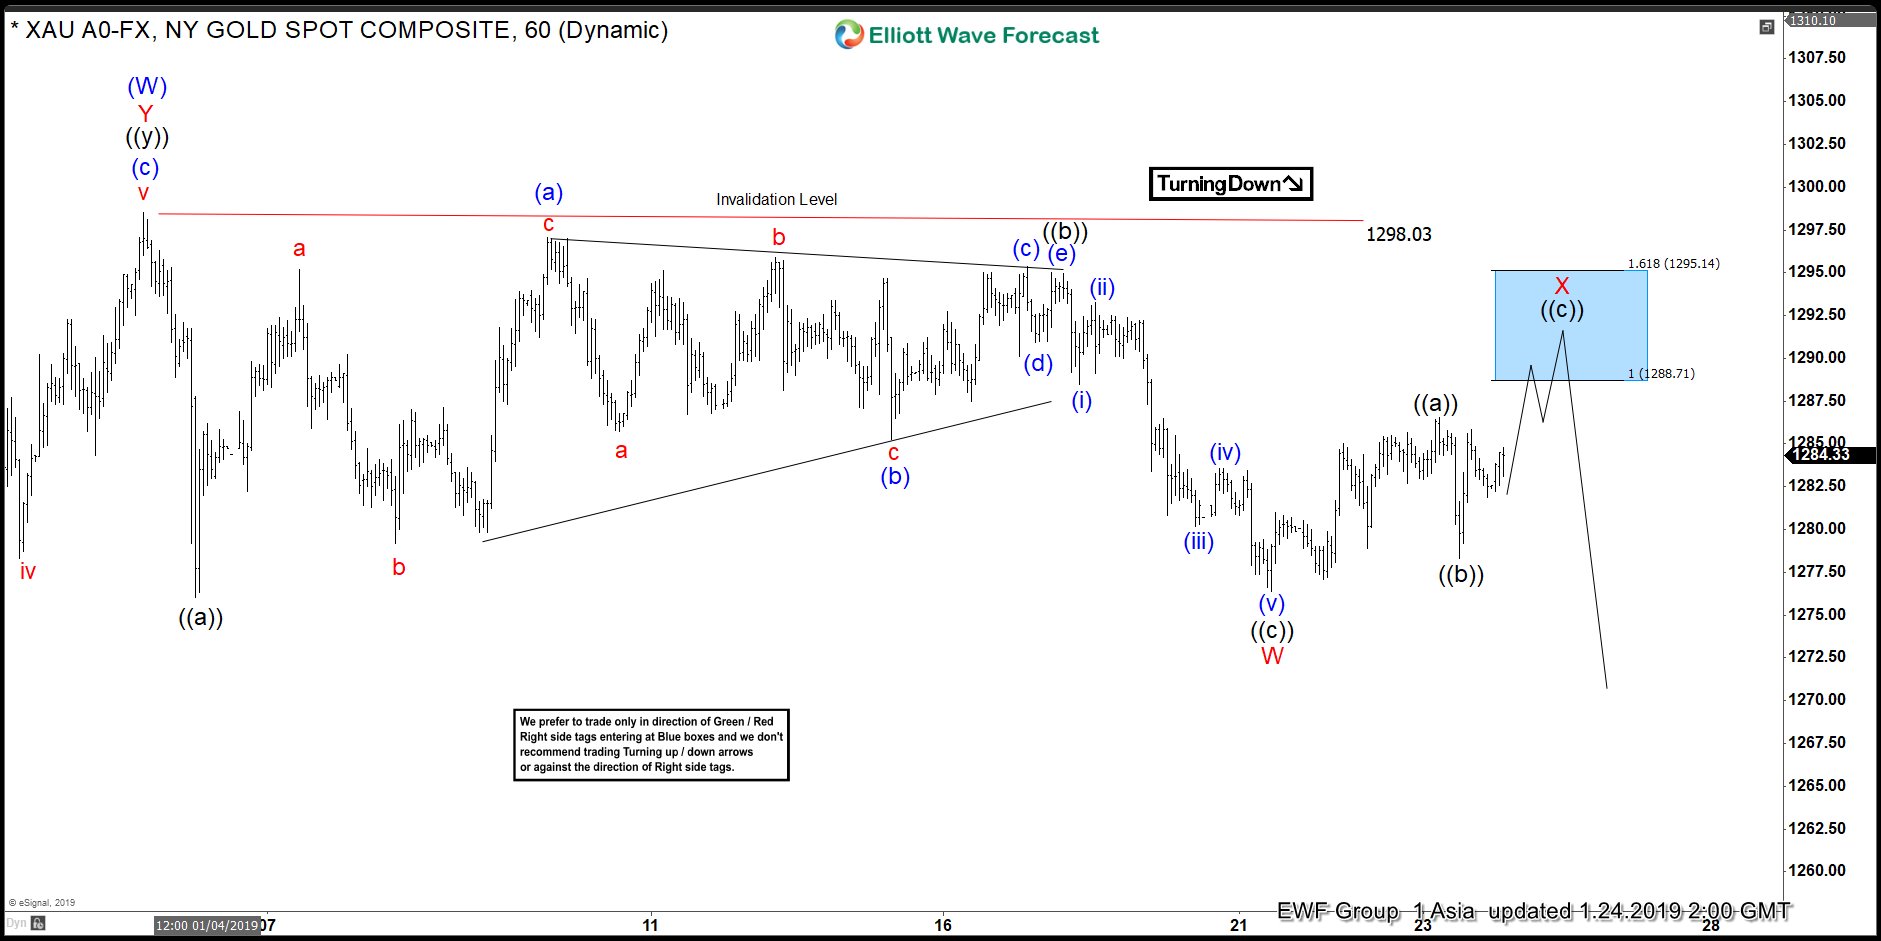
Elliott Wave View: Gold In Consolidation Before a Break Higher
Read MoreThis article and video explains the short term Elliott Wave path for Gold. The yellow metal can continue to consolidate while it fails to break pivot at Jan 4, 2019 high
-

Elliott Wave View Suggests Oil to See More Upside
Read MoreThis article & video explain the short term Elliott Wave path for Oil (CL_F) & also provide the alternate path. The right side is higher as long as invalidation level holds. The alternate path suggests Oil is correcting larger degree from 12/24/2018 low ($42.36).
-
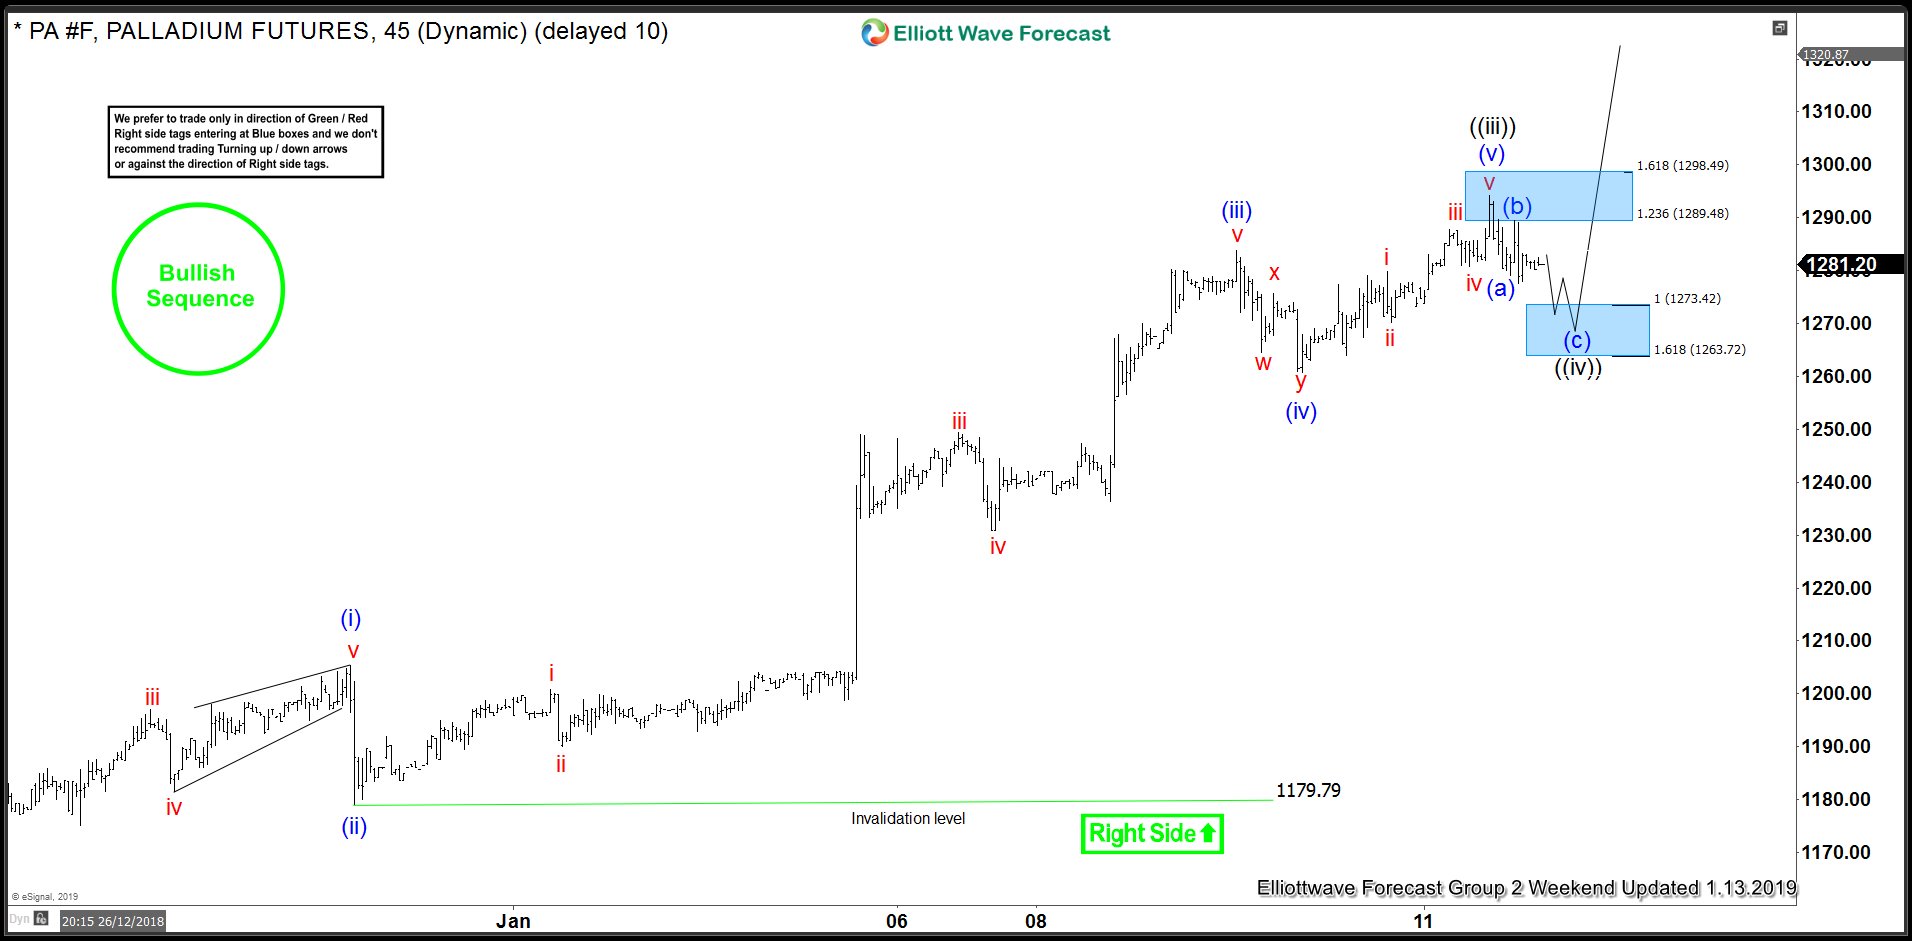
PALLADIUM Forecasting The Rally & Buying The Dips
Read MoreHello fellow traders. In this technical blog we’re going to take a quick look at the Elliott Wave charts of Palladium Futures, published in members area of the website. As our members know, the commodity has had incomplete bullish sequence in the cycle from 1056.56 low. The Elliott wave structure had been calling for further […]
-
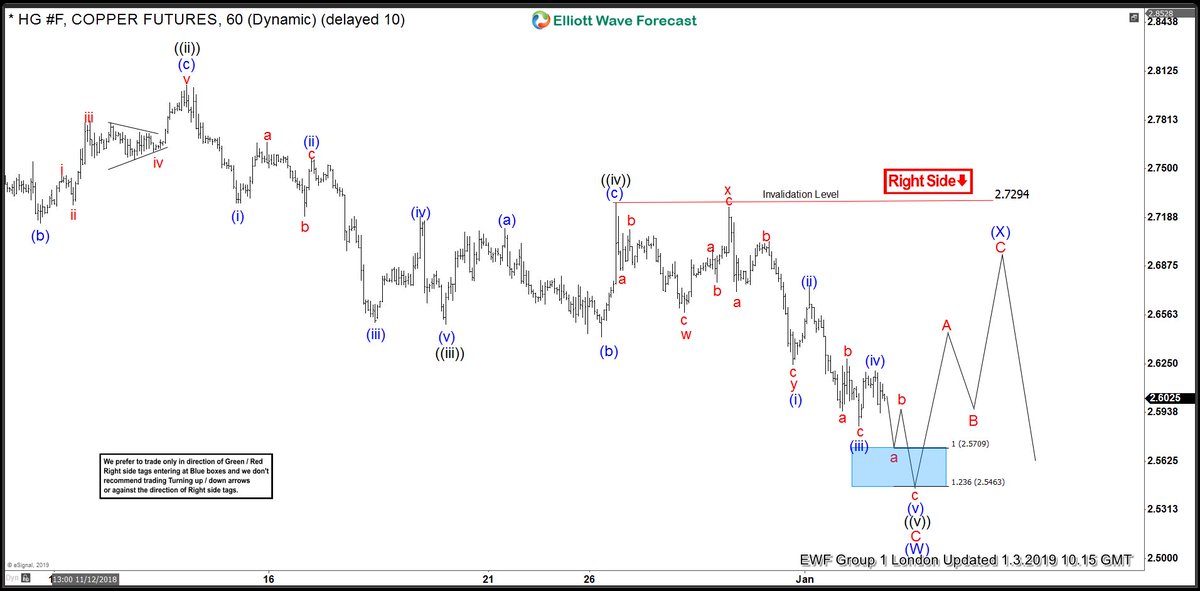
Copper Providing Another Elliott Wave Selling Opportunity Soon?
Read MoreIn this technical blog, we are going to cover past performance as well as some recent 1 hour Elliott Wave Charts of Copper, that we presented to our clients. We are going to explain the structure and the forecast below. Copper 1 Hour Elliott Wave Chart From 12/29/2018 Above is the 1 Hour Chart from […]
-
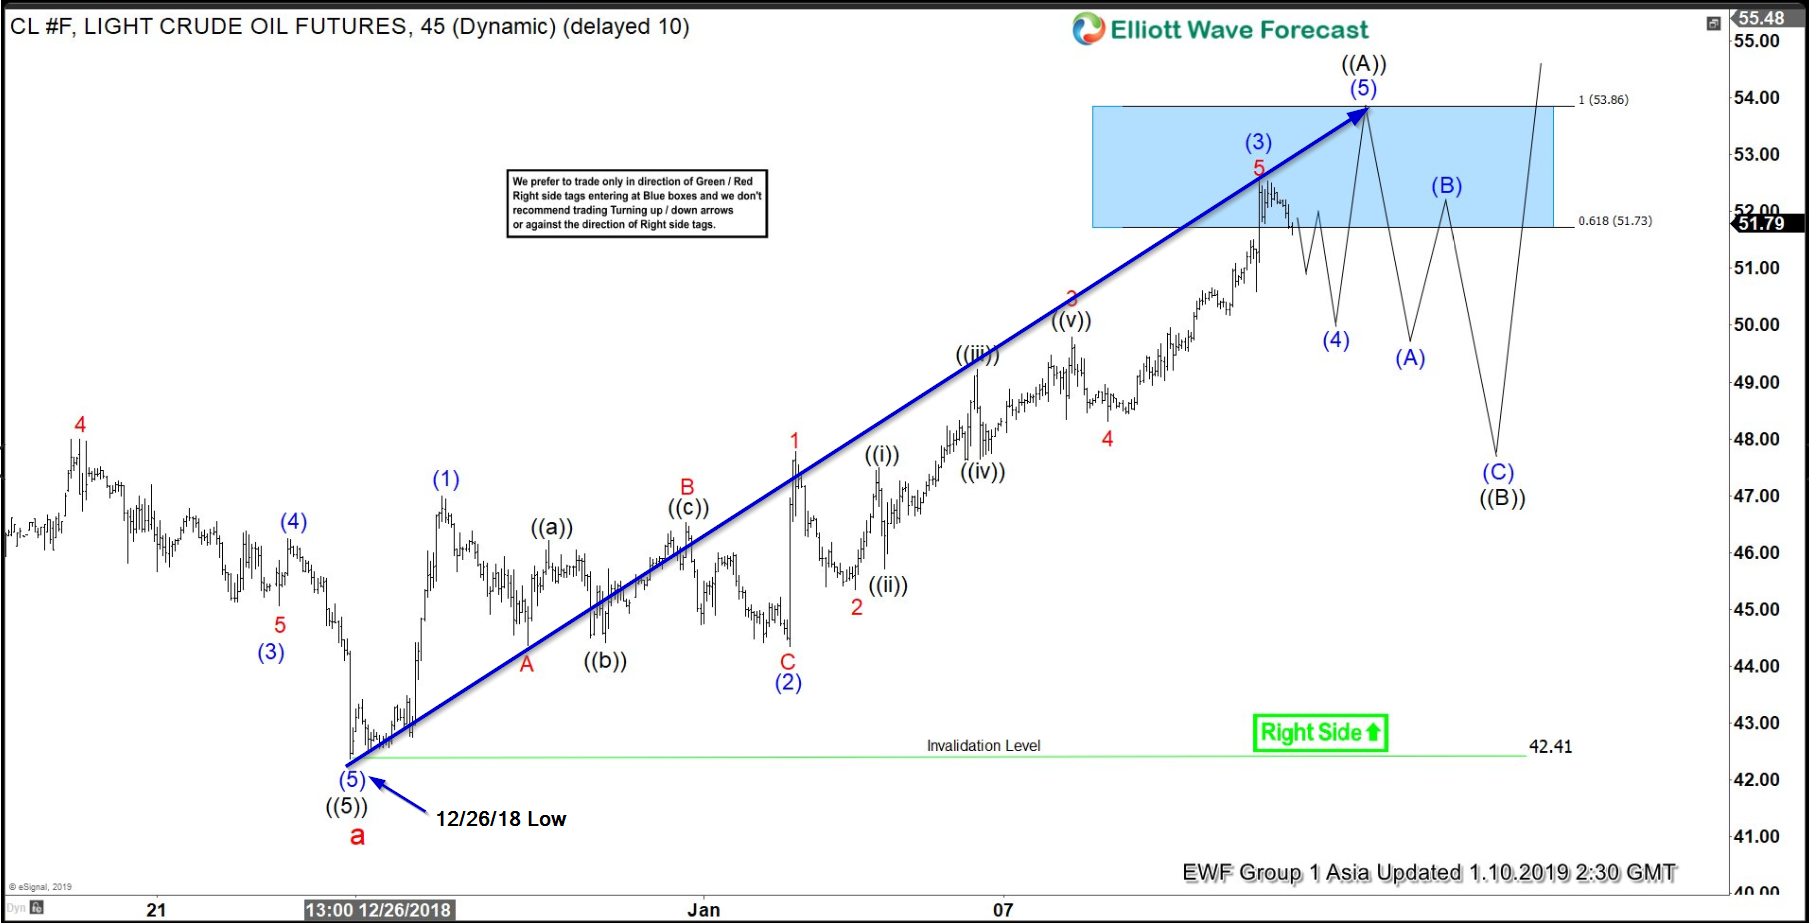
Elliott Wave Analysis: Further Strength Expected in Oil
Read MoreIn this blog, I want to share with you some Elliott Wave charts of Oil which we presented to our members at Elliott Wave Forecast. You see the 1-hour updated chart presented to our clients on the 01/10/19. Oil ended the cycle from 10/03/18 peak in red wave a at 12/26/18 low (42.41). Above from there, we expect […]