
Hello traders. As our members know, we have had many profitable trading setups recently. In this technical article, we are going to talk about another Elliott Wave trading setup we got in Silver (XAGUSD). The commodity has completed its correction exactly at the Equal Legs zone, also known as the Blue Box Area. In this […]
-
Brent Crude (BZ) Oil Signals Bottom, Advances Higher
Read MoreBrent Crude Oil (BZ) is a major global benchmark for crude oil pricing, primarily sourced from the North Sea between the United Kingdom and Norway. It is a light, sweet crude oil, characterized by a low sulfur content (sweet) and low density (light), making it ideal for refining into gasoline and diesel. Brent Crude is […]
-
Elliott Wave Analysis: Silver (XAGUSD) Nears Key Support Zone
Read MoreSilver (XAGUSD) broke to new 13 year high reinforcing bullish outlook. This article and video look at the Elliott Wave path of the metal.
-
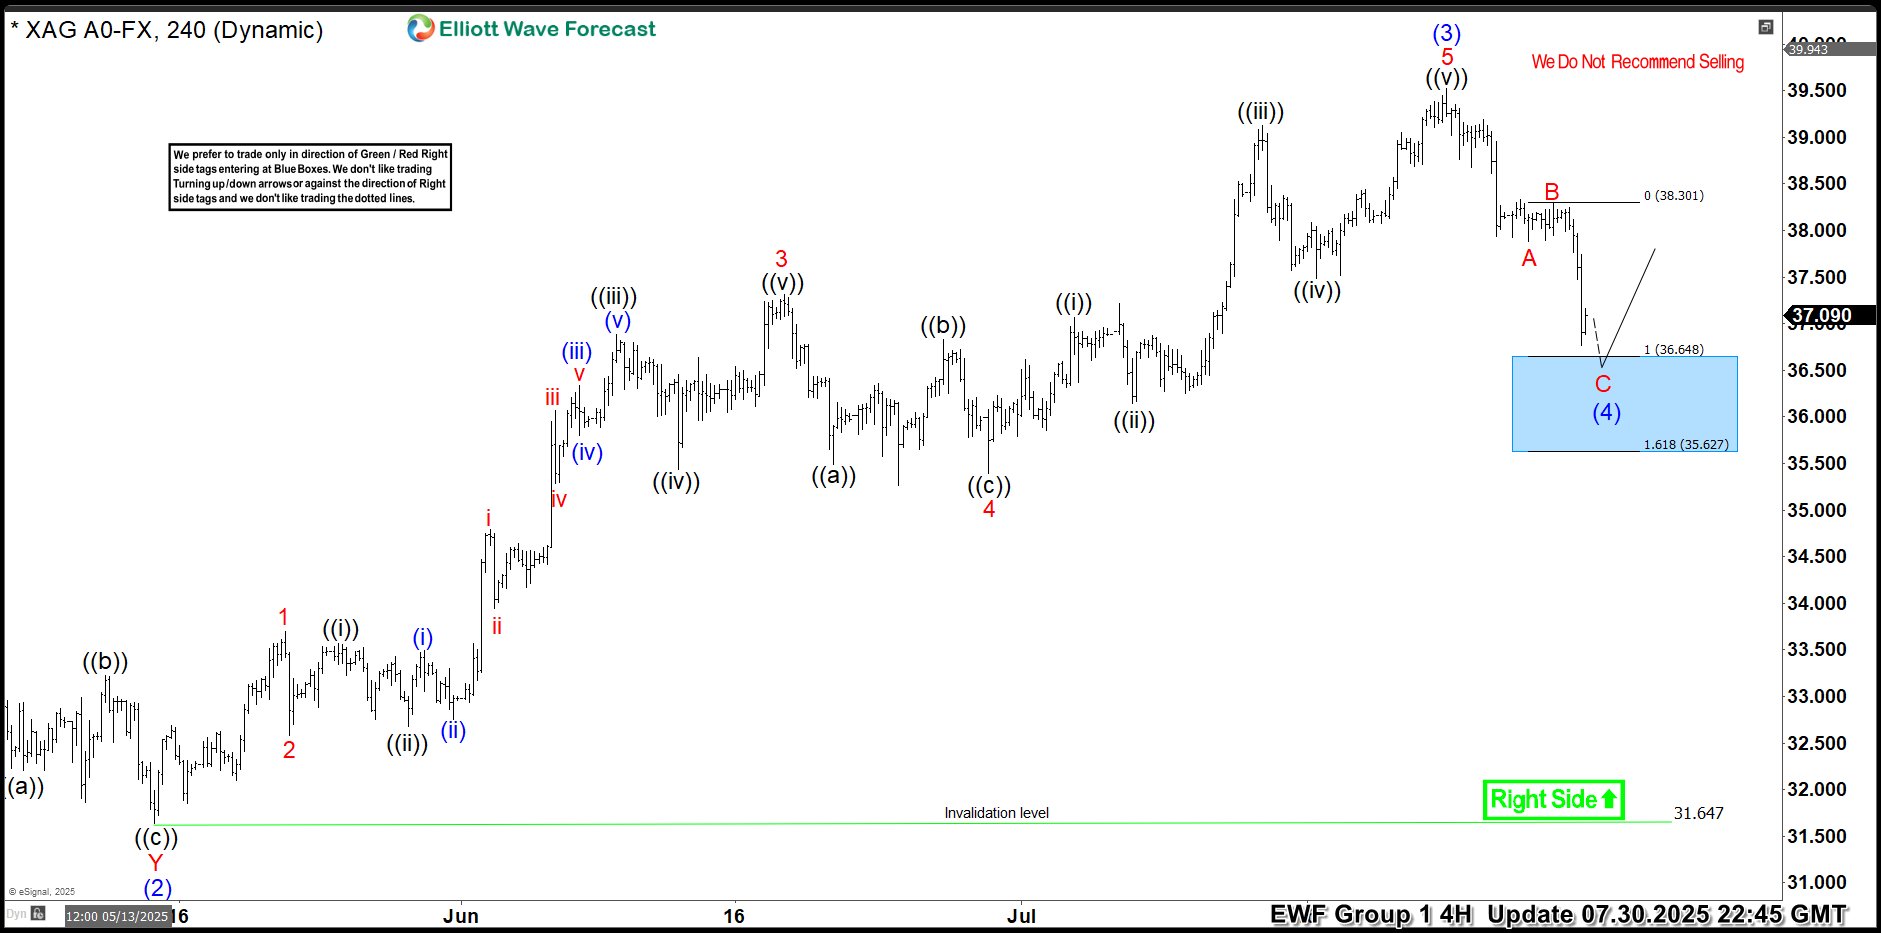
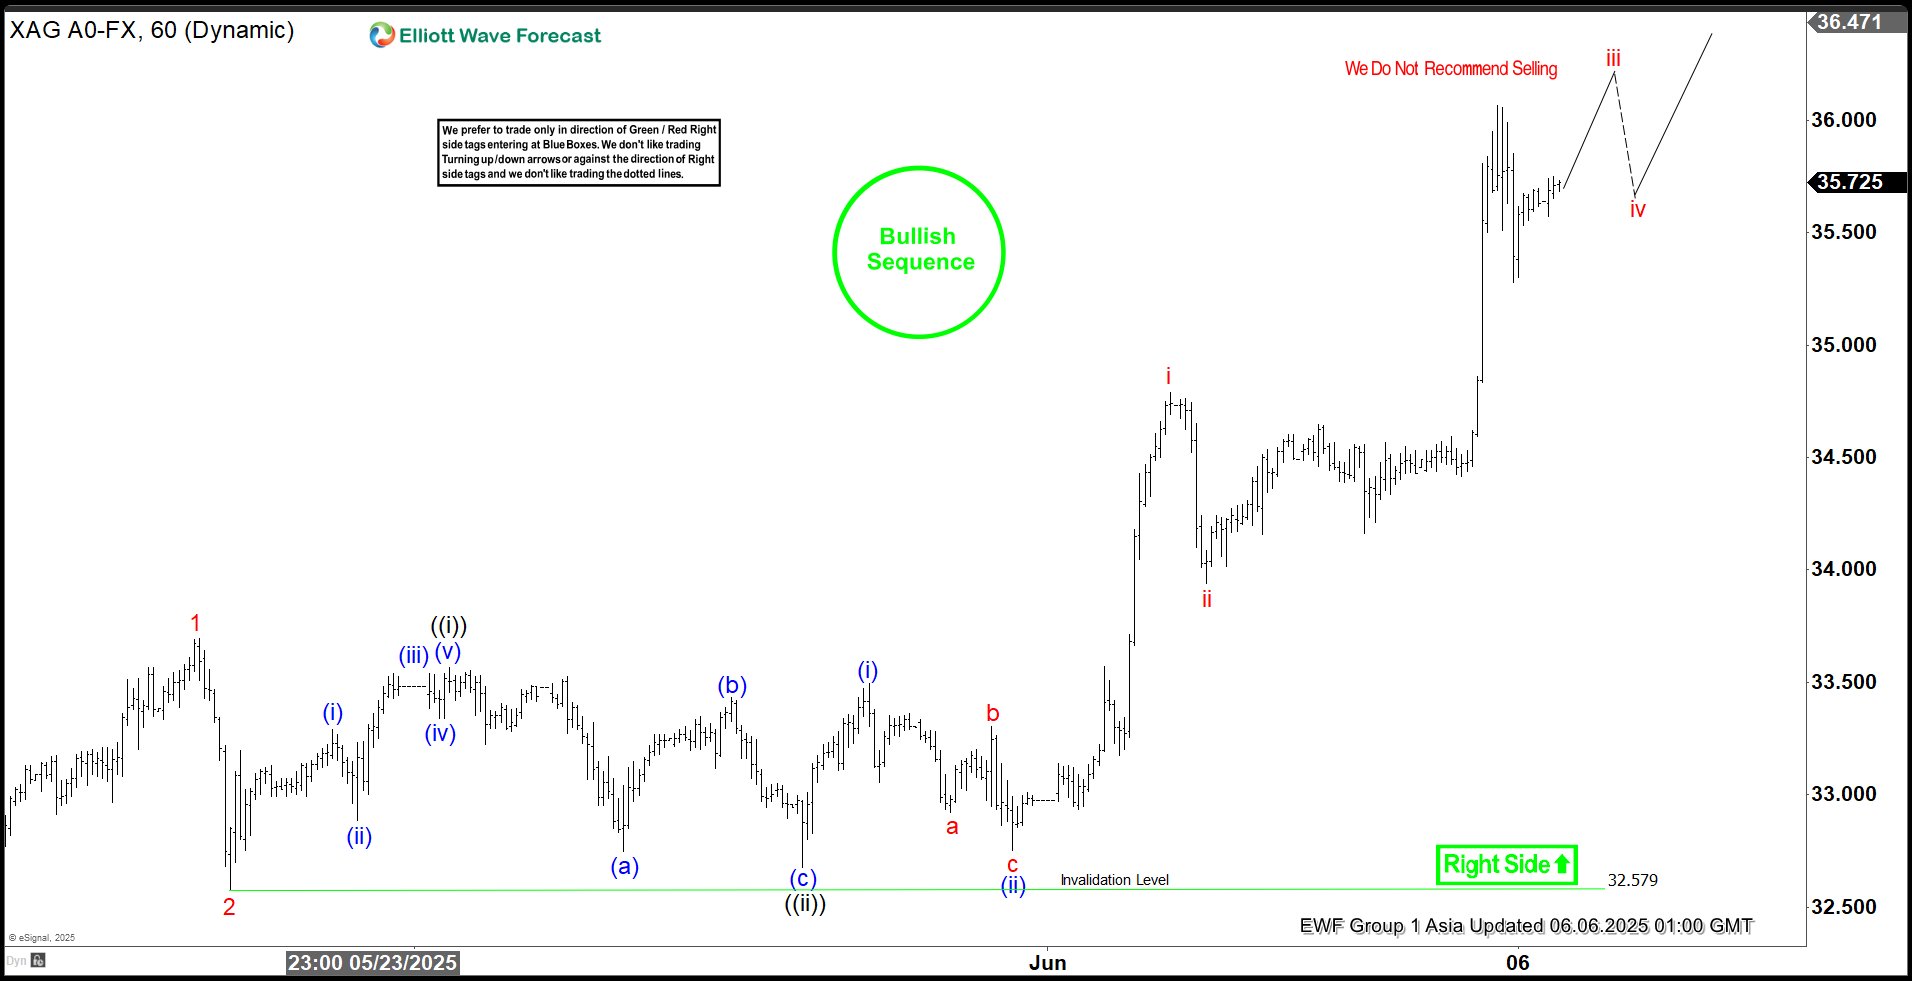
Silver (XAGUSD) Elliott Wave : Intraday Blue Box Buying Opportunity
Read MoreHello traders. As our members know, we have had many profitable trading setups recently. In this technical article, we are going to talk about another Elliott Wave trading setup we got in Silver (XAGUSD). The commodity has completed its correction exactly at the Equal Legs zone, also known as the Blue Box Area. In this […]
-
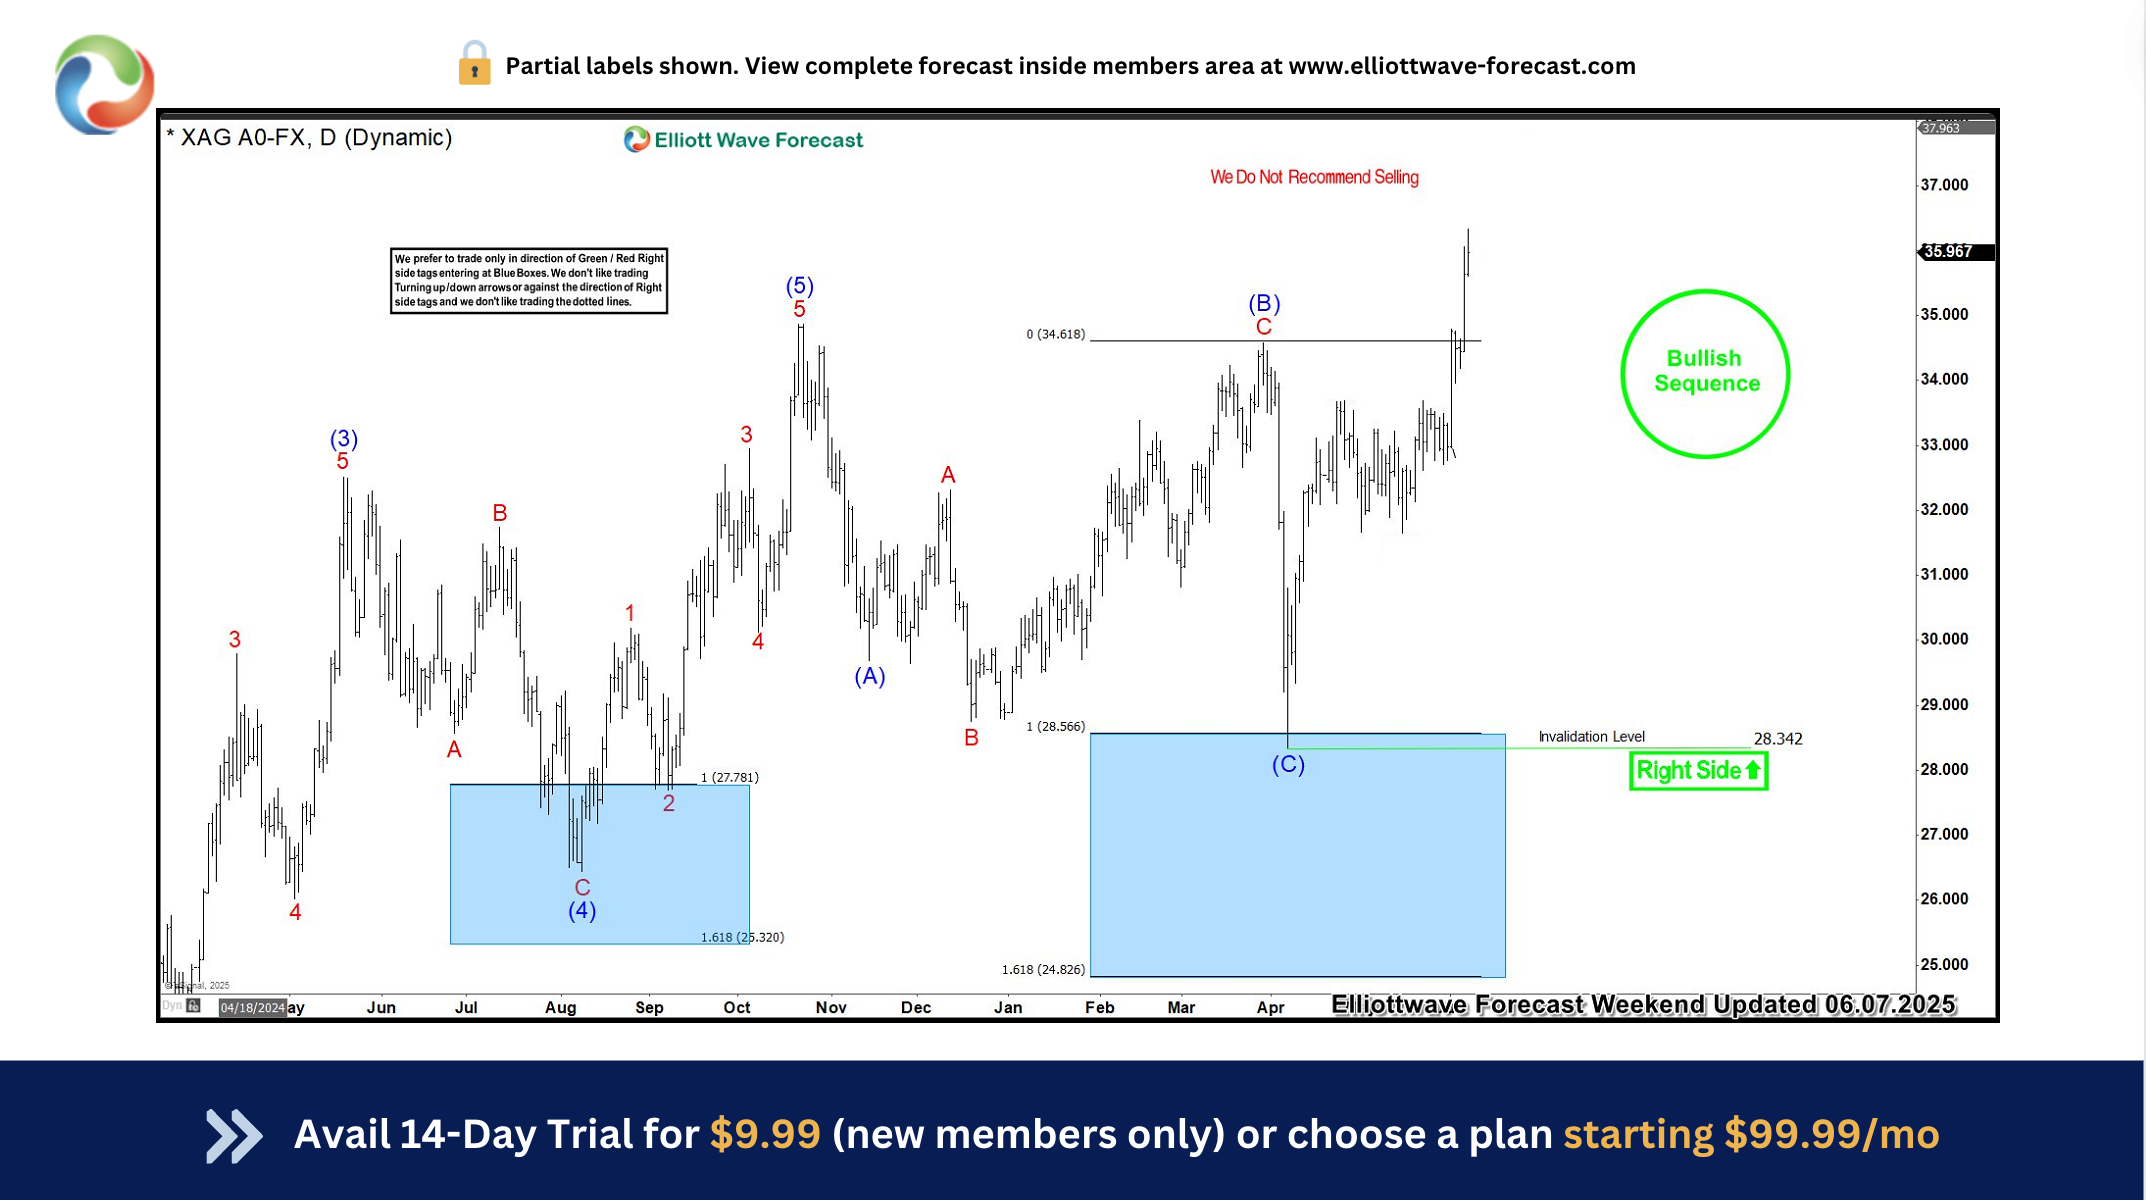
Silver (XAGUSD) Rallies 29% Following April Blue Box Buy Zone
Read MoreHello traders and welcome to another blue box post where we discuss trade setups. In this post, the spotlight will be on Silver amid the recent big break to the upside that might have taken many by surprise. Silver surprised many market participants when it breached its 2024 highs. The commodity has been one of […]
-
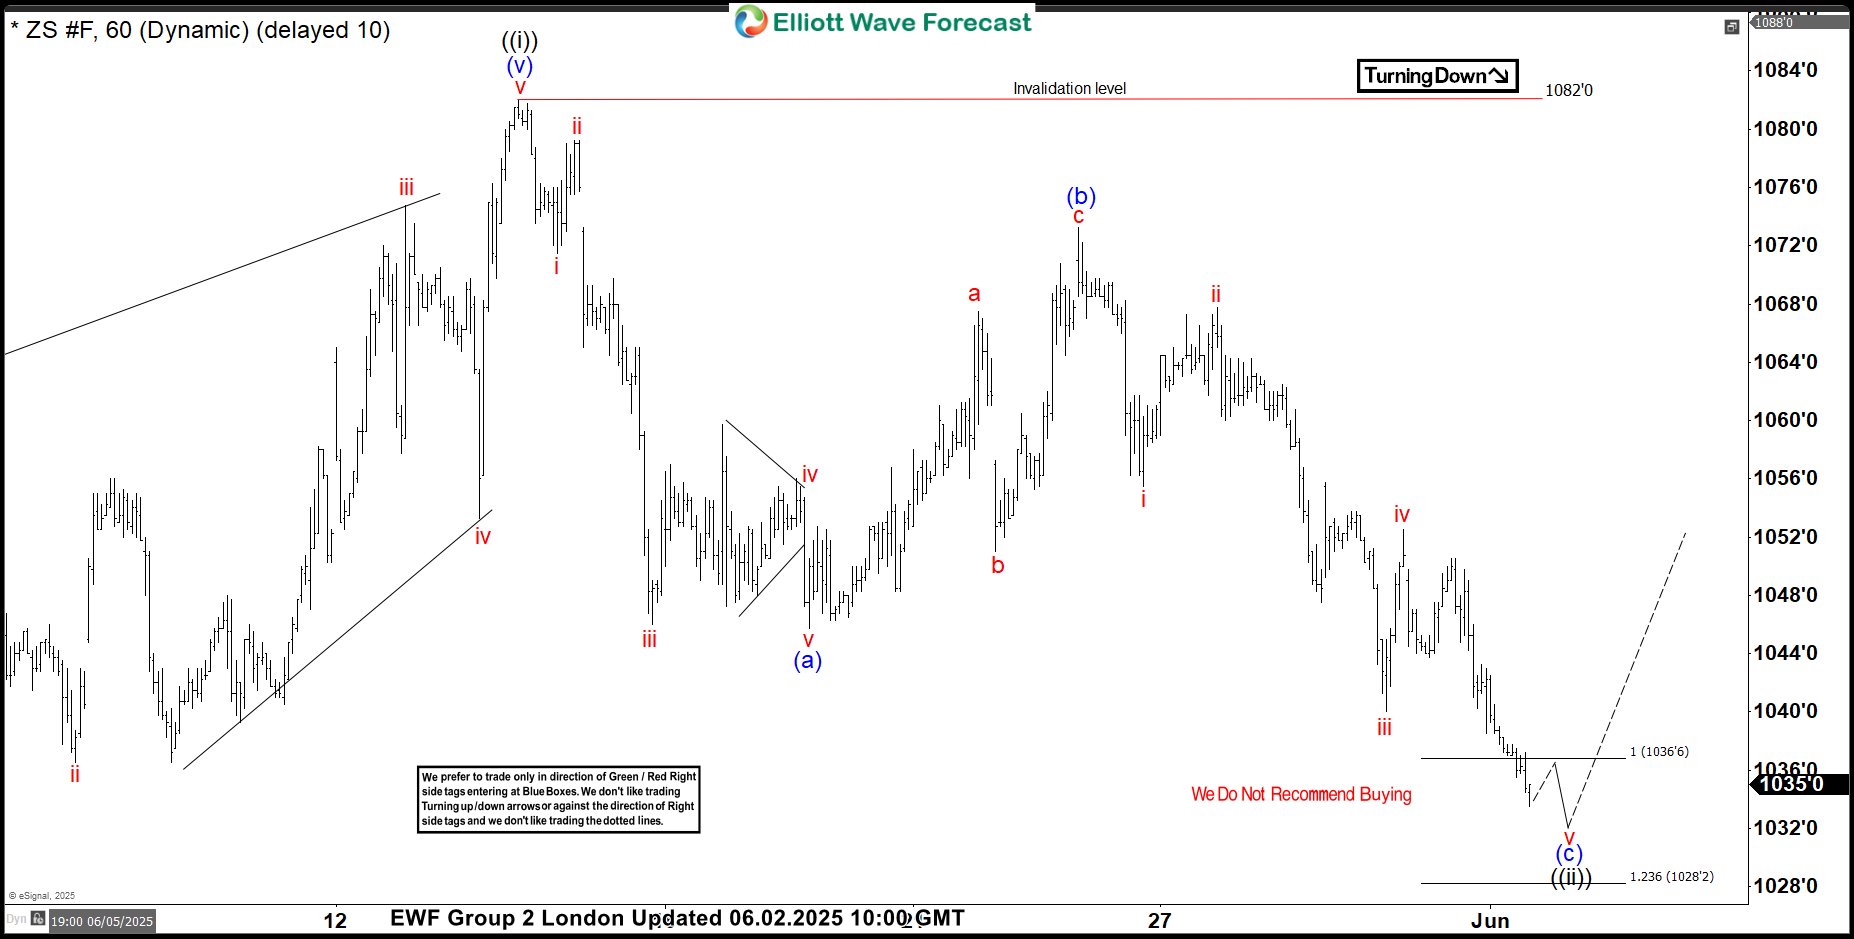
Soybeans (ZS_F) Forecasting the Rally After Elliott Wave Zig Zag Pattern
Read MoreHello fellow traders, In this technical article, we are going to present Elliott Wave charts of Soybeans commodity ZS_F . Recently ,the commodity completed its intraday Zig Zag correction at the Equal Legs zone. In the following sections, we will explain the Elliott Wave count. Before we take a look at the real market example, let’s […]
-
Elliott Wave Update: Silver (XAGUSD) Breaks Out – What’s the Paths Forward?
Read MoreSilver (XAGUSD) has a breakout and it surpassed the previous peak on October 2024. This article & video discuss what’s the Elliott Wave path forward.