
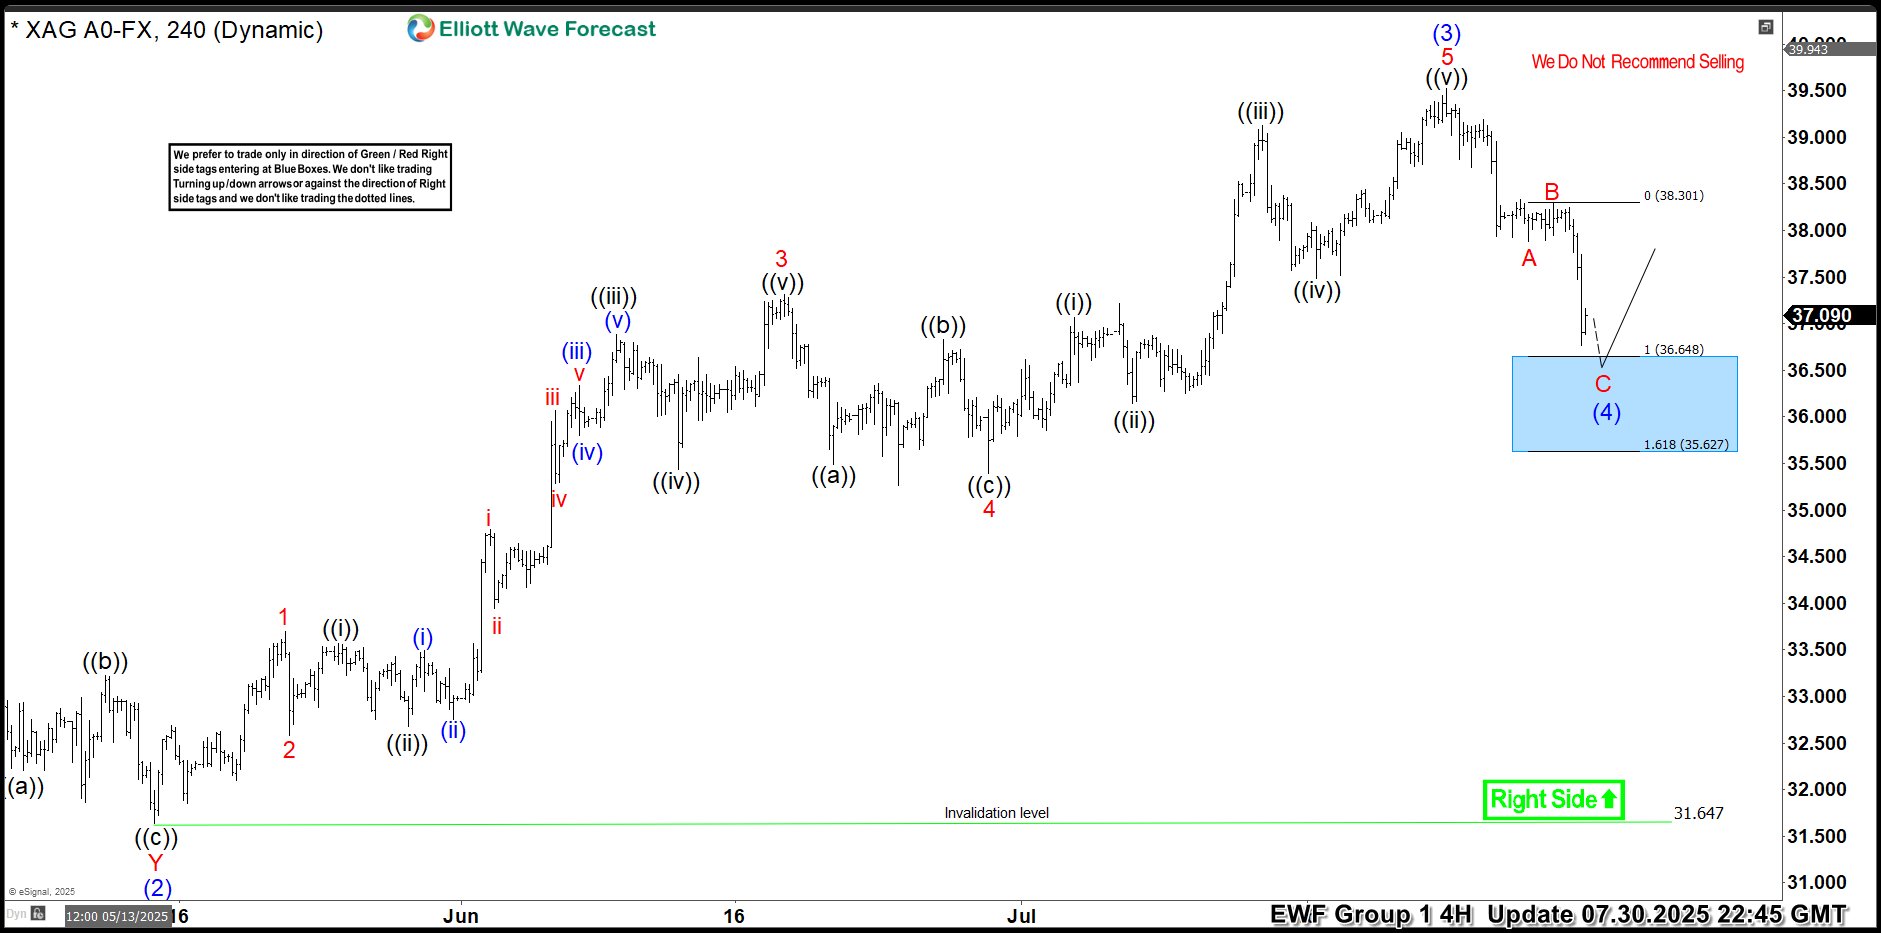
Hello traders. As our members know, we have had many profitable trading setups recently. In this technical article, we are going to talk about another Elliott Wave trading setup we got in Silver (XAGUSD). The commodity has completed its correction exactly at the Equal Legs zone, also known as the Blue Box Area. In this […]
-
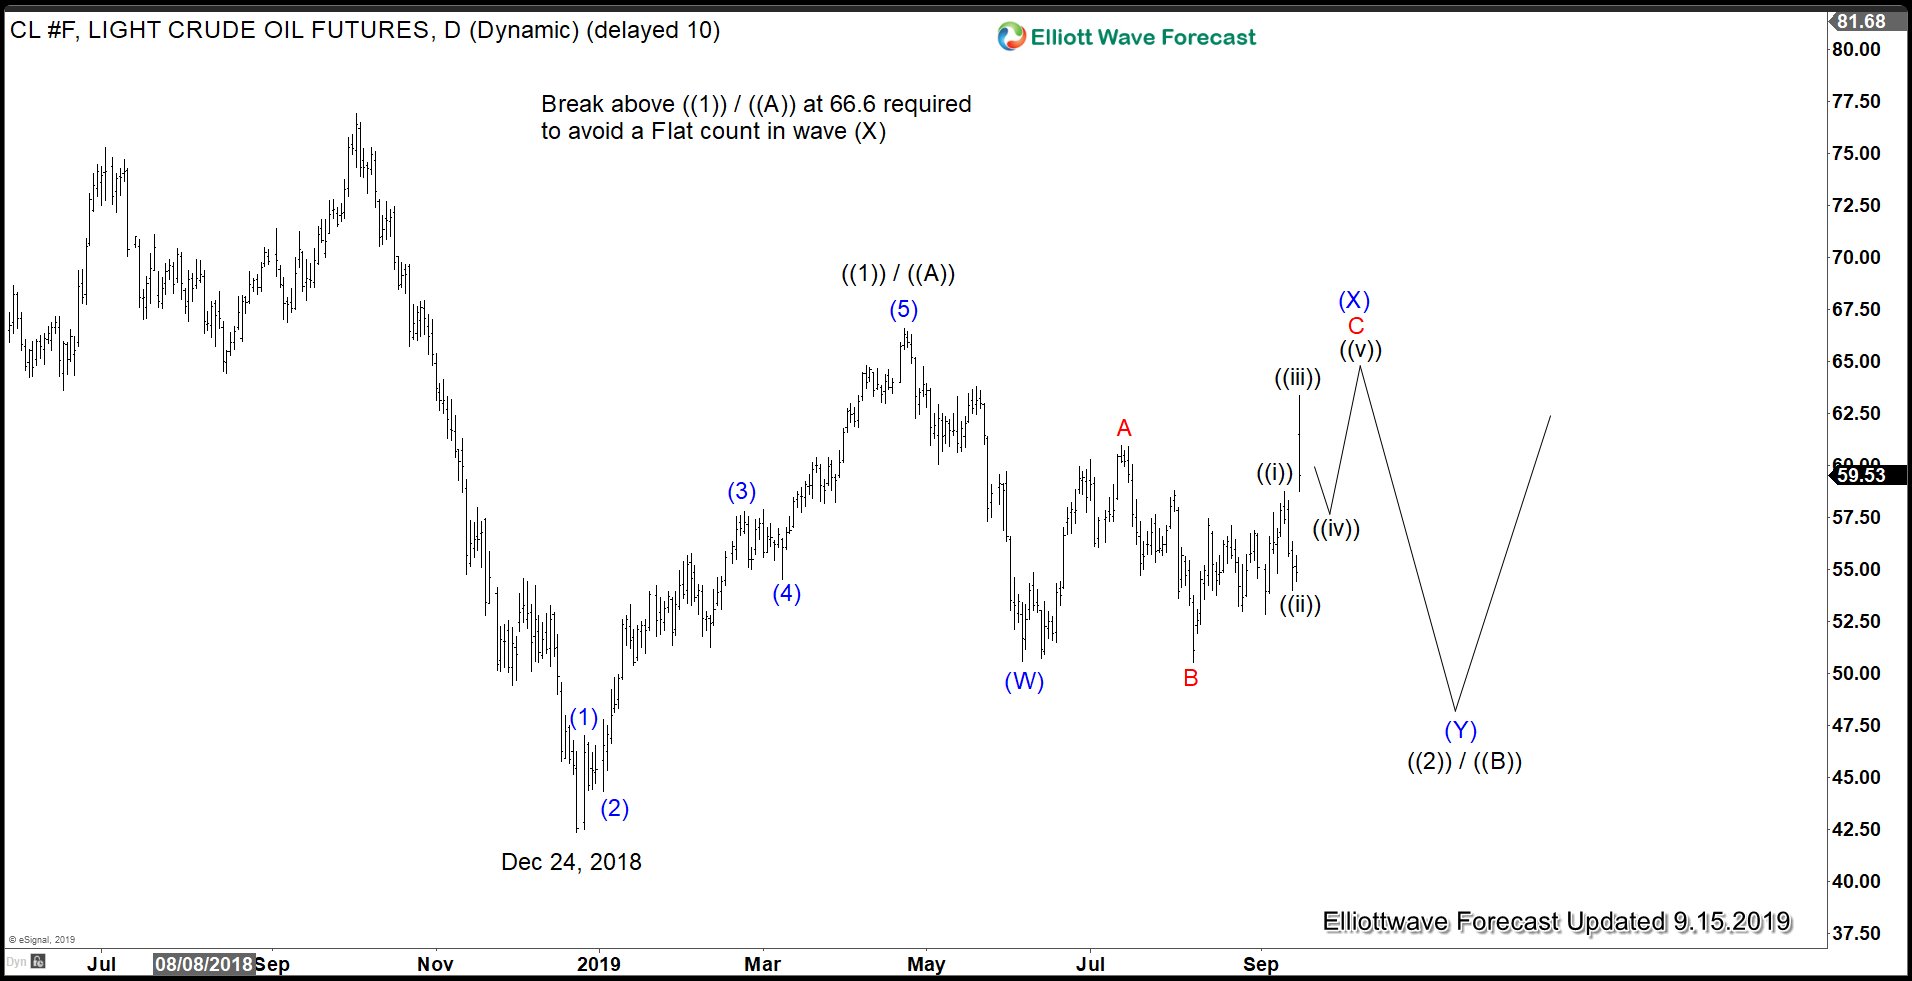
Oil Shot Up 17% after Saudi Arabia’s Oil Refinery Attack
Read MoreIn early Saturday, Saudi Arabia’s oil processing facilities were hit by what initially thought to be drone strikes. Yemen’s Houthi rebels claim responsibility for the attack. The Houthi spokesperson claimed they deployed 10 drones for the attack. However, U.S. Secretary of State Mike Pompeo dismissed the claim and accused Iran instead. Iran denied the accusation […]
-
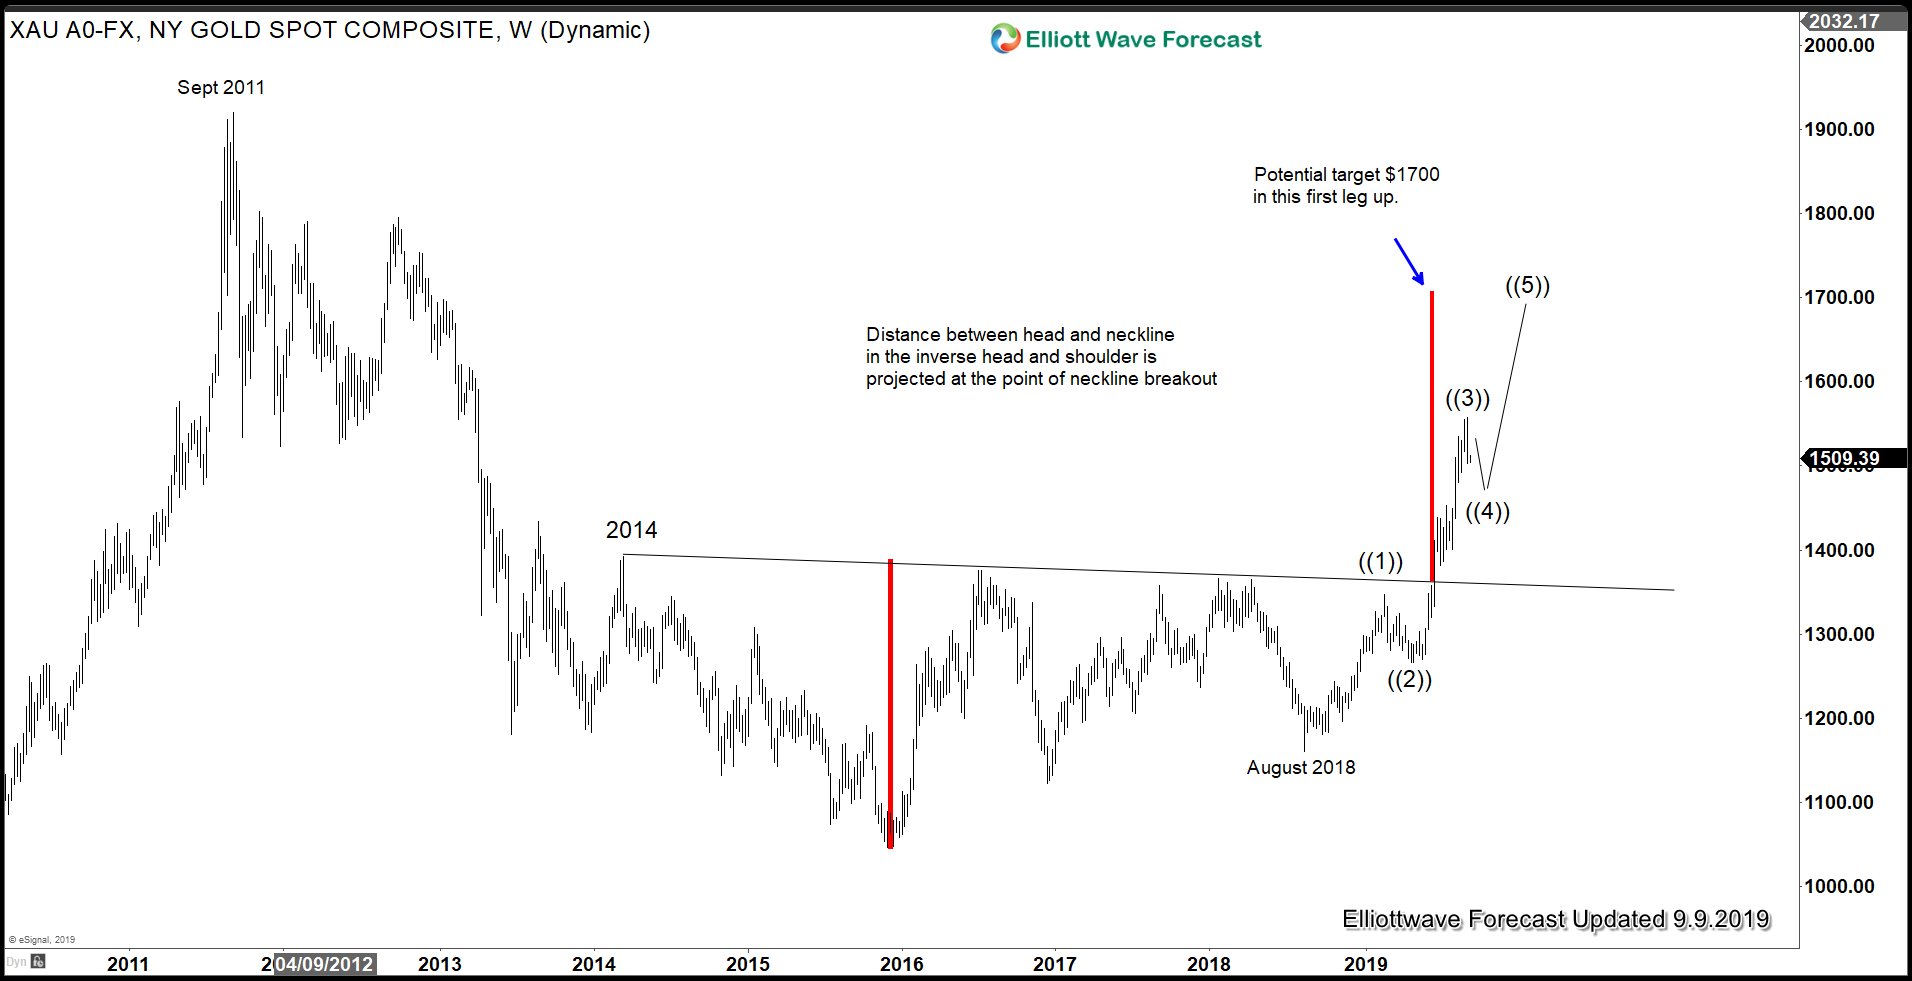
Profit Taking in Gold as Trade Talk Resumes
Read MoreLast week, China and the U.S. have agreed to resume face-to-face talk in Washington in early October. It’s however still unclear if both sides can make substantial, even if temporary, agreement to solve their disputes. Nonetheless, the news is a welcome relief to the market with the year-long conflict dampening 2020 growth forecasts. Prior to […]
-
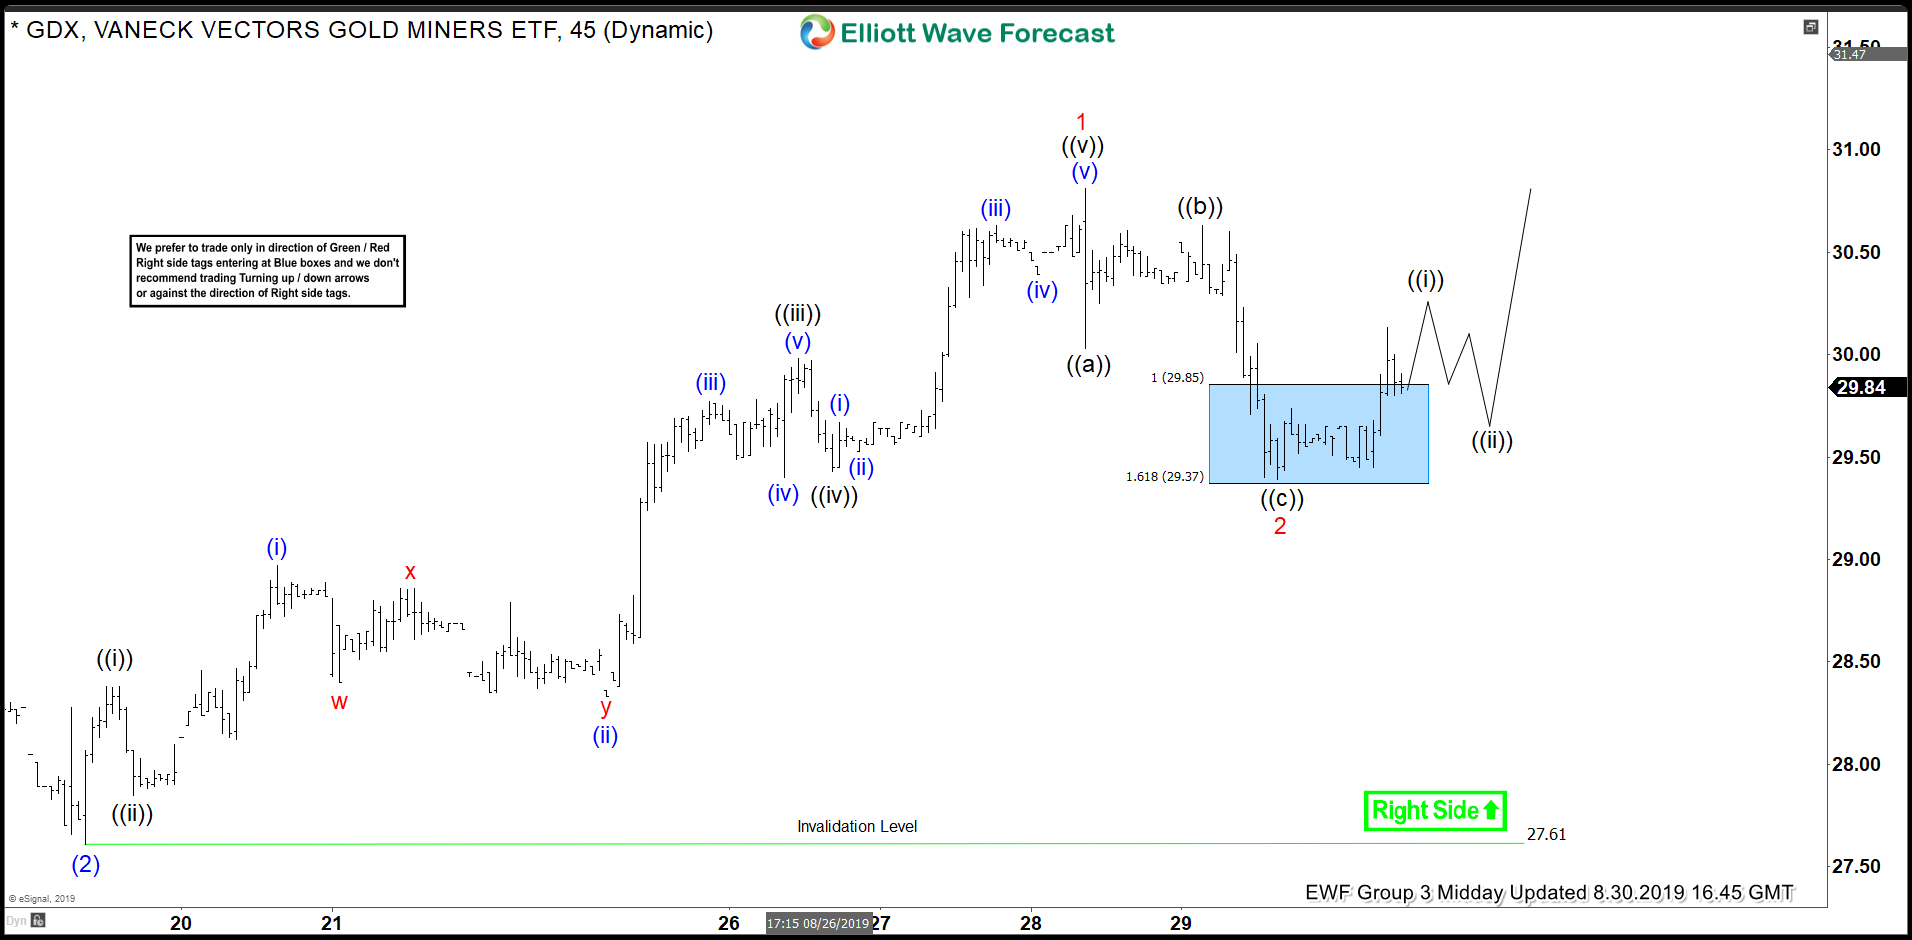
GDX Elliott Wave Analysis: Calling The Reaction Higher From Inflection Area
Read MoreHello fellow traders. Today, I want to share some Elliott Wave charts of the GDX which we presented to our members in the past. You see the 1-hour updated chart presented to our clients on the 08/30/19. showing that GDX ended the cycle from 08/18/19 low at the peak of 08/28/19 at 30.88. Below from there, we […]
-

Elliott Wave View: How High Can Silver Go?
Read MoreSince forming the low on November 2018 at $13.9, Silver has rallied 40% to current price of $19.4. The move higher from $13.9 low took the form of a 5 waves impulsive Elliott Wave structure. On the 1 hour chart below, we can see wave (4) pullback ended at $16.92. The metal has since resumed […]
-
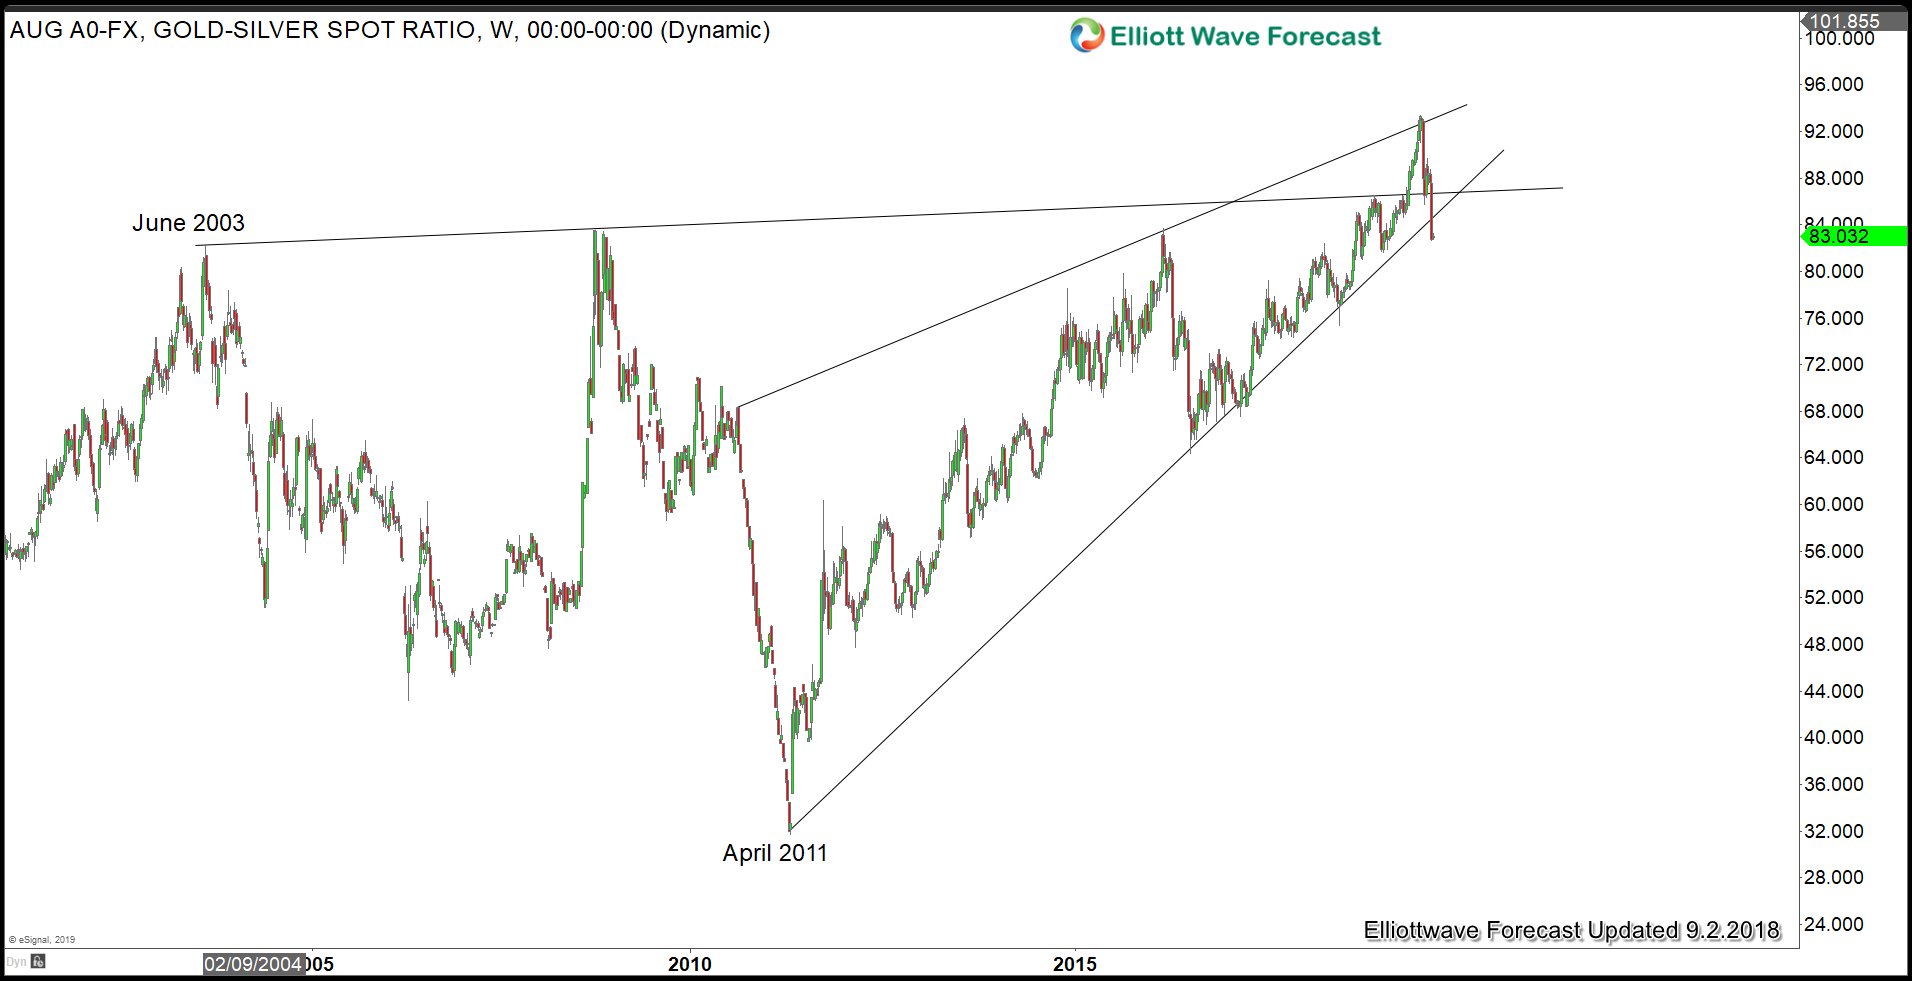
Gold Broke to New All-Time High Against Most Major Currencies
Read MoreGreat Year for Precious Metals Year 2019 certainly has been a good year for the Gold bulls. The metal accelerated its rally after President Trump announced 10% tariffs on the remaining $300 billion of Chinese imports. China then let the Yuan weaken and rise above 7 against the U.S. dollar for the first time in […]
-
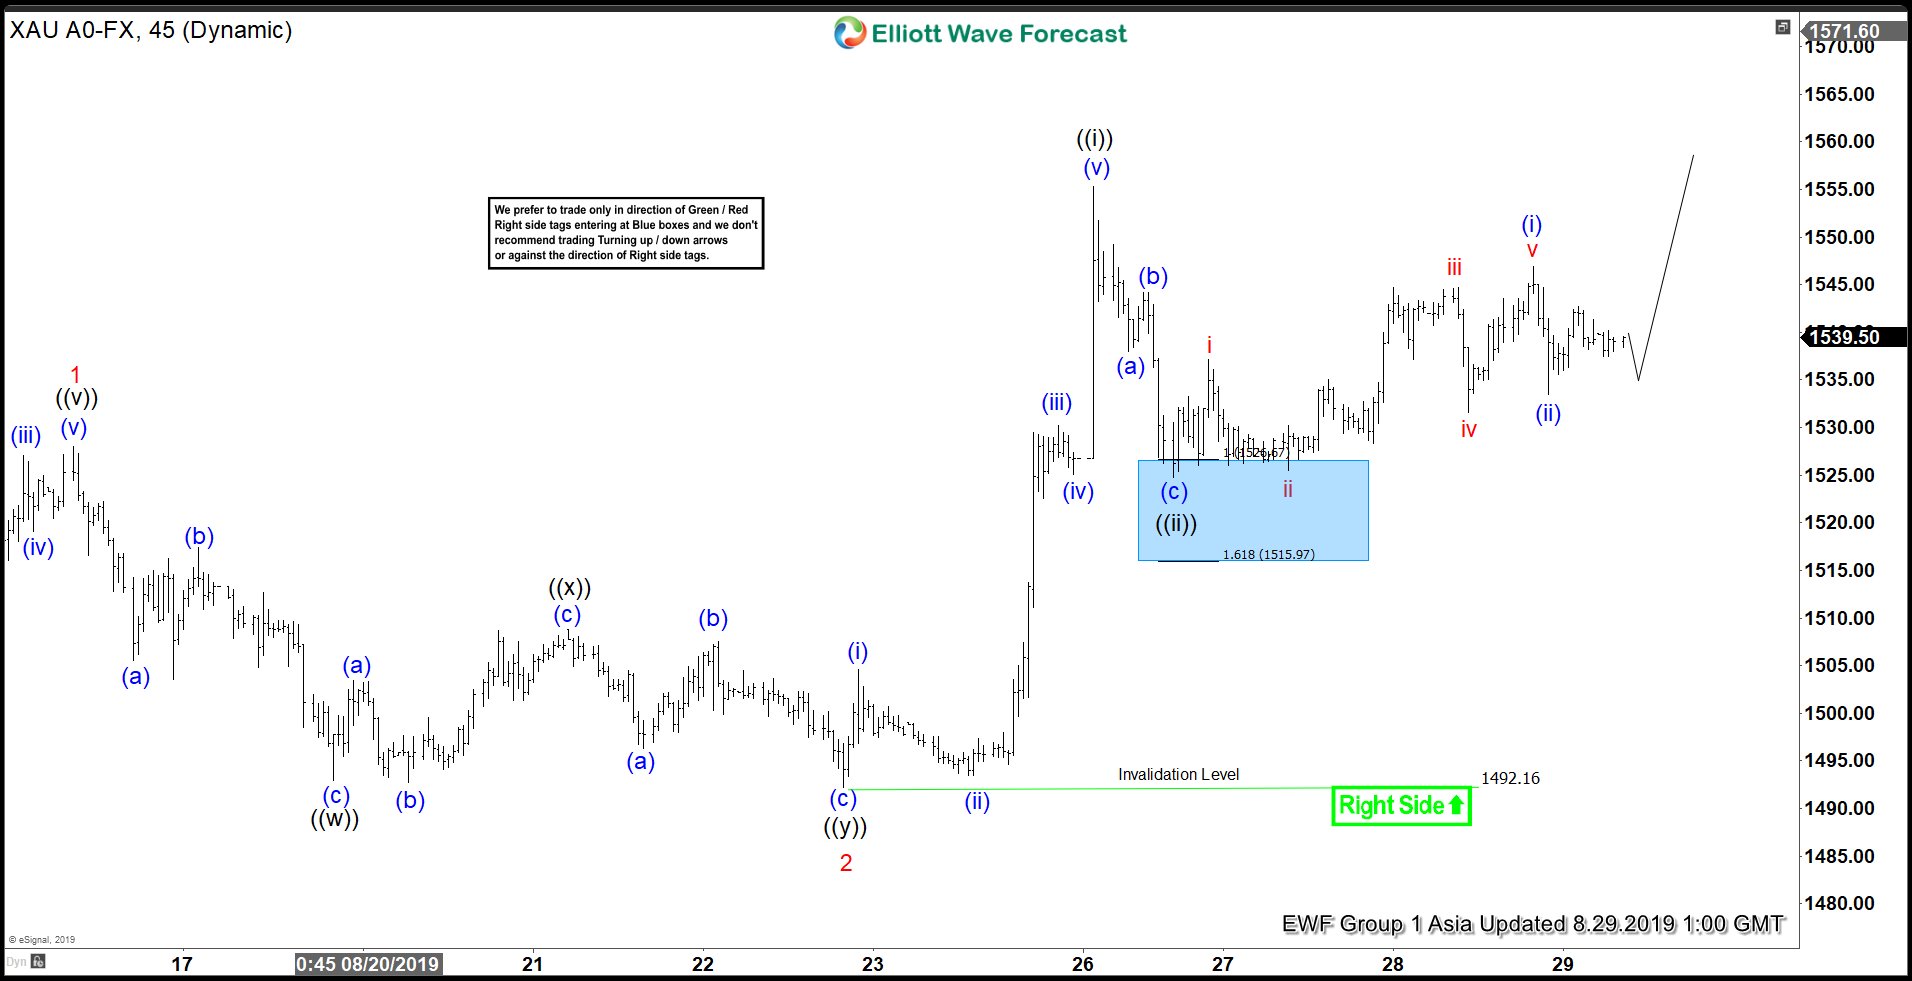
Elliott Wave View: Gold Likely Still Has More Upside
Read MoreGold has continued to hold firm and find bids in a pullback. This article and video explains where it could potentially be heading.