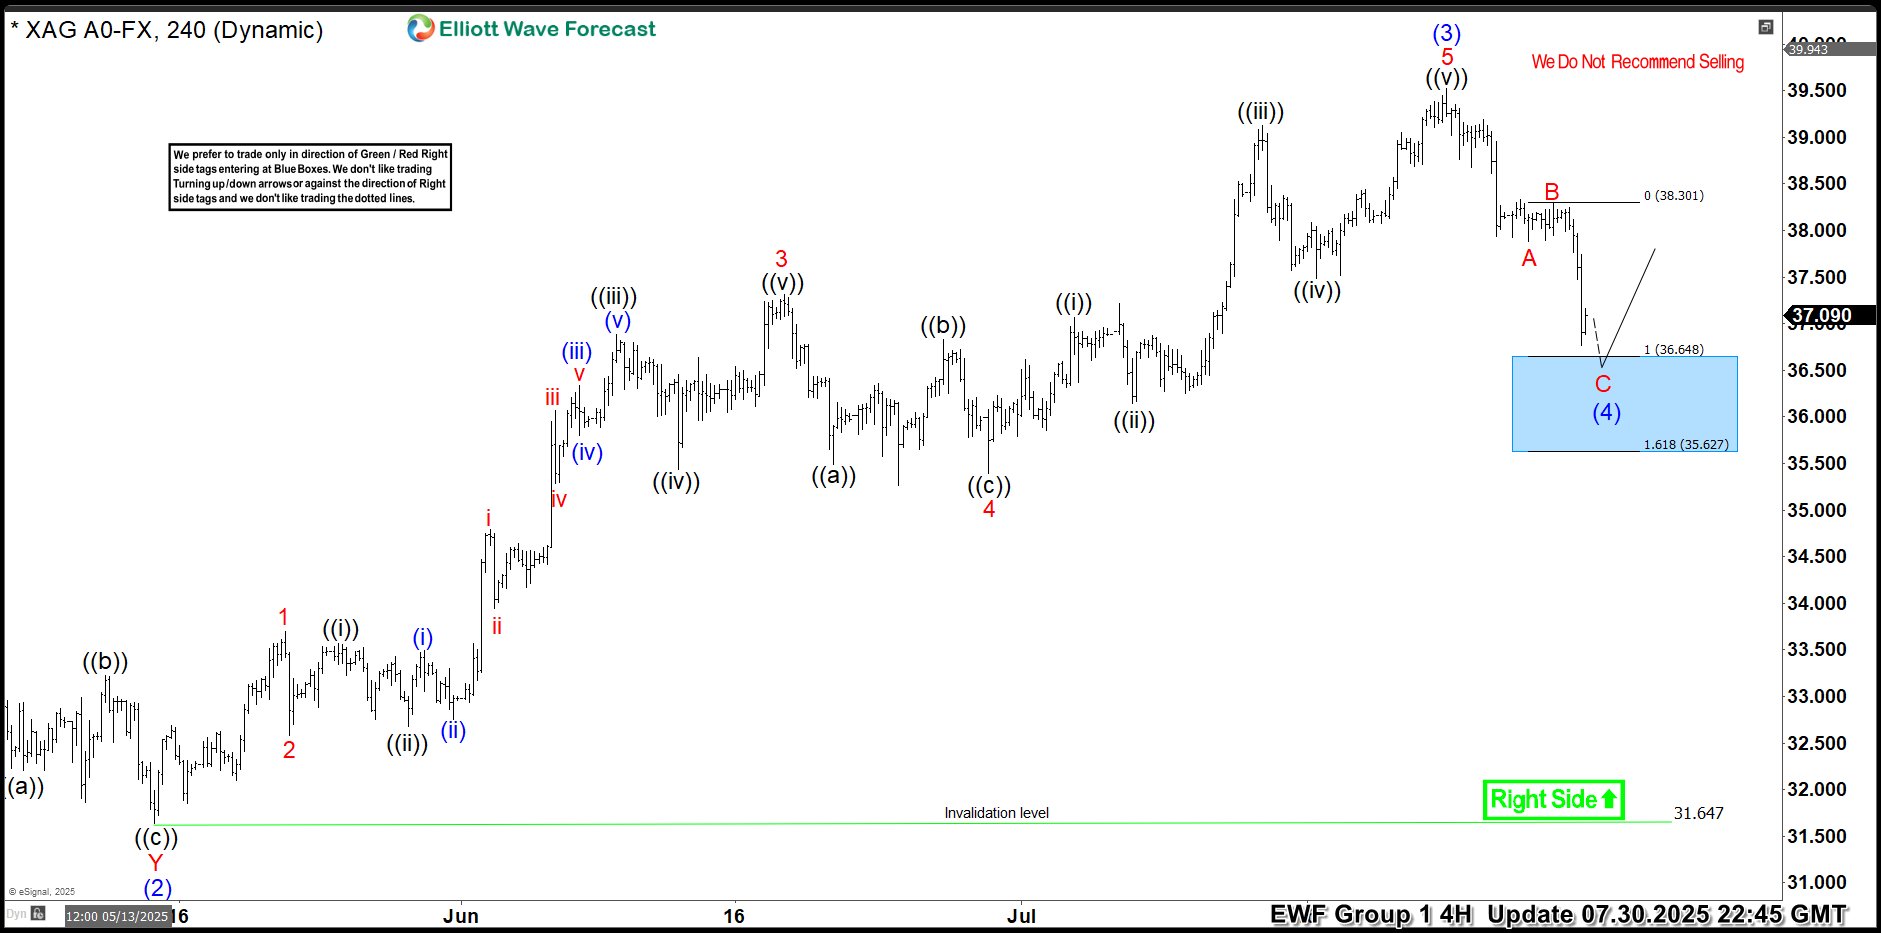

Hello traders. As our members know, we have had many profitable trading setups recently. In this technical article, we are going to talk about another Elliott Wave trading setup we got in Silver (XAGUSD). The commodity has completed its correction exactly at the Equal Legs zone, also known as the Blue Box Area. In this […]
-

$CL 1! Light Crude Futures Elliott Wave Analysis 7.31.2014
Read MorePreferred Elliott Wave view suggests rally to 103.46 completed a corrective (( B )) wave and Crude Oil futures are now expected to trade lower. Short-term price action suggests wave A ended at 100.42 and shallow recovery to 101.69 was wave B. This gives C = A target of 98.58 which has been reached already. […]
-

$HG_F (Copper) 1 Hour Elliott Wave Analysis 7.30.2014
Read MoreWave A completed just 1.236 ext of (( a )) – (( b )) and we got the 3 wave pull back that we were anticipating. Metal has hit 61.8 fib retracement of wave A and has enough number of swings in place to call wave B completed. Thus, as per preferred Elliott Wave view […]
-

$HG_F (Copper) 1 Hour Elliott Wave Analysis 7.24.2014
Read MoreMetal is completing a cycle from 3.168 low and once completed, expect a 3 wave pull back before the next leg higher is seen. Wave B pull back can test 50 – 61.8 fib zone (3.203 – 3.215) before another extension higher toward 3.32 – 3.38 region is seen to complete wave ( X ). […]
-

GOLD – XAUUSD – A Technical Look at Elliot Wave
Read MoreHere is a quick blog from our Live Trading Room host, Dan Hussey. Take a look at how to manage your risk by using inflection zones and Elliot Wave to your advantage. The Live Trading Room is held daily from 11:30 AM EST until 1:30 PM EST, join Dan there for more insight into these […]
-

A look at the Gold move up from 1240 low
Read MoreGold has been steadily moving higher since forming a low at 1240. Let’s take a look at some charts from members area to see how we called this move. As you can see on H4 chart below , preferred Elliott wave view was calling for pull back which was supposed to correct cycle from 1240.3 low toward […]
-

5 wave Elliott wave Impulse
Read MoreGold has been rallying since early June low of 1240 in 5 waves. In Elliott Wave Principle, market does not run in straight line and after 5 waves rally, a pullback in 3 waves is expected. Current wave structure and count in gold suggest that the yellow metal is close to completing this 5 waves rally in an […]