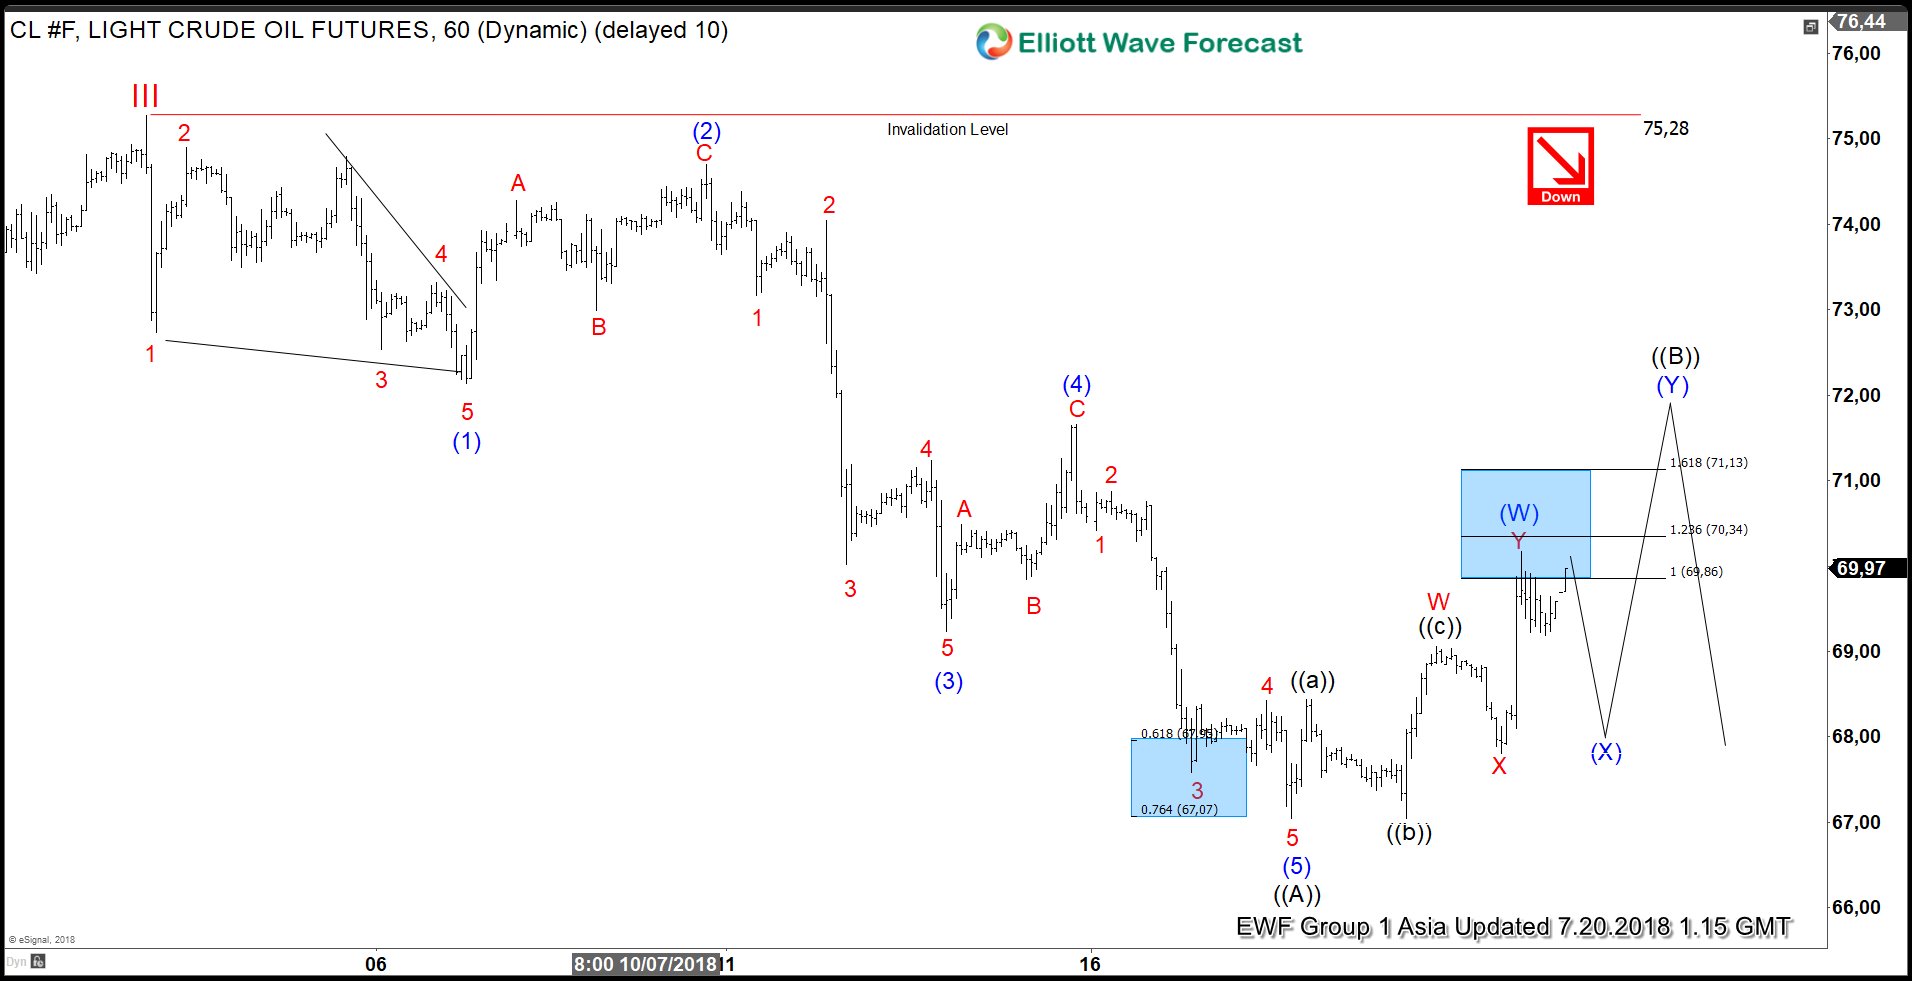
OIL short-term Elliott wave analysis suggests that the rally to $75.28 high ended cycle degree wave III. Down from there, the larger correction in cycle degree wave IV is taking place in 3, 7 or 11 swings before Oil resumes higher. The internal of the first leg of the decline from $75.28 high took place in 5 waves impulse with internal distribution of 5 waves structure in lesser degree cycle. This suggests that the five waves down from $75.27 is part of a larger Elliott wave Zigzag correction within cycle degree wave IV pullback.
Down from $75.28 high, the decline to $72.14 low ended intermediate wave (1) as a leading diagonal structure. Above from there, the bounce to 74.70 high ended intermediate wave (2) bounce as a Zigzag correction. Below from there, the decline to $69.23 low ended intermediate wave (3) in another 5 waves. Then the bounce to $71.66 high ended intermediate wave (4) bounce in 3 swings. The final decline from there unfolded in 5 waves structure which ended intermediate wave (5) at $67.04 low & also completed the primary wave ((A)).
Up from there, the instrument is doing the primary wave ((B)) recovery against 7/03 high ($75.28) in 3, 7 or 11 swings before further decline is seen. So far instrument already made the 3 waves recovery & reached the $69.86 – $70.34 100%-123.6% Fibonacci extension area of Minor W-X to complete intermediate wave (W). The instrument is expected to do a 3 waves pullback in intermediate wave (X) then another leg higher in intermediate wave (Y) of ((B)) can be seen before instrument resumes lower again. We don’t like selling it.
OIL 1 Hour Elliott Wave Chart
Back


