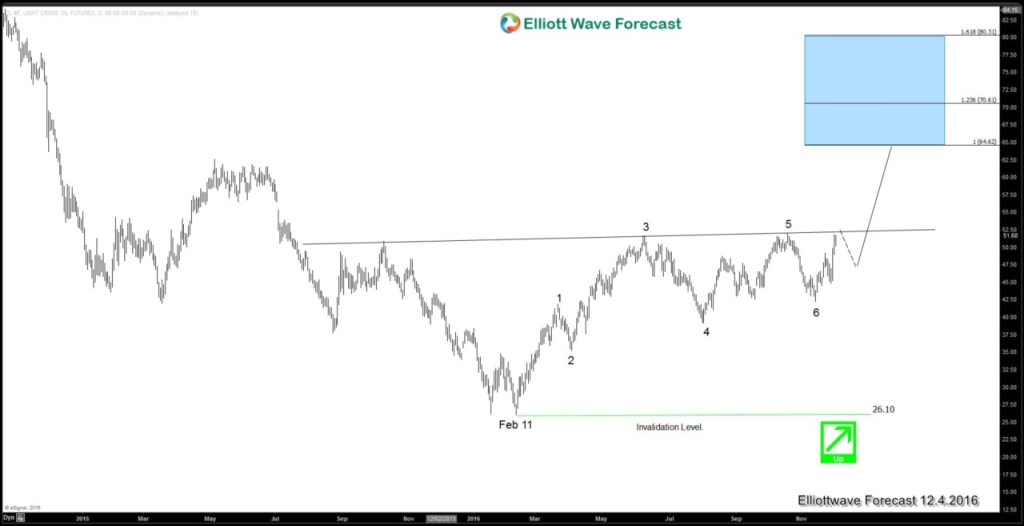
Oil’s price has been completely crushed in the past 3 years. From $112.2 peak in Aug 2013, Oil’s price dropped 77% until it finally found a support in Feb 2016 at $26. From Feb 2016 low, Oil Elliott wave sequence is showing 5 swing (daily chart below), which suggests that further upside is possible.
Last Wednesday on Nov 30th, oil’s price rose 10% to above $50 in a volatile trade after OPEC members agreed to cut 1.2 million barrels a day from global oil production. This agreement is the first in 8 years since the OPEC members cut their production to support the oil’s price. Oil price has been sagging in the past few years due to the oversupply and glut in the world’s oil market. The oversupply was a deliberate strategy by OPEC members, led by Saudi Arabia, to wage price war against their U.S shale oil rivals. The agreement to cut 1.2 million barrels a day marks a shift in OPEC’s strategy and the the number represents more than 1% of global oil supply. The production cut will be in effect starting from January 1st next year and last for six months.
A successful agreement by the OPEC members also opens up the door for non-OPEC members, notably Russia, to chip in and participate in limiting the production. If Russia can also cut the oil production by 600,000 barrels a day, it will amount to almost 2% of global oil production, far more than what the market expects. However, for oil’s price to continue the rally in the near term, it may depend on the commitment of non-OPEC members, such as Russia, to cut oil output in the next meeting on December 9th.
Oil Elliott wave Sequence is showing 5 swing
Oil Elliott wave sequence from Feb 11 low is showing 5 swing, which suggests that further upside is expected. Please note that we are not referring to 5 waves impulse when we talk about 5 swing. We meant that the number (count) of swing is five.
As far as pivot at Feb 11 low ($26.1) remains intact, oil may see further upside towards $60 area, likely in 2017 to complete a 7 swing structure from Feb 11 low. A break above Oct 19 high ($51.9) will further support this idea. In addition, the structure also looks like an inverse head and shoulder with the head at $26.1 and the left shoulders on Aug 2015 and right shoulder on Aug 2016. The neckline of the inverse head and shoulder is around $52.
To learn more about Elliott wave and find inflection area to trade $CL_F, feel free to check our service by clicking here -> 14 days Trial. At EWF, we cover 52 instrument in different asset classes from forex, commodities, and indices. We provide Elliottwave forecast in 4 different time frames, Live Trading Room, 24 hour chat room, live sessions, and much more.
Back


