In this blog, we will take a look at how HG_F (Copper) rally from June low failed in a blue box and resulted in new lows. We will also look at the sequence from December 2017 peak and talk about the next Trading opportunity and targets for the sequence from December 2017 peak.
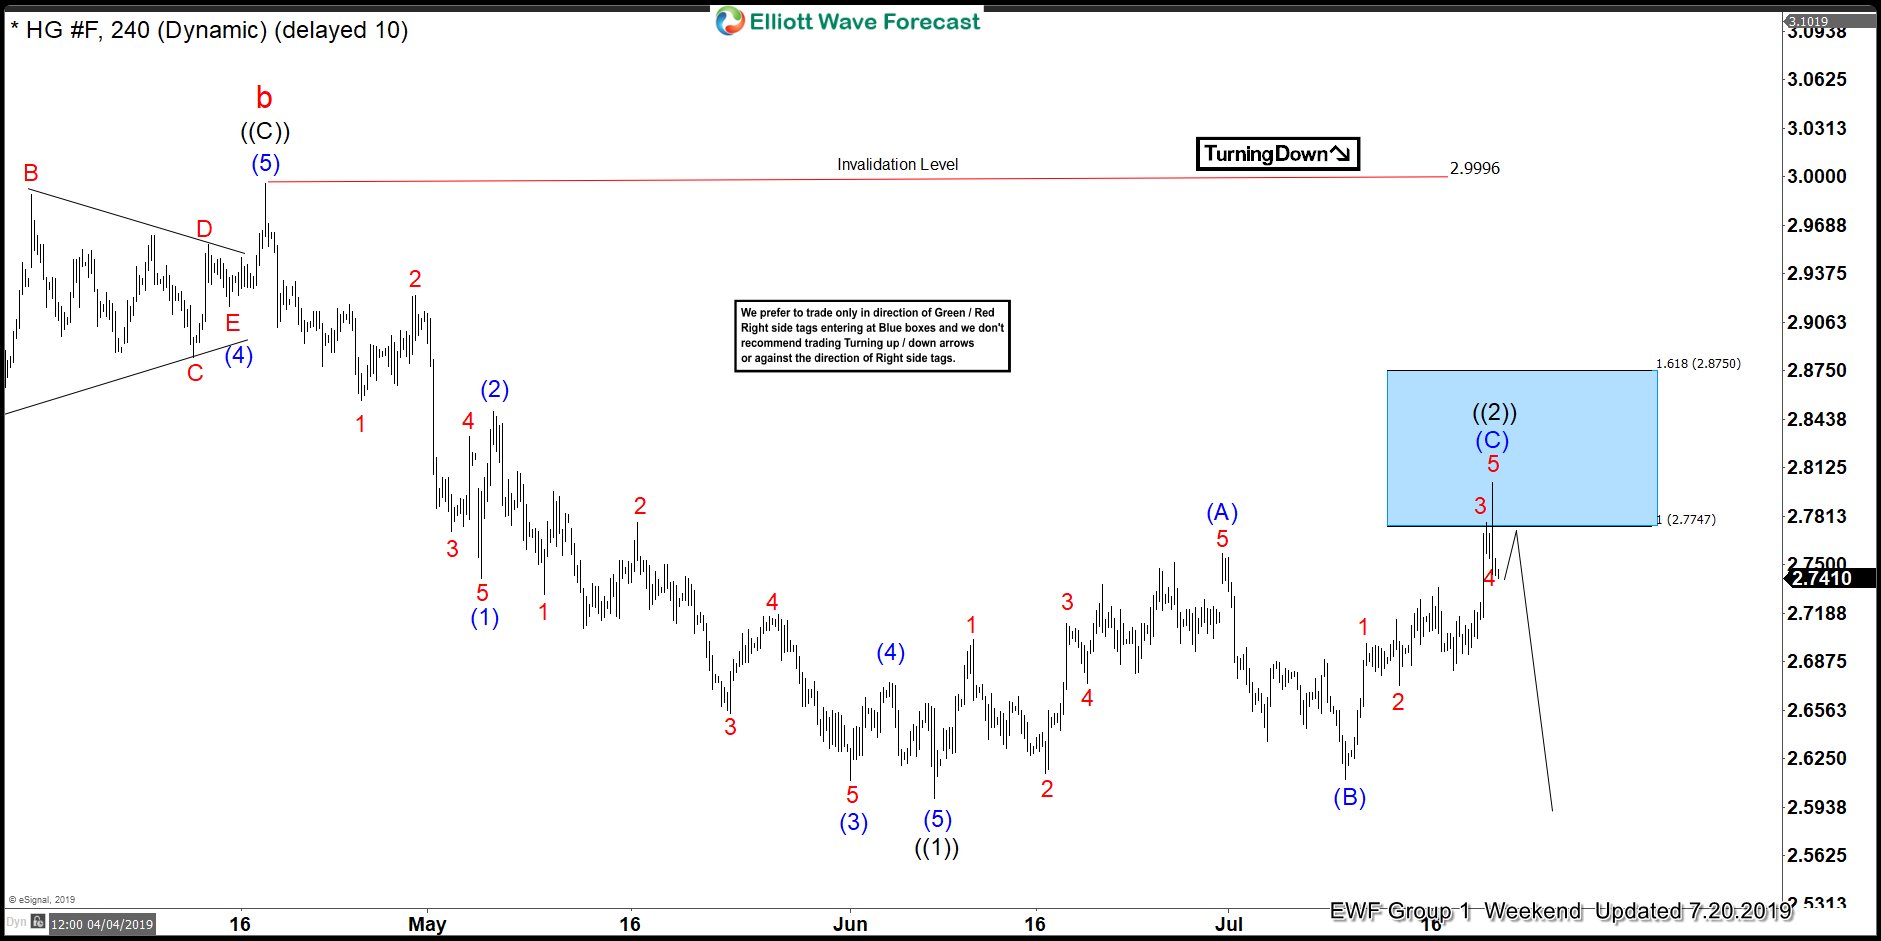
HG_F (Copper) 20th July 4 Hour Elliott Wave Update
Copper rally from 6.7.2019 low unfolded as a Zigzag Elliott wave structure and reached the blue box where it was expected to end. Chart above shows, price reached the blue box and showed the initial reaction lower due to which we called wave ((2)) bounce completed and called for the decline to resume to new lows below 6.7.2019 lows.
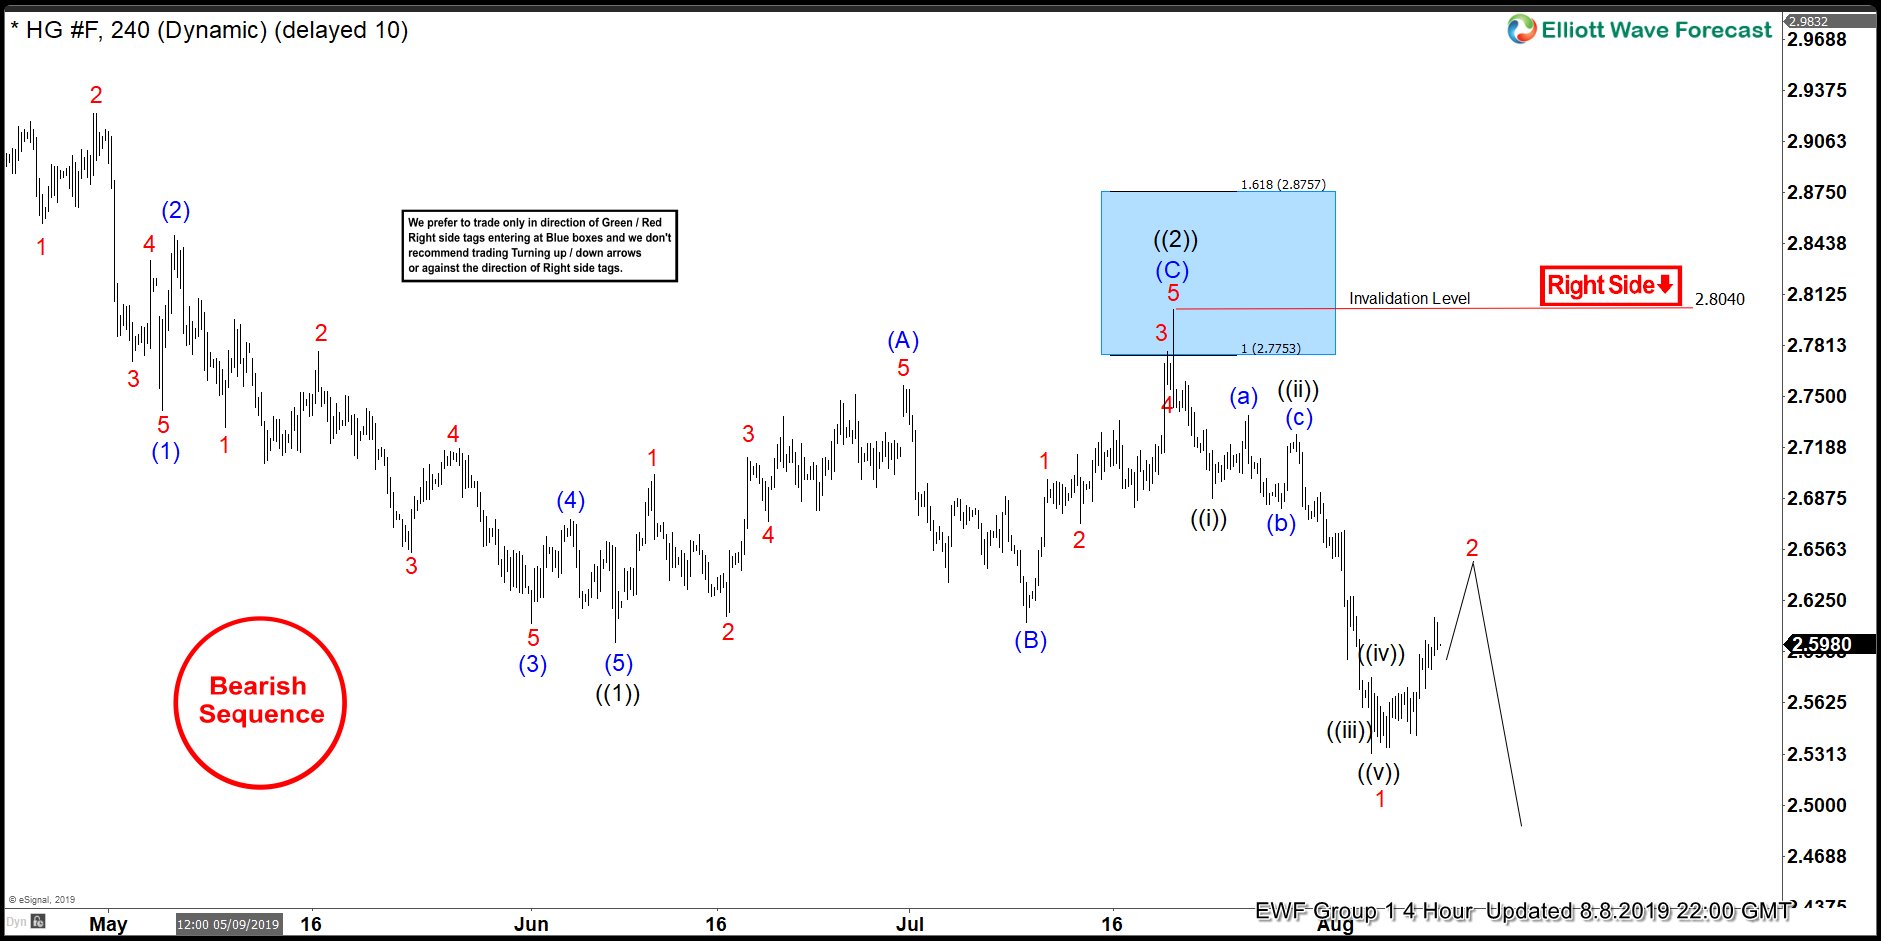
HG_F (Copper) 8th August 4 Hour Elliott Wave Update
Chart above shows, Copper resumed the decline and went to break below 6.7.2019 low and now has an incomplete sequence down from 12.28.2017 peak and also down from 4.17.2019 peak. This is represented by a Bearish Sequence stamp on the chart and the red Right Side tag at 2.804 indicates that sequence is bearish against the said level. Decline from 2.804 peak could be counted as 5 waves impulse which has been labelled as wave 1 and we are now looking for a bounce in wave 2 before the decline resumes. Wave 2 corrective bounce should unfold in the sequence of 3, 7 or 11 swings and fail below 2.804 peak for extension lower. We don’t like buying the metal in proposed wave 2 bounce and expect the bounce to be sold for the next leg lower.
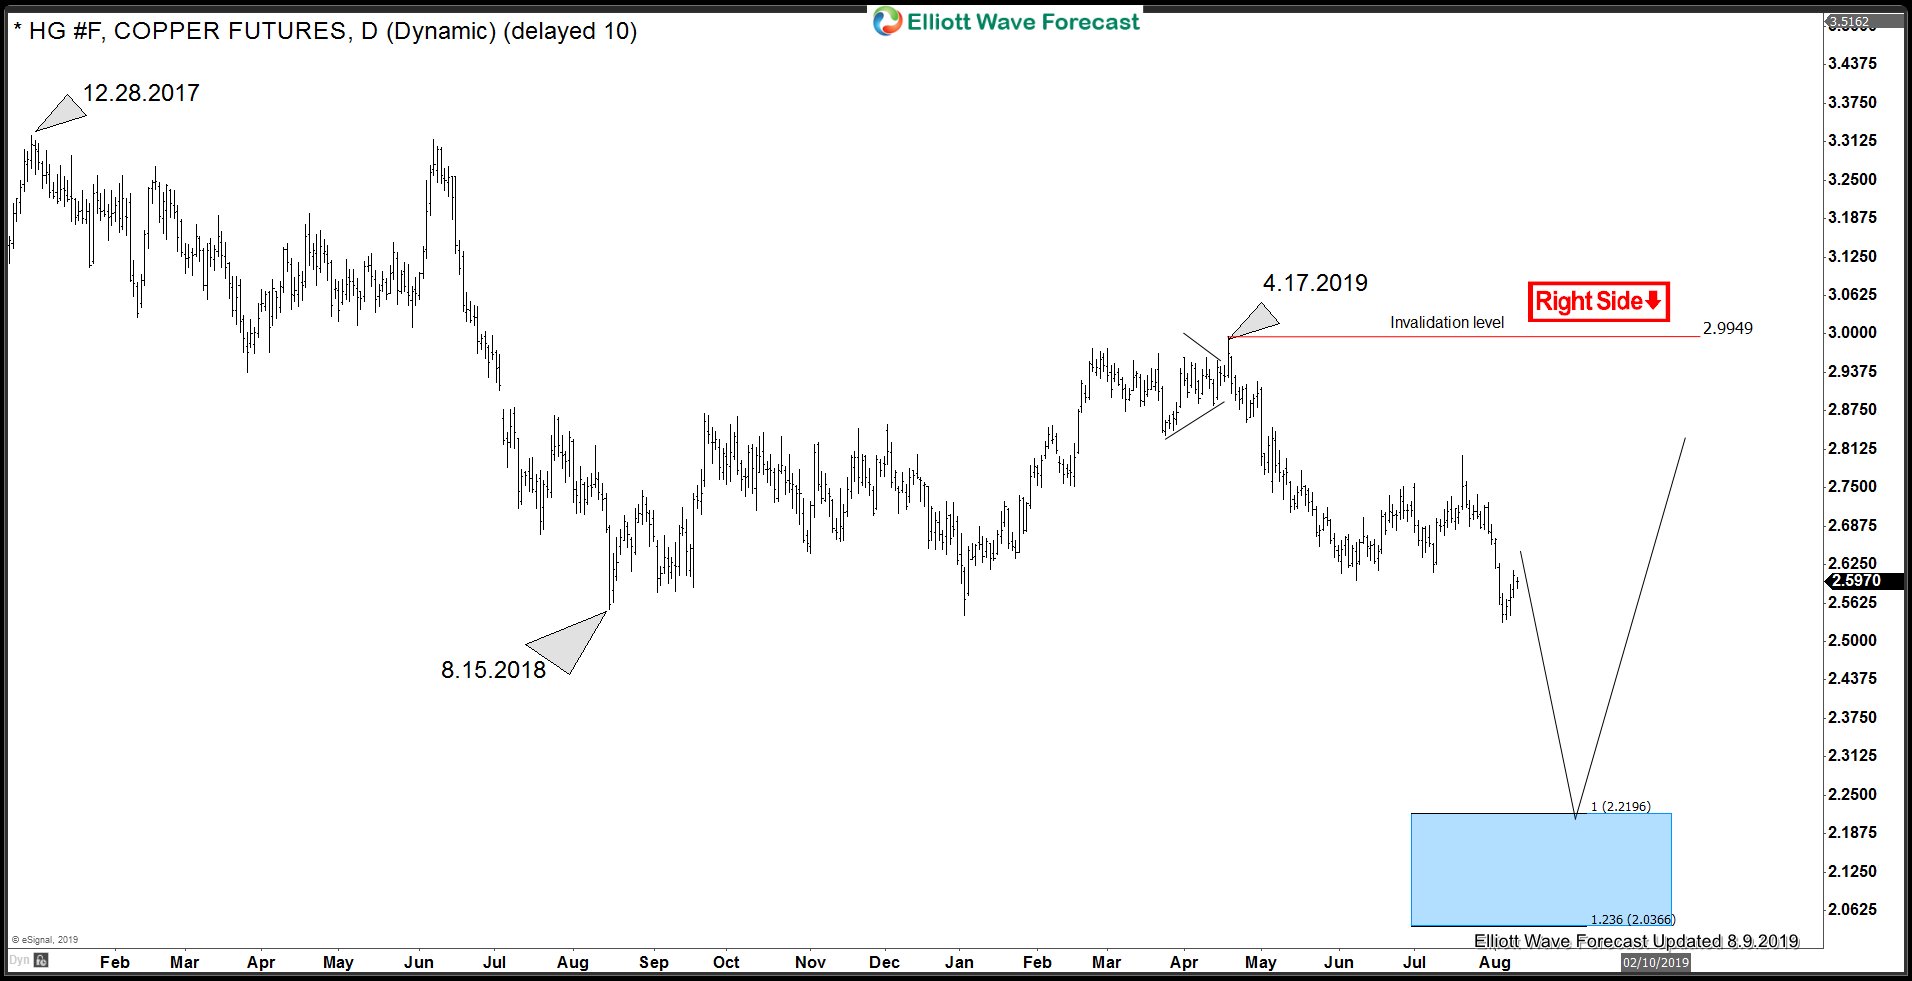
HG_F (Copper) Downside Targets
As bounces continue to fail below 2.804 peak, we expect more downside and it should ideally extend lower towards 2.219 – 2.0366 area and any rallies are viewed as a selling opportunity.
Back


