-

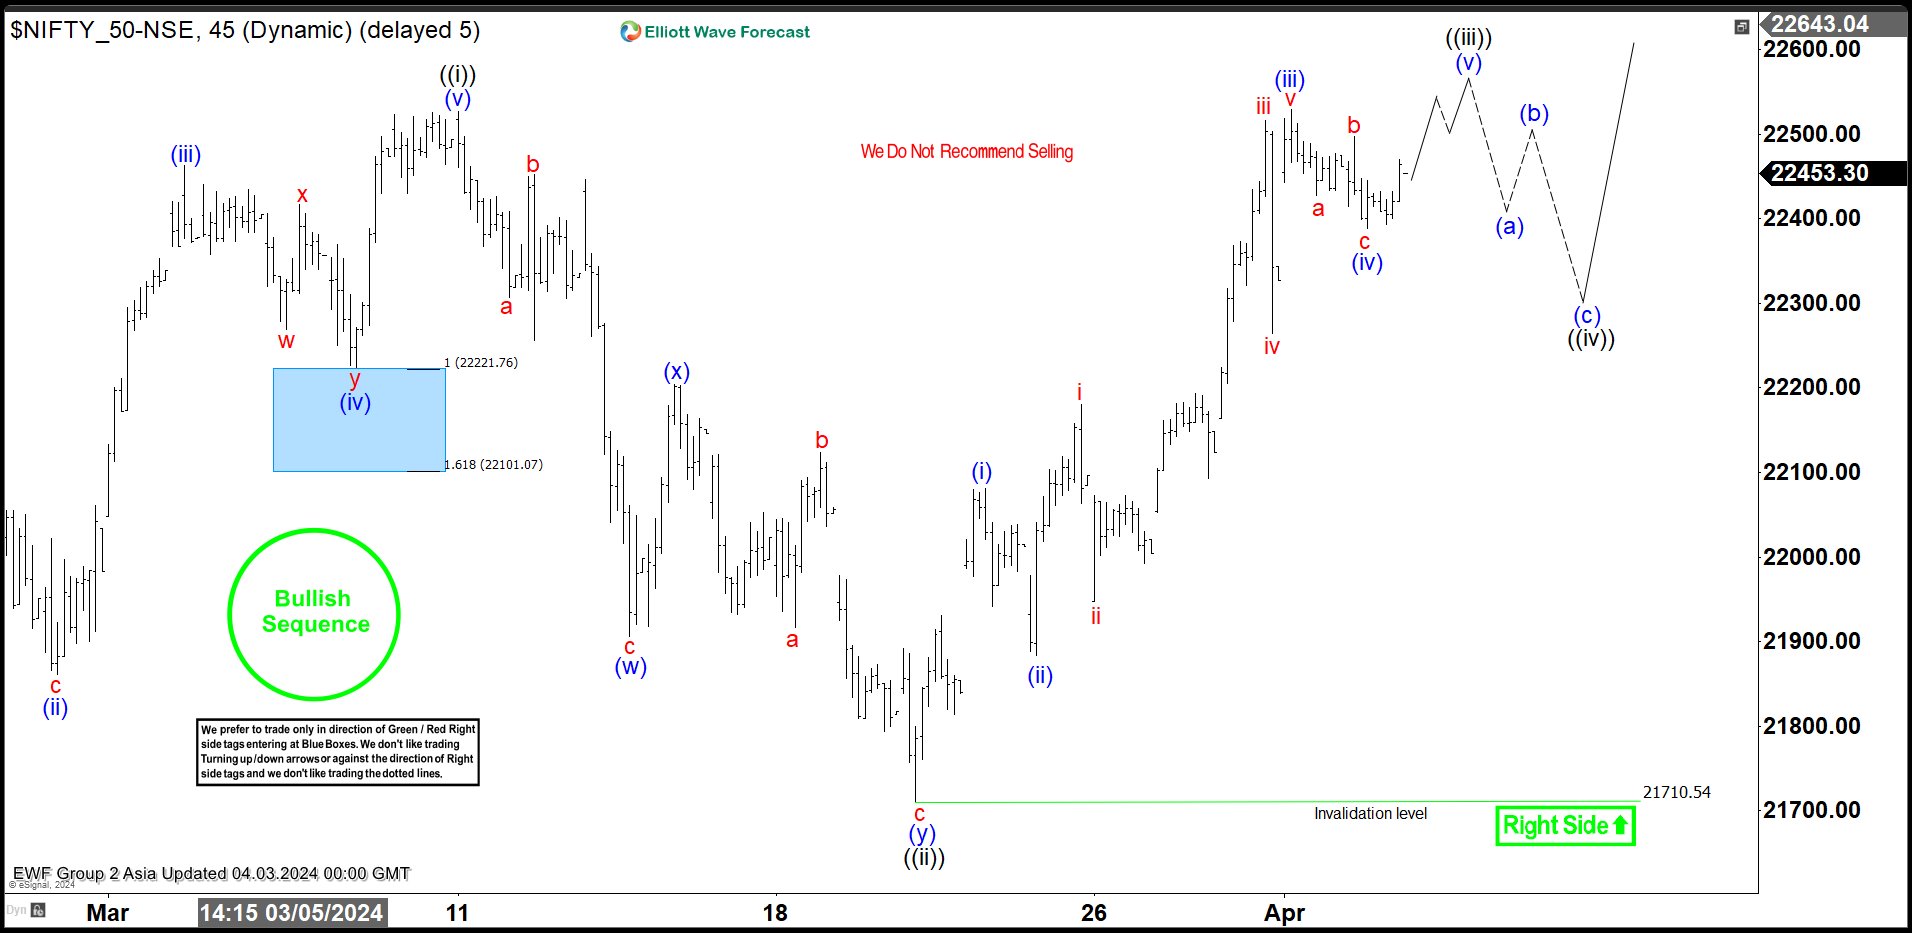
Nifty Pullback Should Continue to Find Buyers
Read MoreNifty rally from 1.24.2024 low is in progress as a 5 waves diagonal and should see more upside. This article and video look at the Elliott Wave path.
-

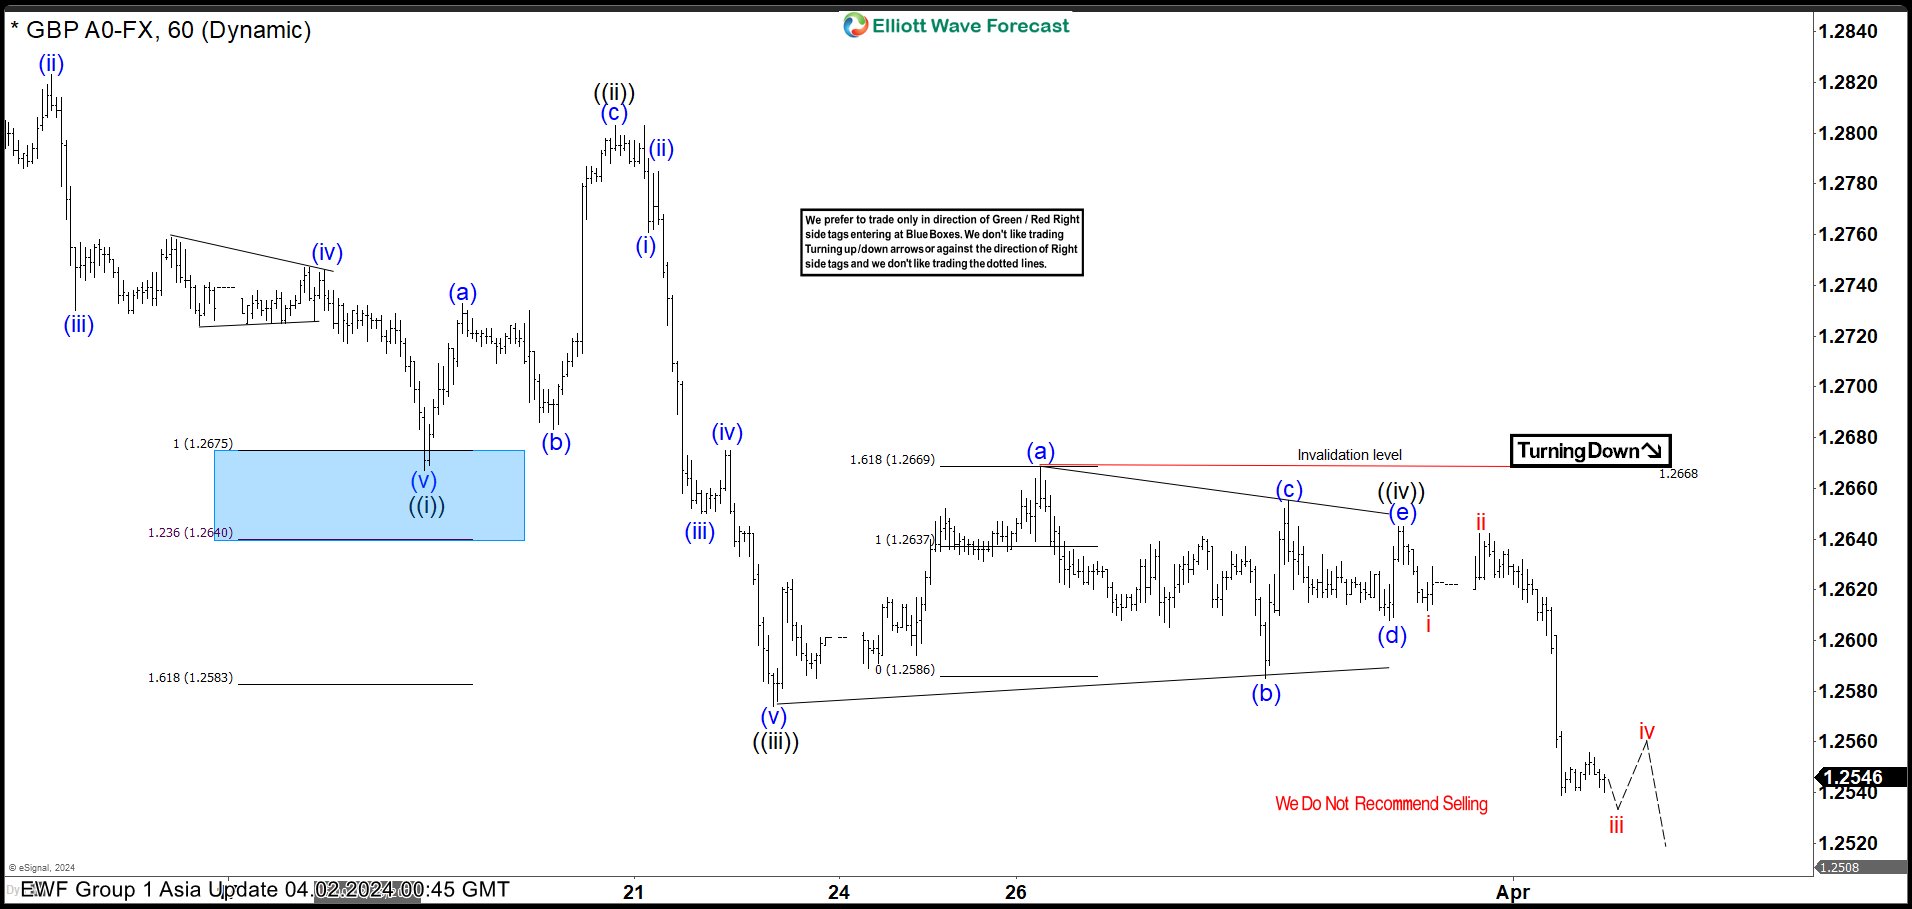
GBPUSD May See Support Soon From Inflection Area
Read MoreGBPUSD is looking to end 5 waves impulse soon. This article and video look at the short term Elliott Wave path of the pair.
-

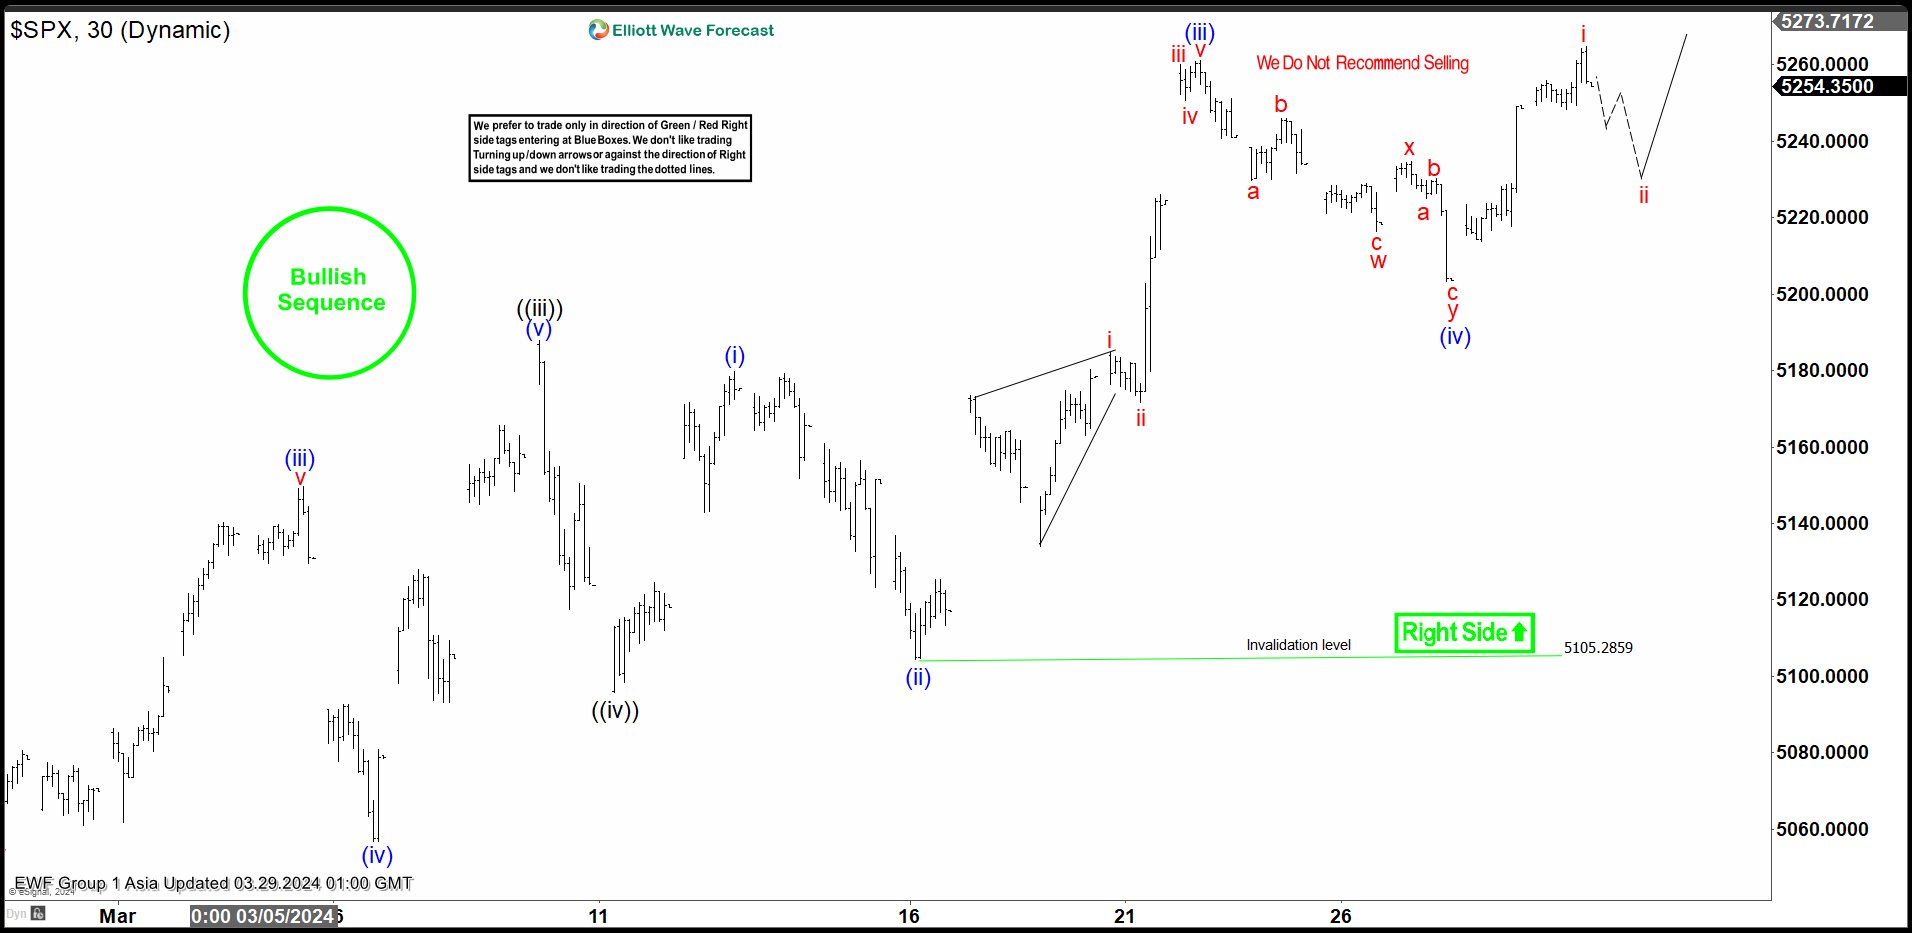
S&P 500 (SPX) Looking to Complete 5 Waves Impulse
Read MoreS&P 500 (SPX) is looking to complete 5 waves impulse and short term can see further upside. This article and video look at the Elliott wave path.
-

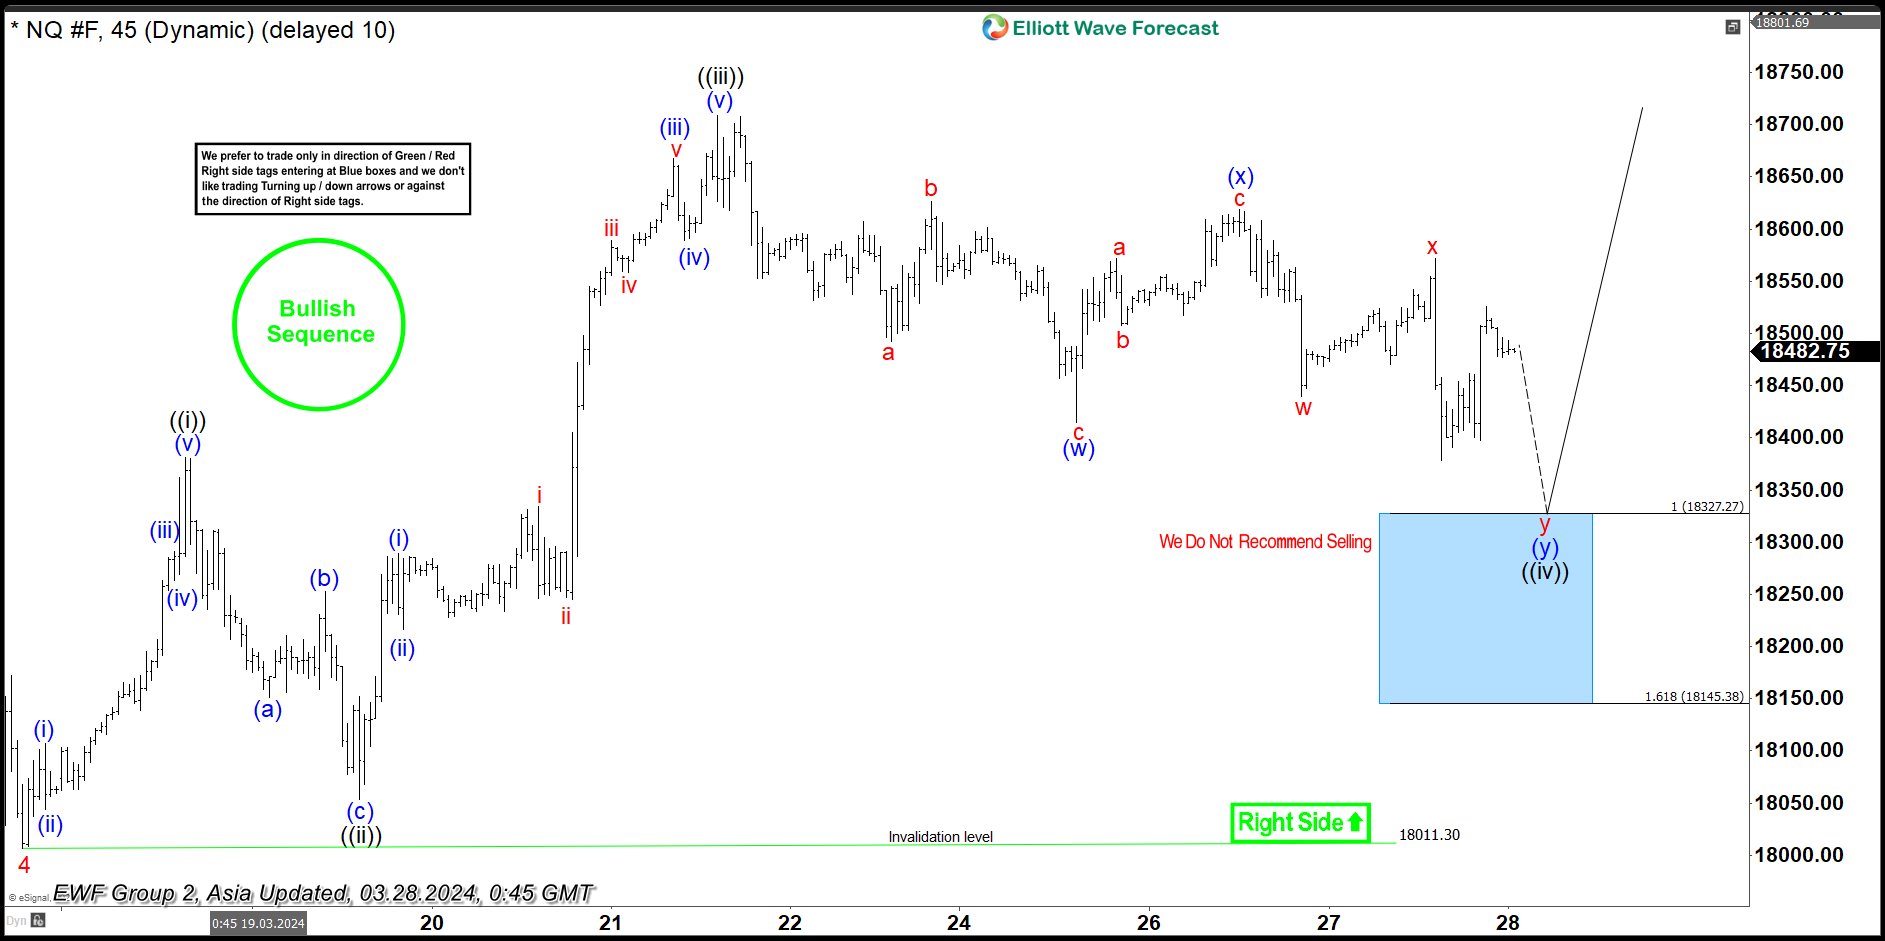
Nasdaq 100 (NQ) Potential Support Area
Read MoreNasdaq 100 (NQ) is looking to do a double three correction. This article and video look at the potential support area of the Index
-

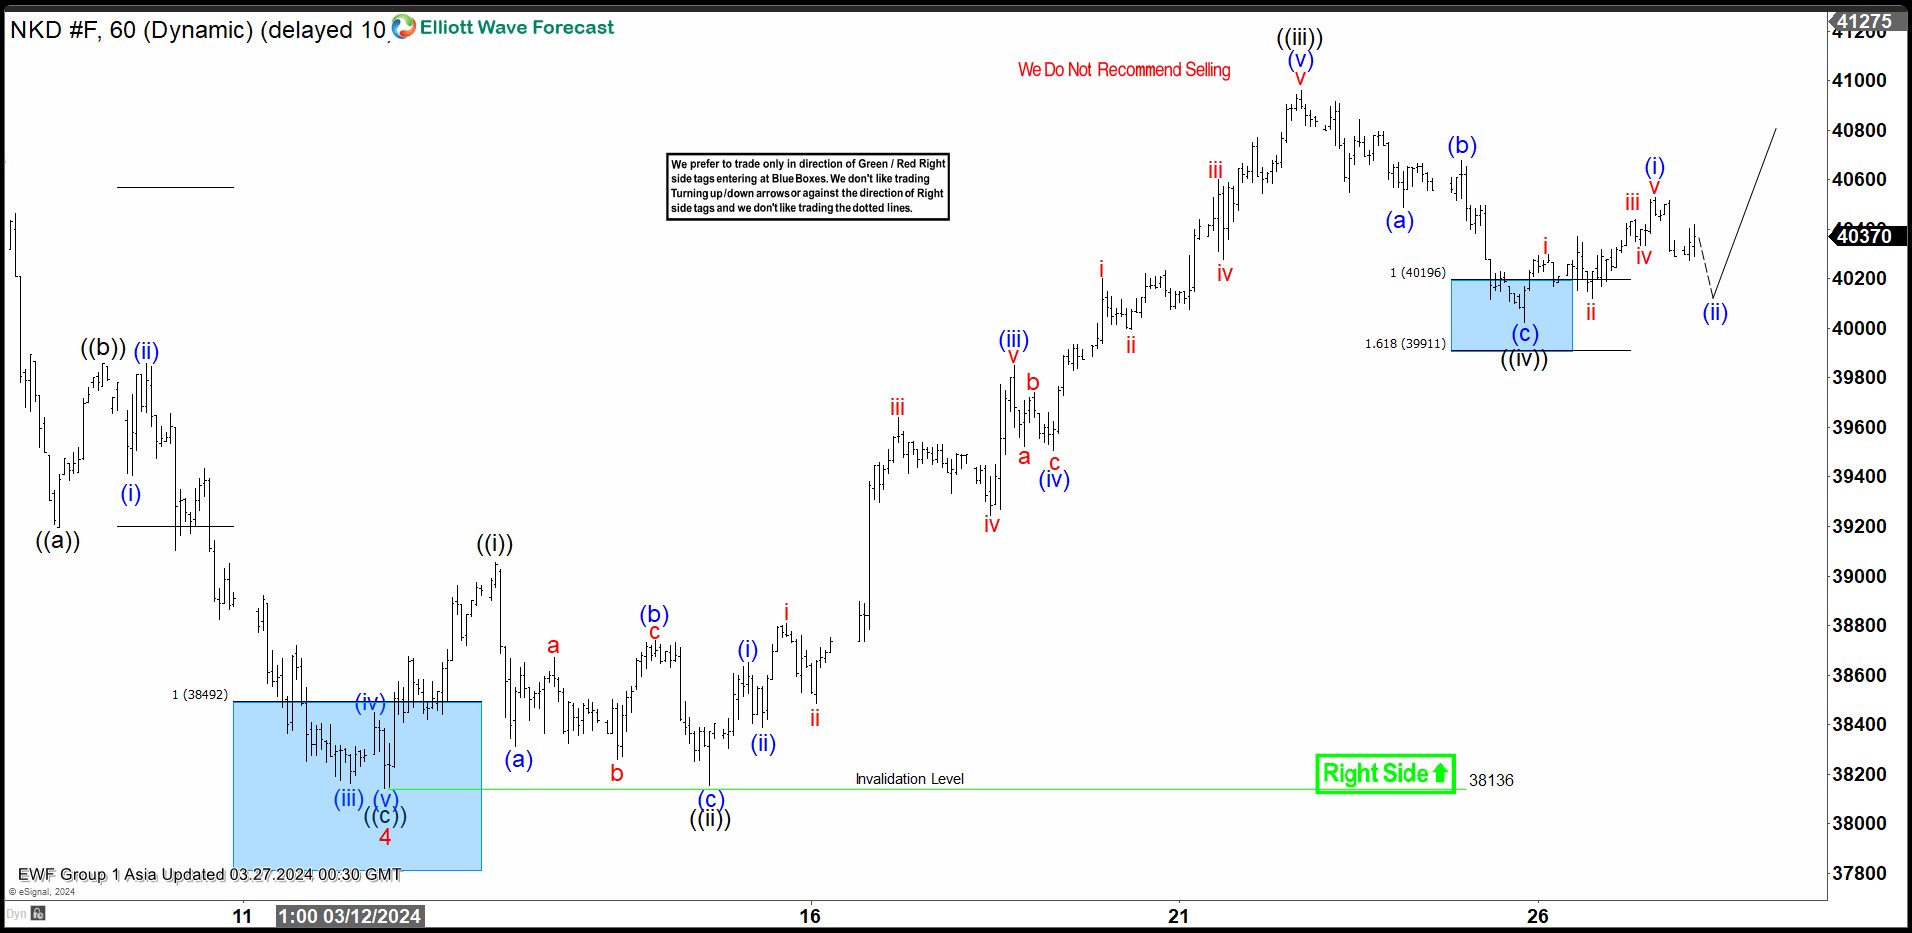
Nikkei (NKD_F) Looking to End Impulsive Rally
Read MoreNikkei (NKD_F) is looking to complete 5 waves impulse structure and should see further upside. This article and video look at the Elliott Wave path.
-

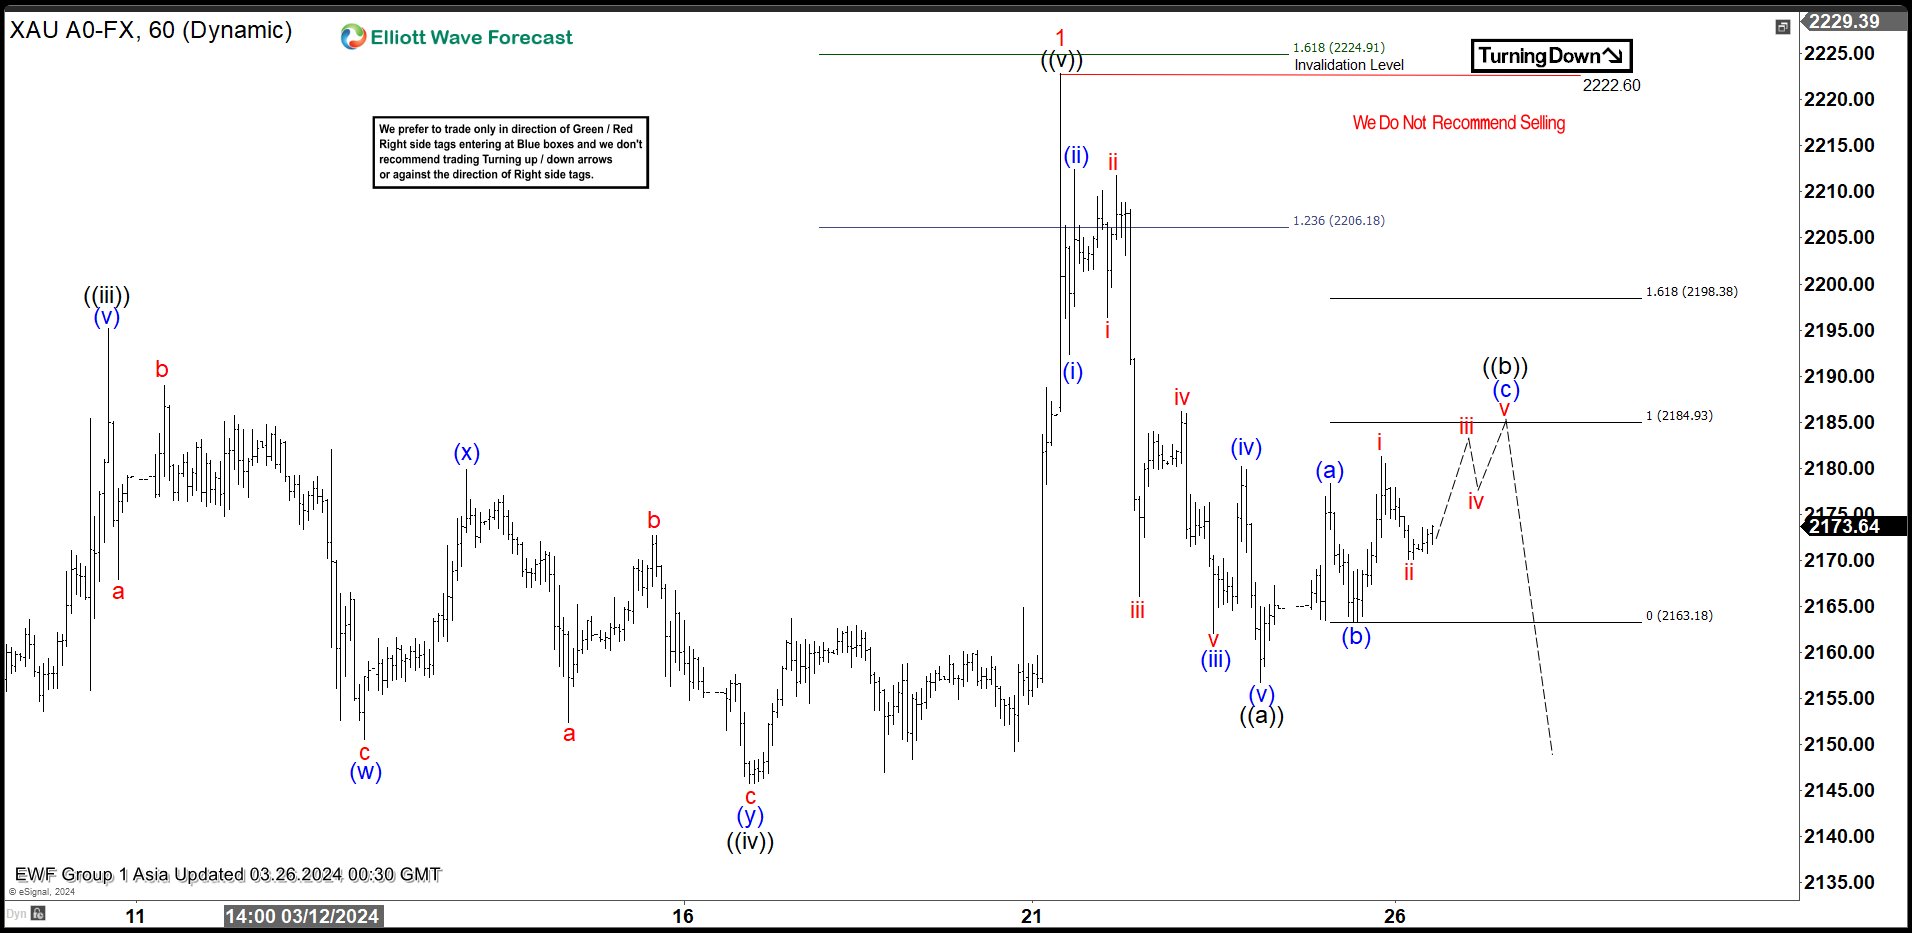
Gold (XAUUSD) Looking to do Larger Degree Correction
Read MoreGold (XAUUSD) is looking to do larger degree correction against cycle from 12.13.2023 low. This article and video look at the Elliott Wave path.
