
The Power of 3-7-11 and the Grand Super Cycle: How We Saw the Bullish Turn in April 2025 Back on April 9, 2025, while World Indices were dropping sharply and global sentiment had turned overwhelmingly bearish, we published an article that challenged the fear-driven narrative. We explained why selling was not the right approach and […]
-

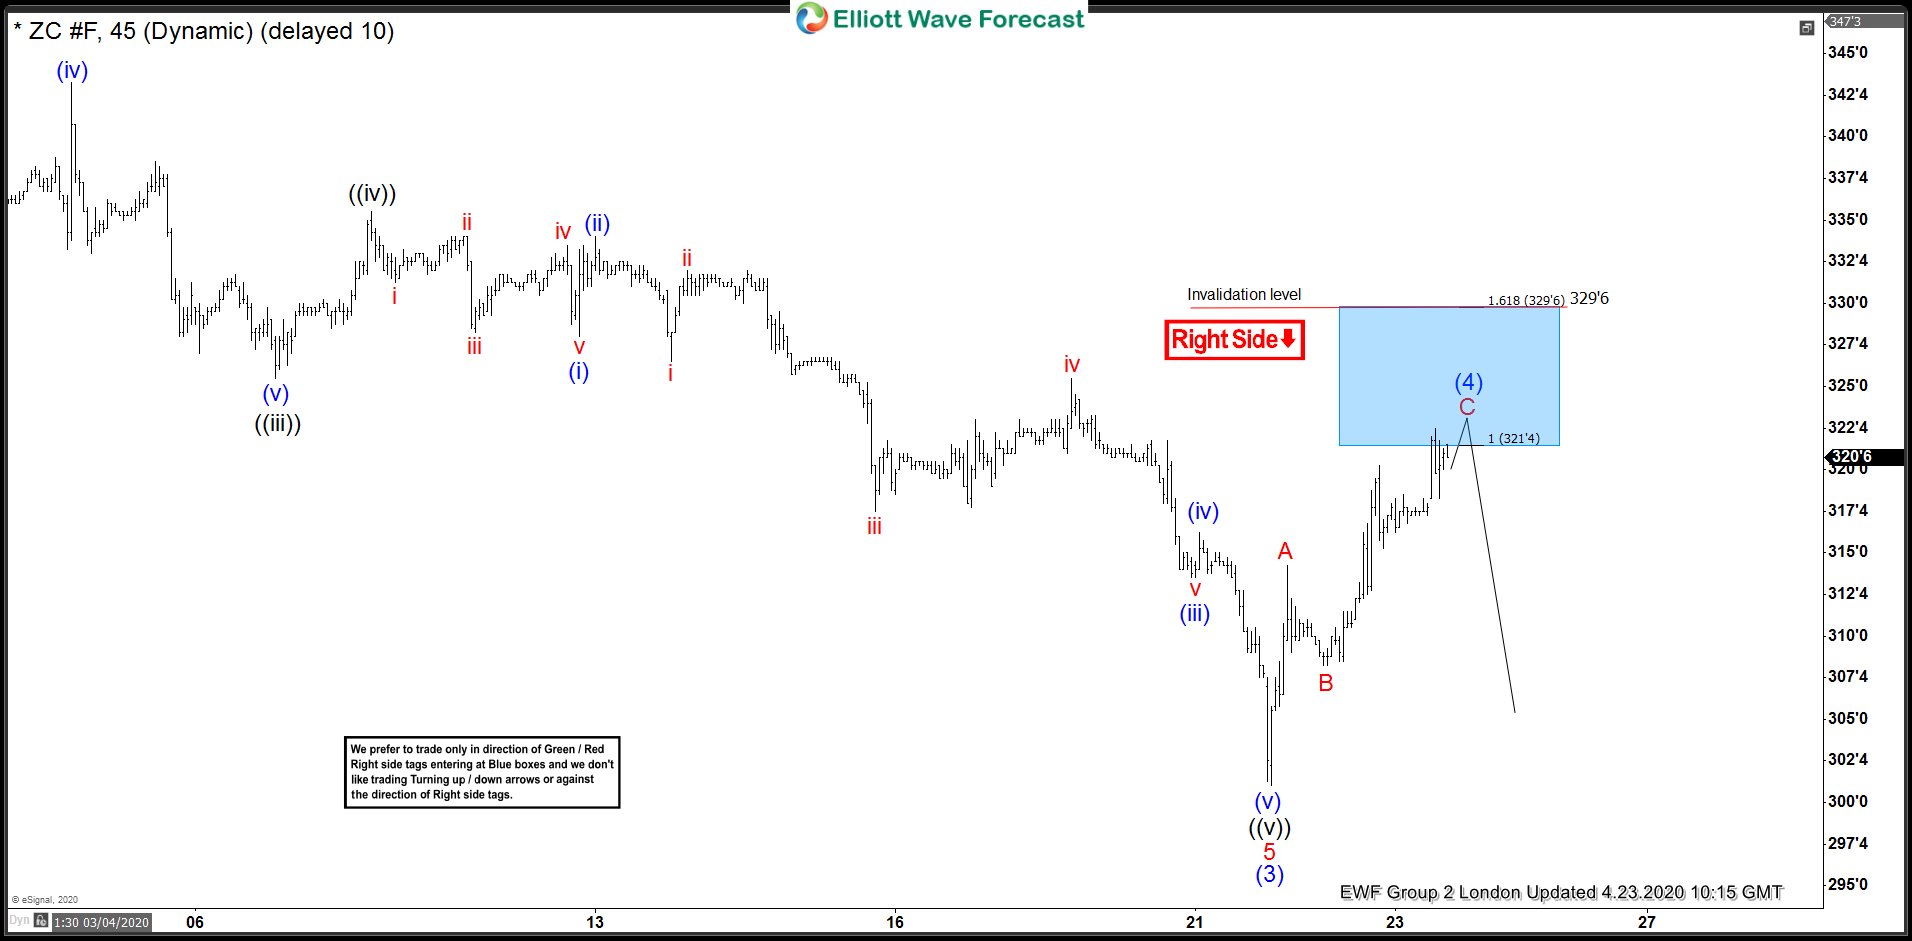
Selling Corn Futures (ZC_F) Rally In The Blue Box
Read MoreCorn Futures (ZC_F) dropped from a high of 323’4 to a low of 300’2 last week before it bounced again. In today’s blog, we would look at the chart presented to clients before the drop took place and how once again, the blue box area and red right side tag played out. Let’s start by […]
-

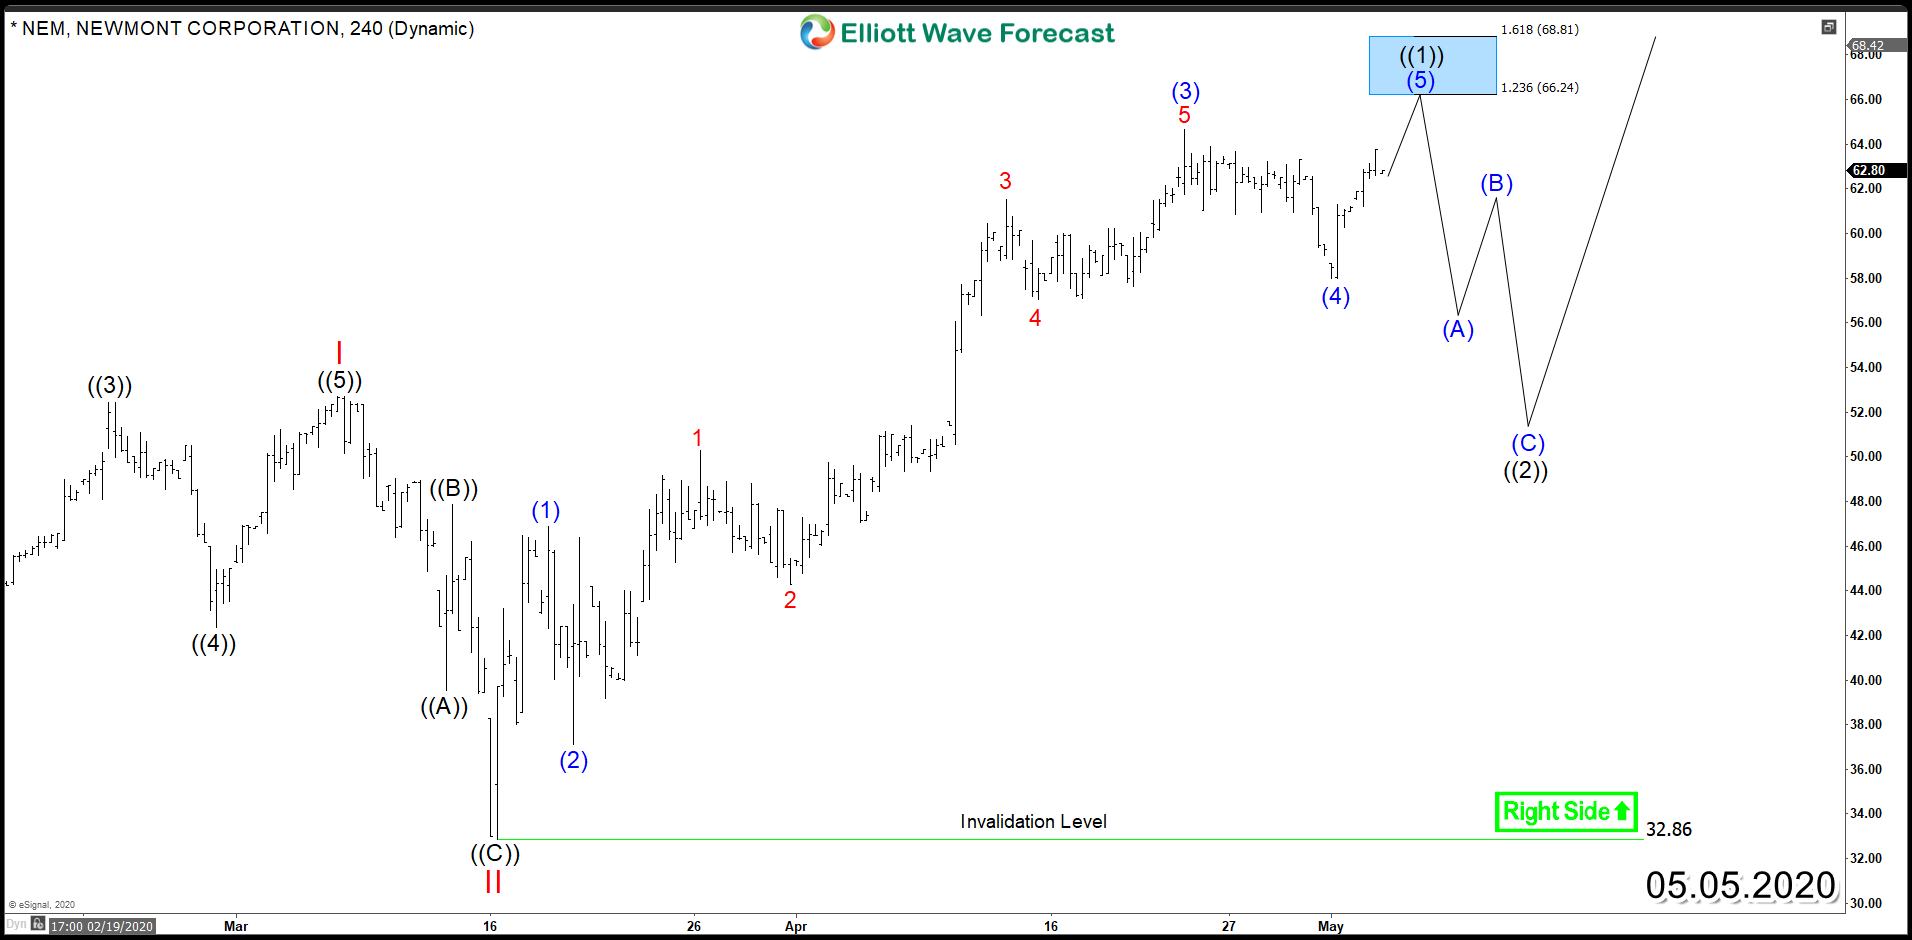
Newmont Corporation (NYSE: NEM) – Impulsive Bullish Structure
Read MoreNewmont Corporation (NYSE: NEM) is the world’s largest Gold mining company. Since the major low in the precious metal back in 2015 around $1050, many mining stocks rallied significantly and managed to outperform shining metals. If we take a look at this year’s data, NEM is currently up 45% while GOLD is 11% which gives an […]
-

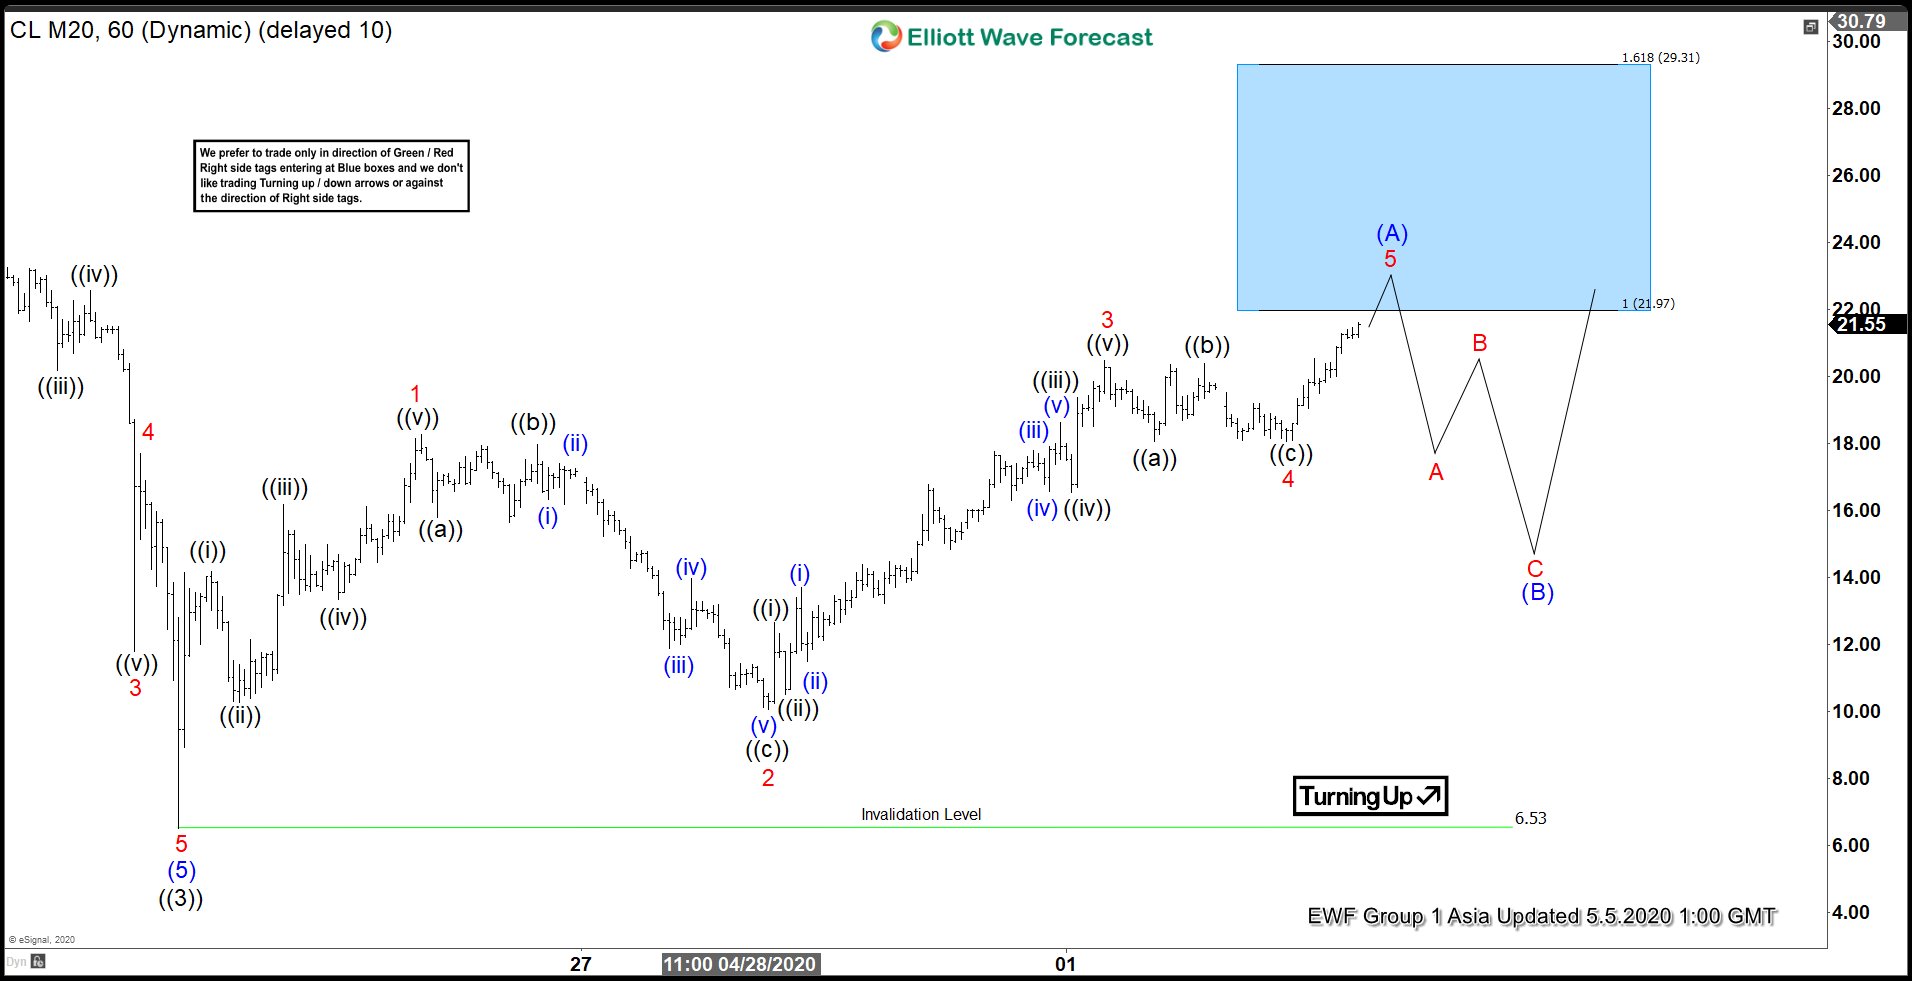
Elliott Wave View: Leading Diagonal in Oil
Read MoreOil shows 5 waves rally from 4.22.2020 low as a leading diagonal, favoring more upside. This article & video looks at the Elliott Wave path.
-

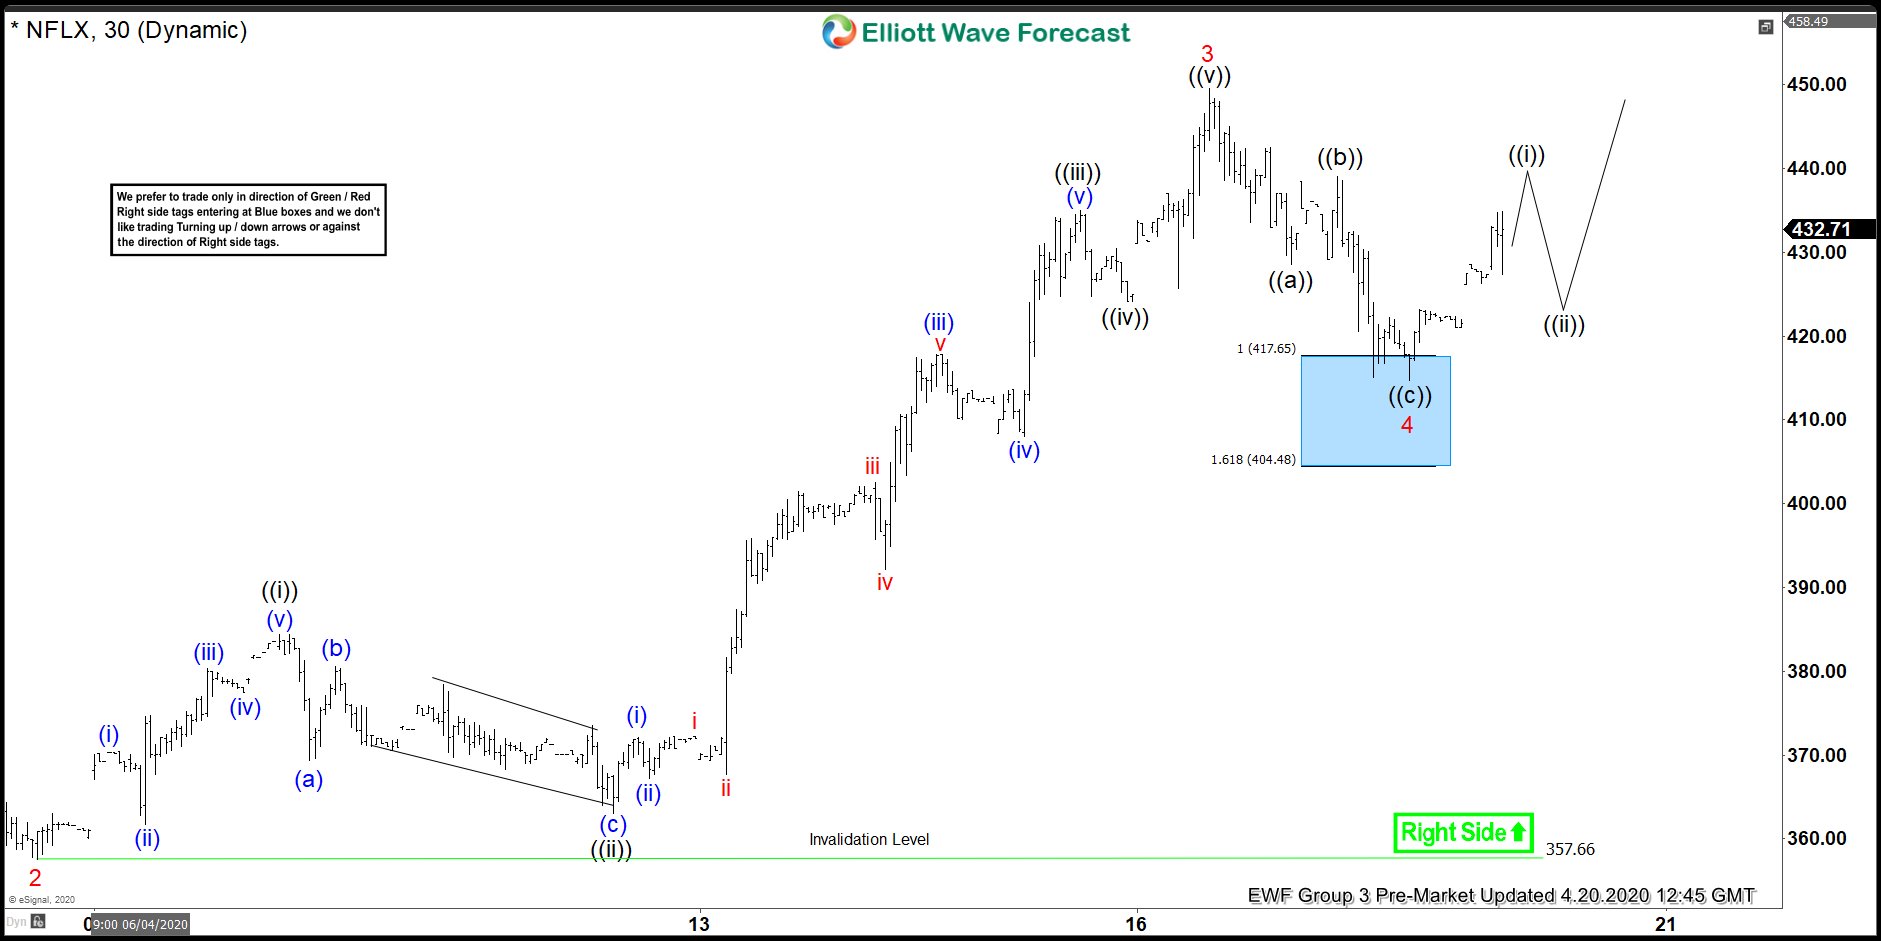
NFLX Ended 5 Waves Up In From The 290.47 Low
Read MoreHello fellow traders. In this technical blog we’re going to take a quick look at the Elliott Wave charts of NETFLIX (NFLX) stock, published in members area of the website. As our members know, NETFLIX made New All-time high recently. The price has been showing impulsive structure in the cycle from the 290.47 low. Consequently […]