
The Power of 3-7-11 and the Grand Super Cycle: How We Saw the Bullish Turn in April 2025 Back on April 9, 2025, while World Indices were dropping sharply and global sentiment had turned overwhelmingly bearish, we published an article that challenged the fear-driven narrative. We explained why selling was not the right approach and […]
-

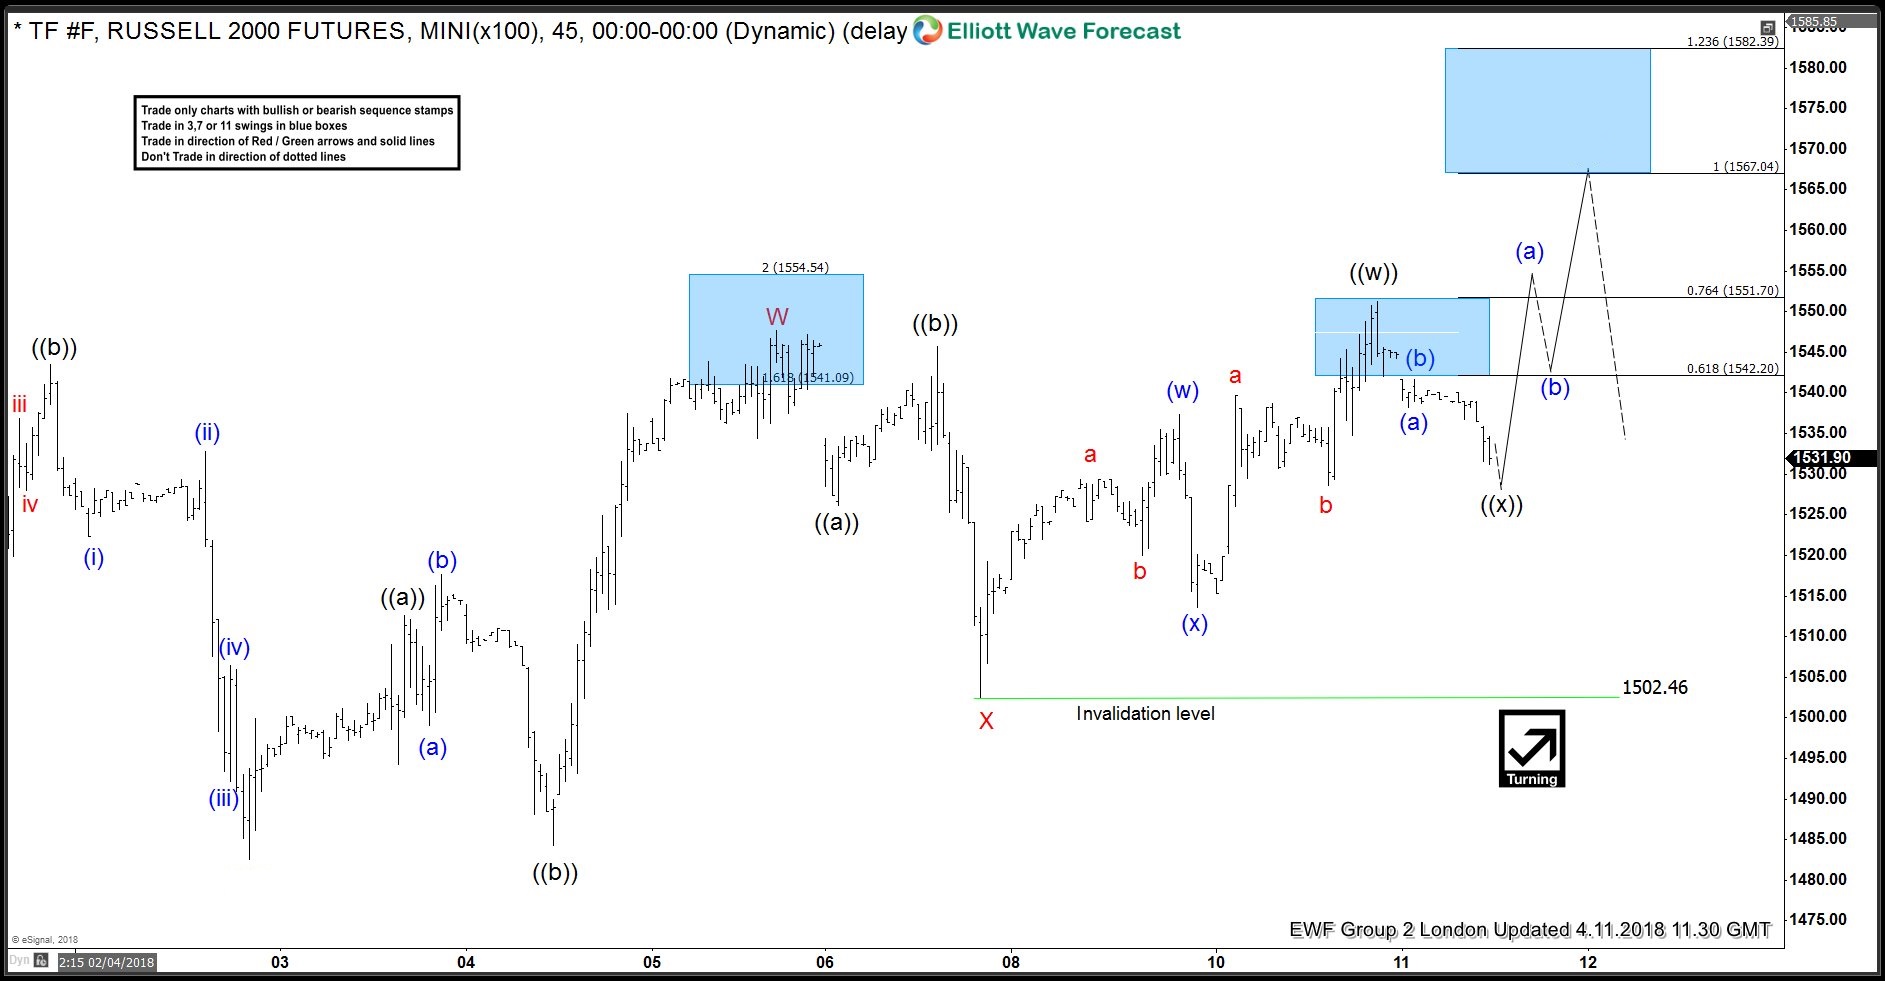
Elliott Wave Analysis: Calling The Double Correction In Russell
Read MoreIn this blog, I will show you some short-term Elliott Wave charts of Russell which we presented to our members in the past. Down below, you see the 1-hour updated chart presented to our clients on the 04/11/18 calling for more upside in a Double Elliott Wave correction in red W-X. Russell ended the cycle from […]
-

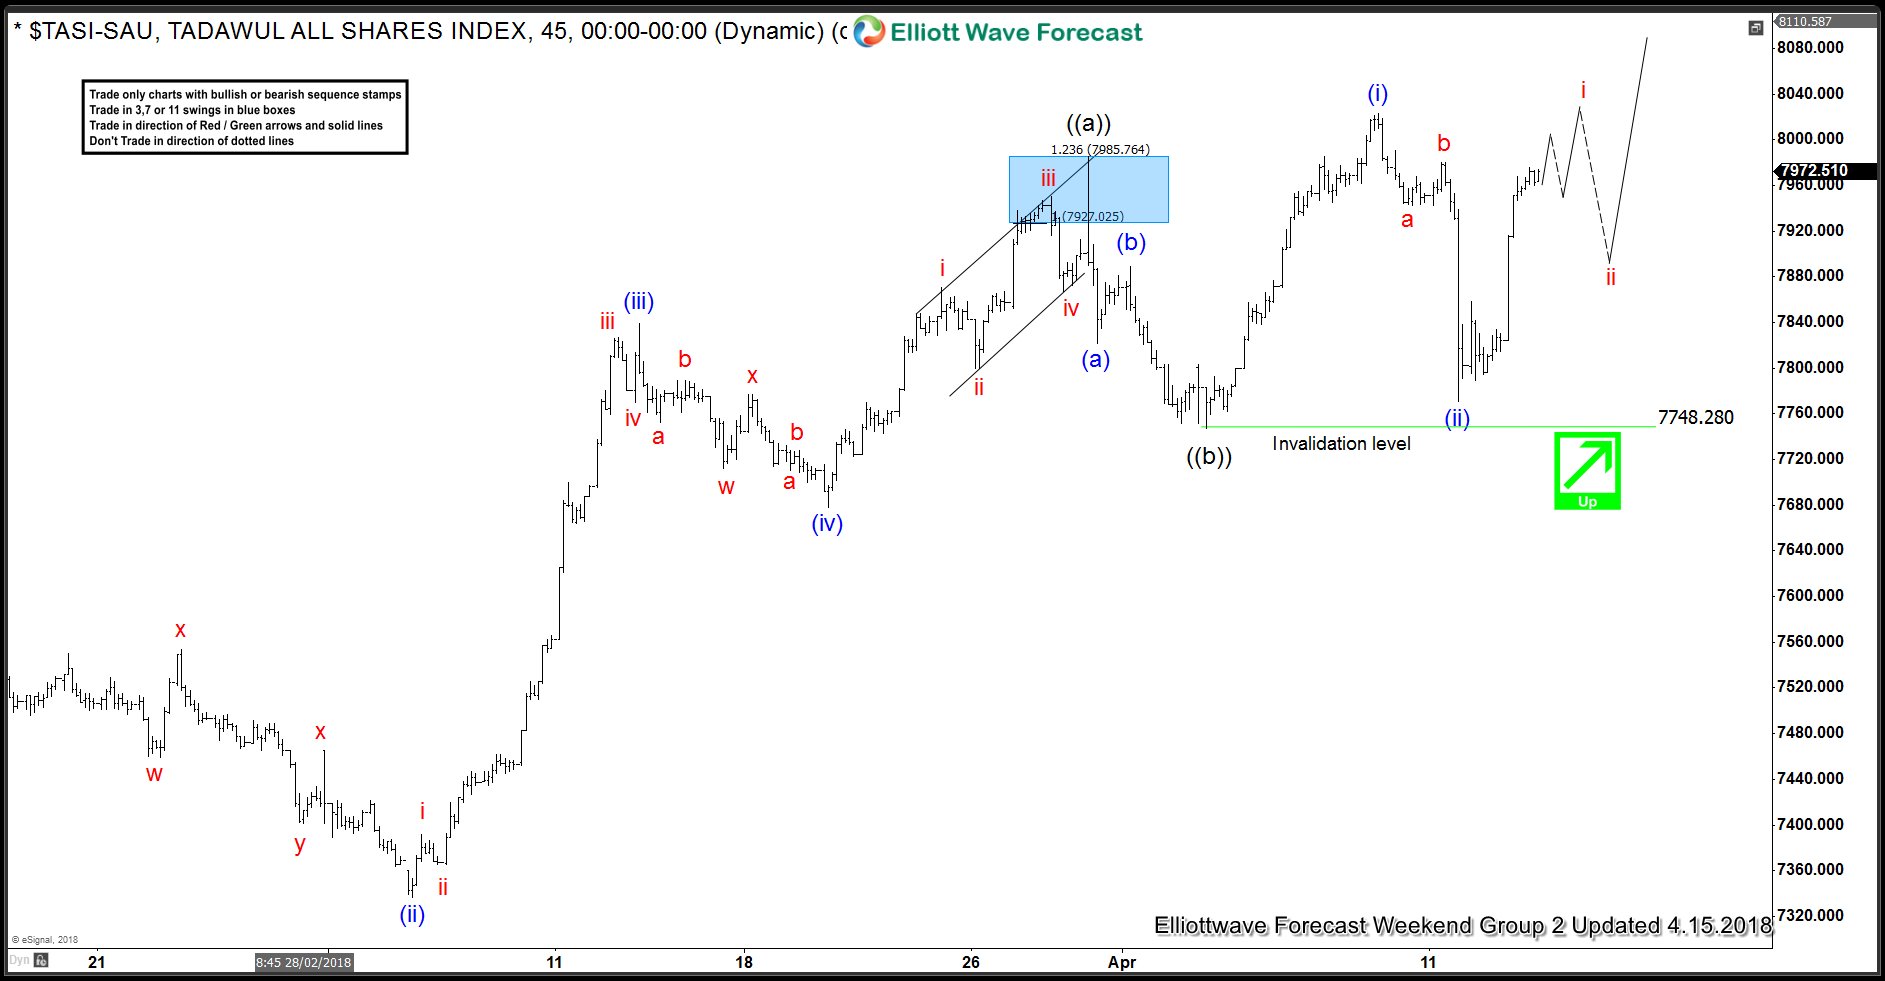
Elliott Wave Analysis: TASI (Tadawul All Shares) Calling Strength Higher
Read MoreTASI (Tadawul All Shares) an index from Saudi Arabia Elliott Wave Analysis suggests that the cycle from 11/21/2017 is showing higher high sequence. Calling for more upside extension towards 8259.82-8484.56 area next before it ends that cycle and starts the pullback. So now let’s take a look at the shorter cycles from February 11.2018 low. Which showed […]
-

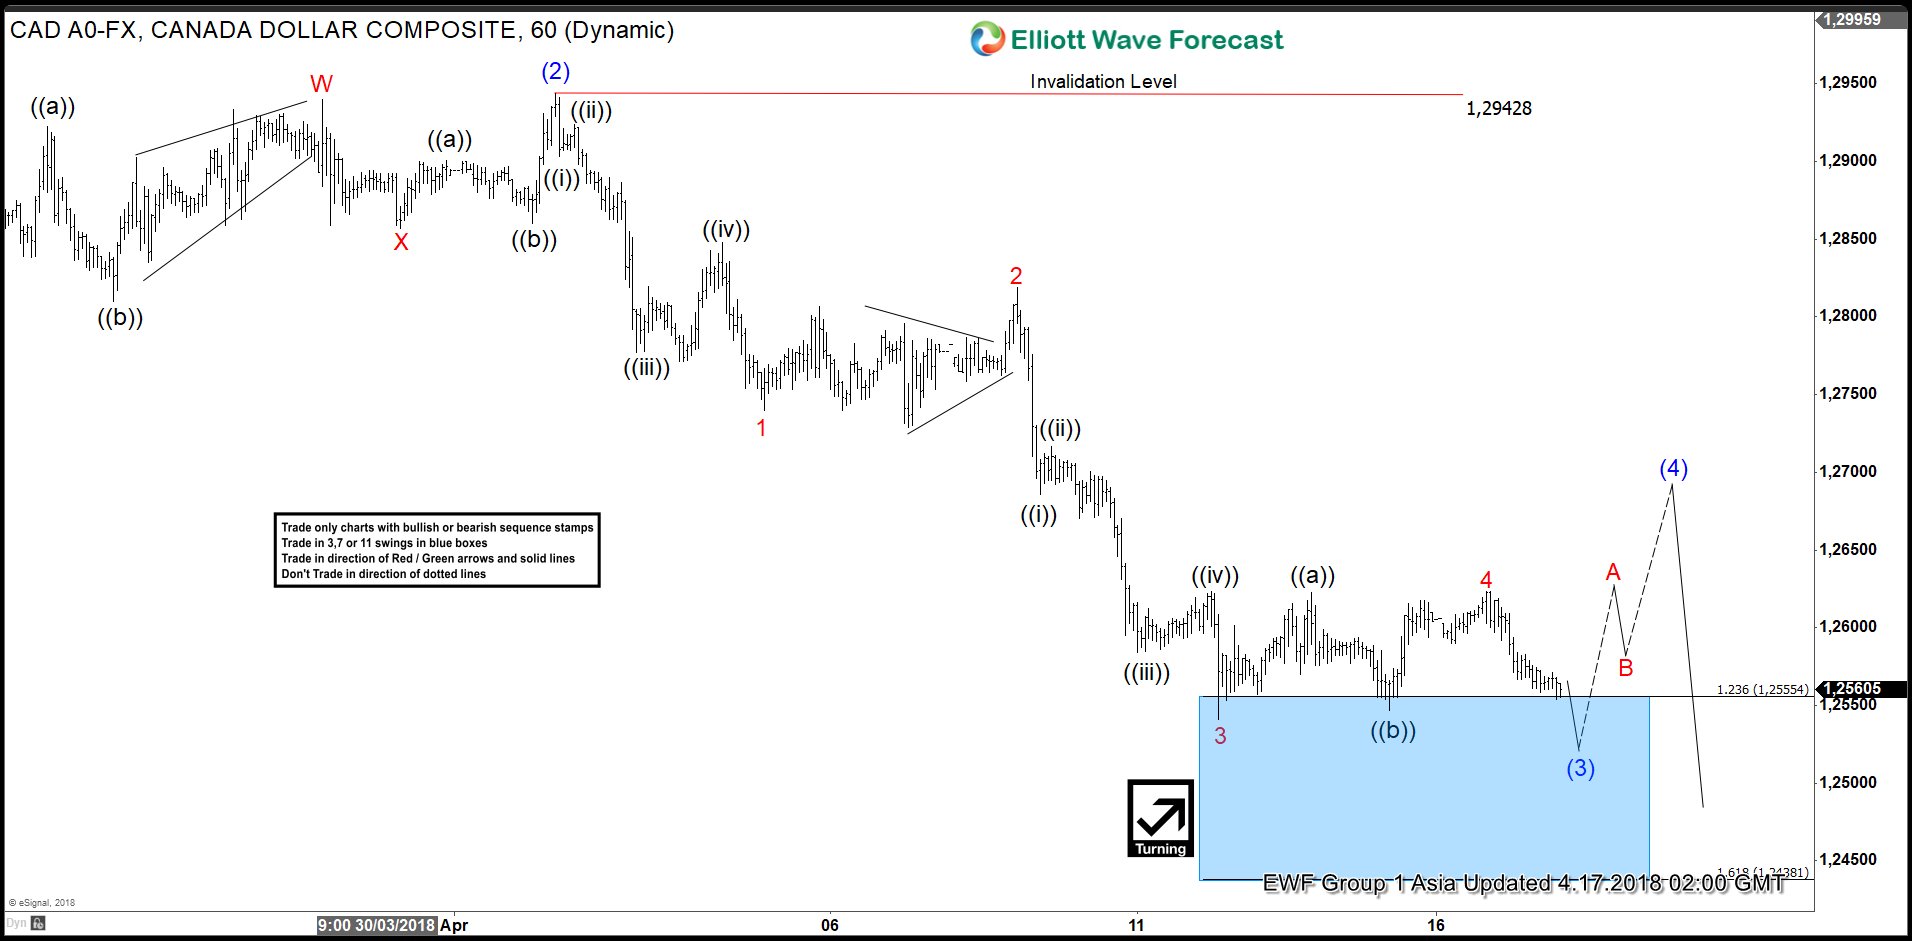
USDCAD Elliott Wave View: Calling Intraday Bounce
Read MoreUSDCAD Elliott Wave short-term view suggests that the bounce to 1.2942 high ended Intermediate degree wave (2). Then the decline from there is unfolding in an impulse sequence with an internal sub-division of each leg lower is showing 5 waves structure thus favored it to be an impulse. Below from 1.2942 high, Intermediate wave (3) […]
-

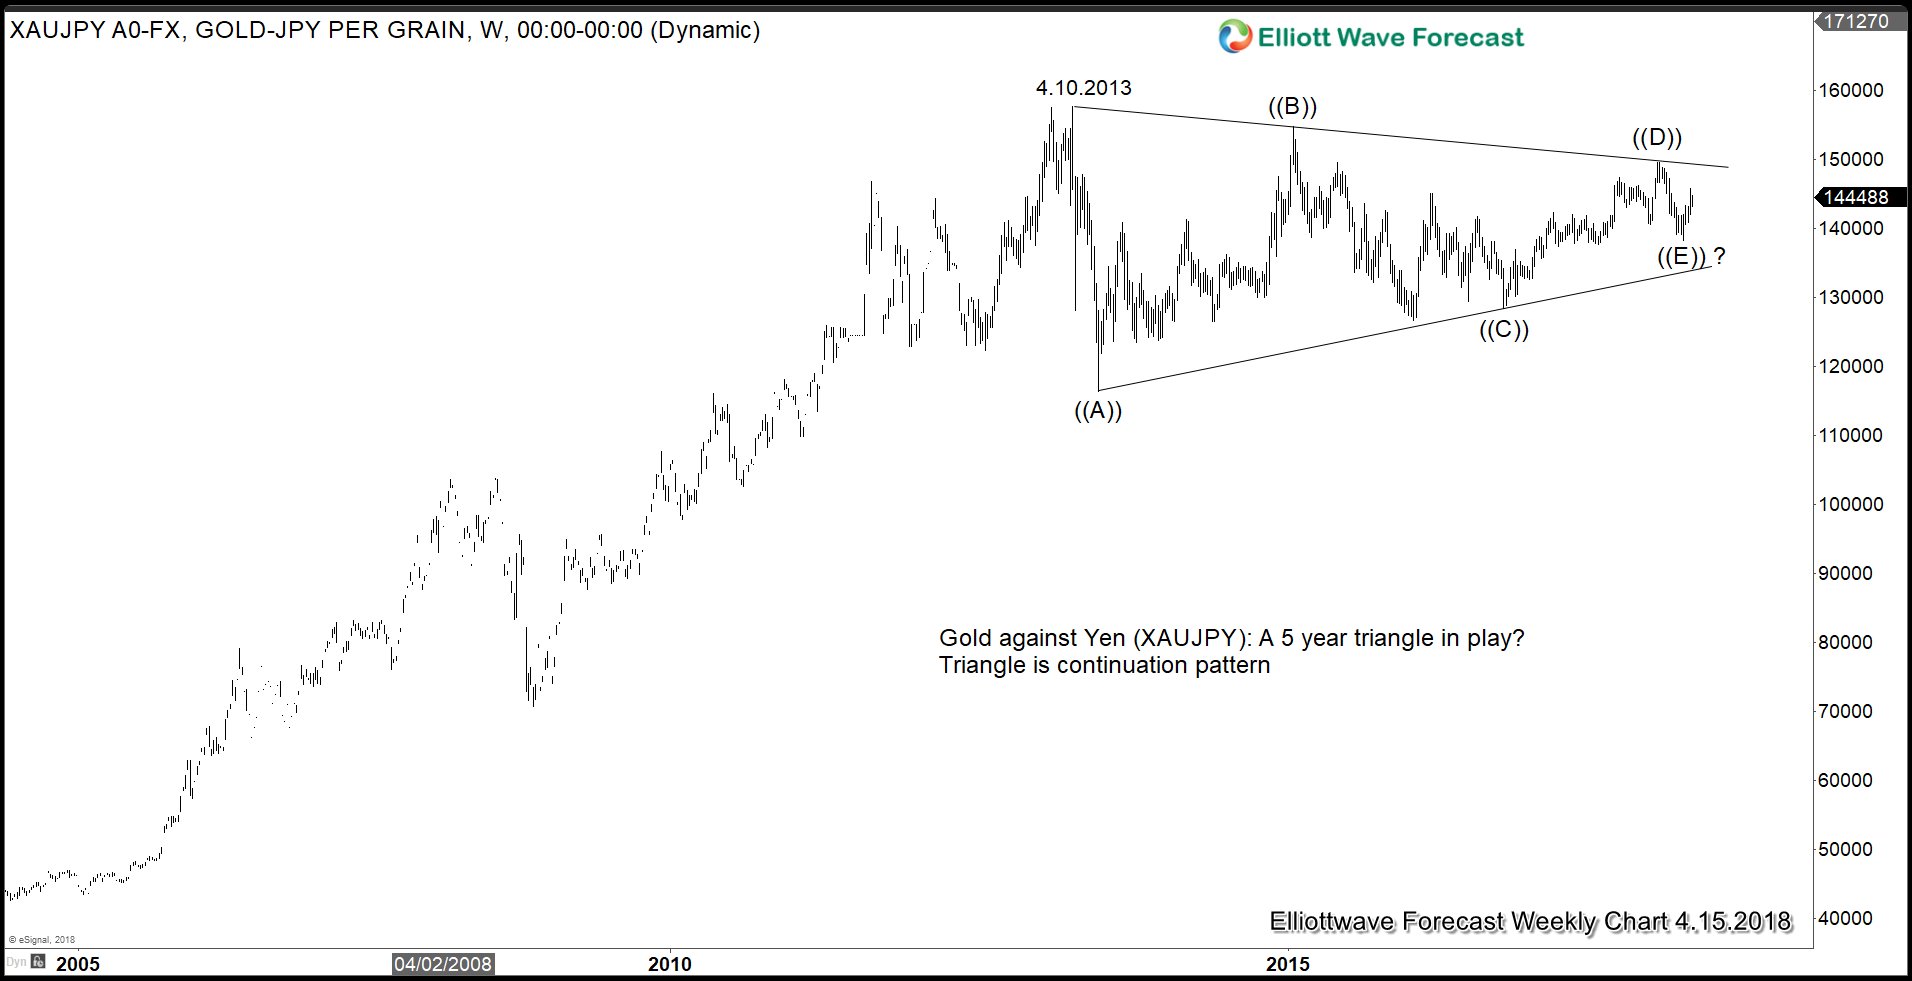
Geopolitical Tension Could Be Catalyst for Gold’s Rally
Read MoreRising Geopolitical Tension between U.S. and Russia The geopolitical tension between the United States and Russia escalated rapidly in the past two weeks. Two weeks ago, the U.S. Treasury Department announced fresh sanctions against Russian oligarchs and companies due to “Russia’s malign activity around the globe”. This new sanctions have caused economic pain to Moscow […]