
-
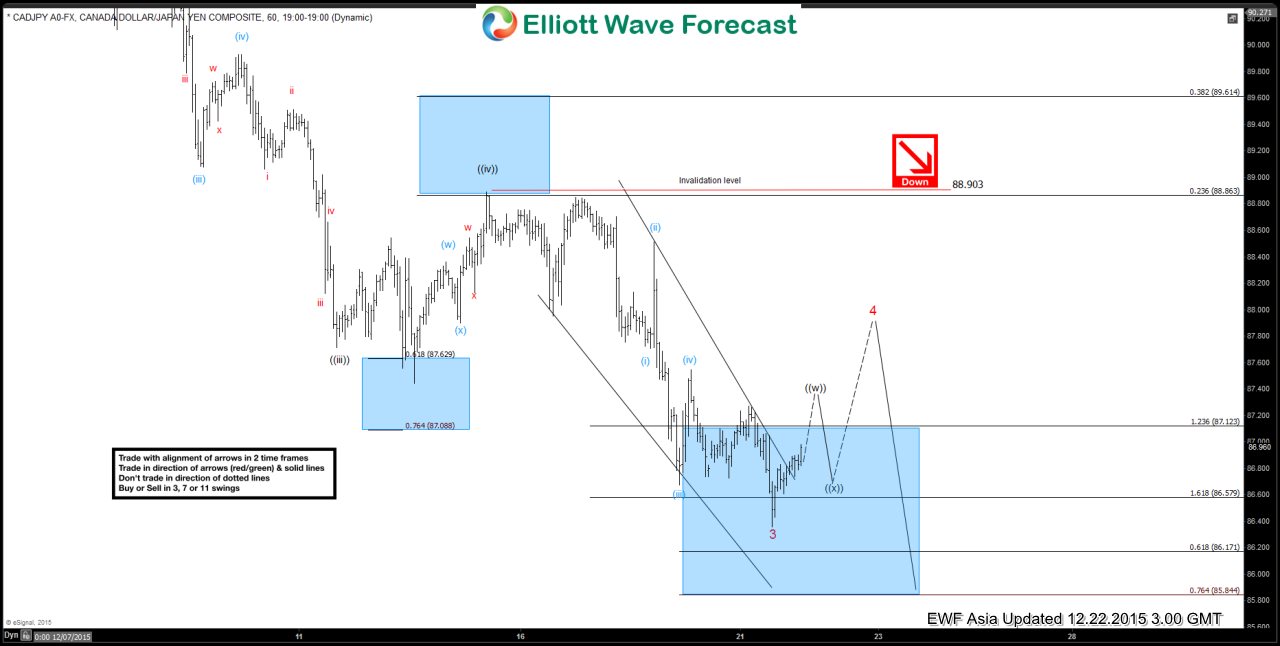
CADJPY Short Term Elliott Wave Analysis 12.22.2015
Read MoreShort term Elliott Wave cycle suggests decline to 86.35 ended wave 3. From this level, pair has started wave 4 bounce in 3 swing and ideally reach 87.6 – 88 area before the decline resumes. As far as wave ((iv)) pivot at 88.9 stays intact, pair is expected to resume lower once wave 4 bounce is complete. […]
-
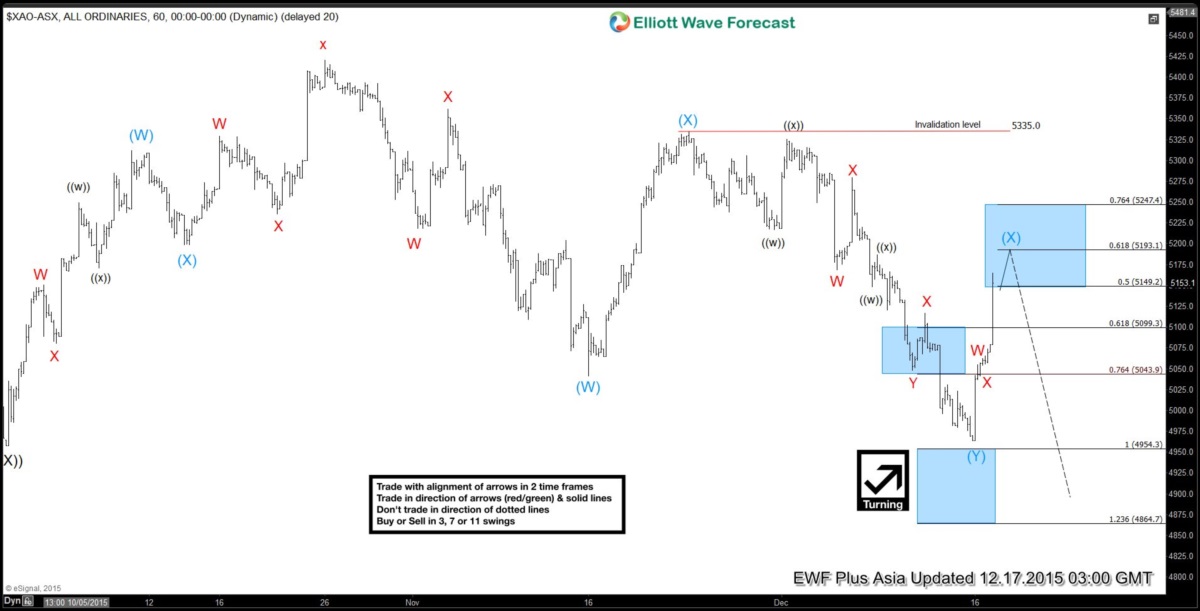
ASX All Ordinary Short Term Elliott Wave Analysis 12.17.2015
Read MoreShort term Elliott Wave cycle suggests rally to 5420 on 10/23 ended wave “x”. From this level, Index has turned lower in wave ((W)) with the internal unfolding as a triple three structure where wave (W) ended at 5041 and wave (X) ended at 5334, wave (Y) ended at 4963, and second wave (X) bounce is […]
-
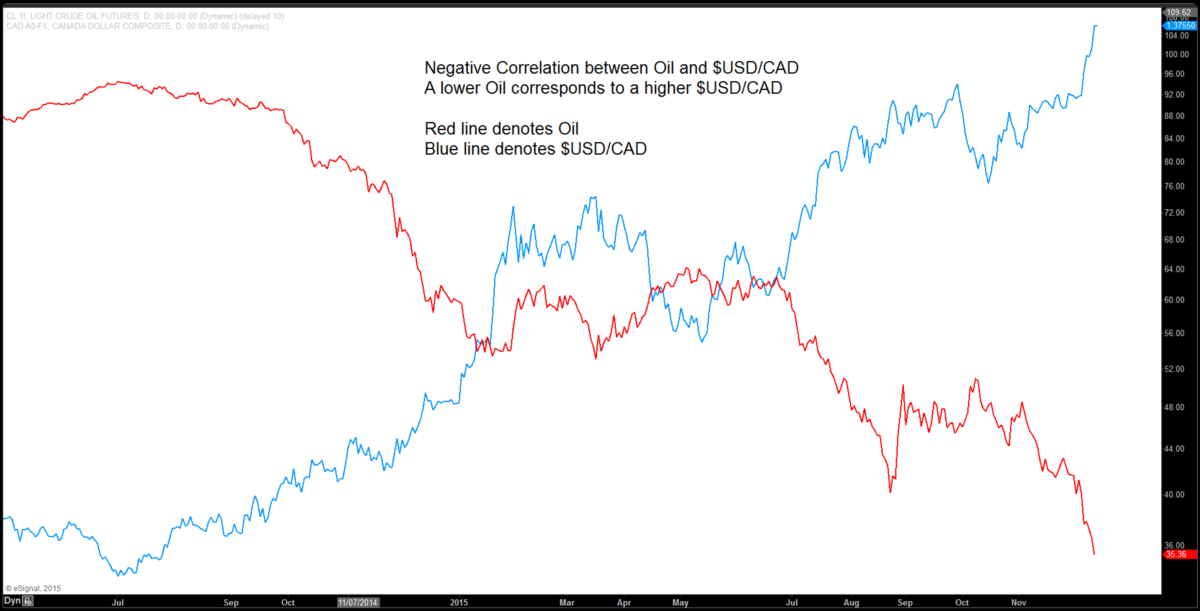
What OPEC decision means to Oil and $USDCAD
Read MoreCorrelation between Oil and $USDCAD One of the biggest trades in 2014 – 2015 is undeniably Oil and the correlated commodity currency Canadian dollar, or sometimes called Loonie. For some reasons, most Americans typically associate big crude oil exporters with Persian Gulf countries like Iraq, Kuwait, or Saudi Arabia. However, in reality, majority of crude oil consumed in the […]
-
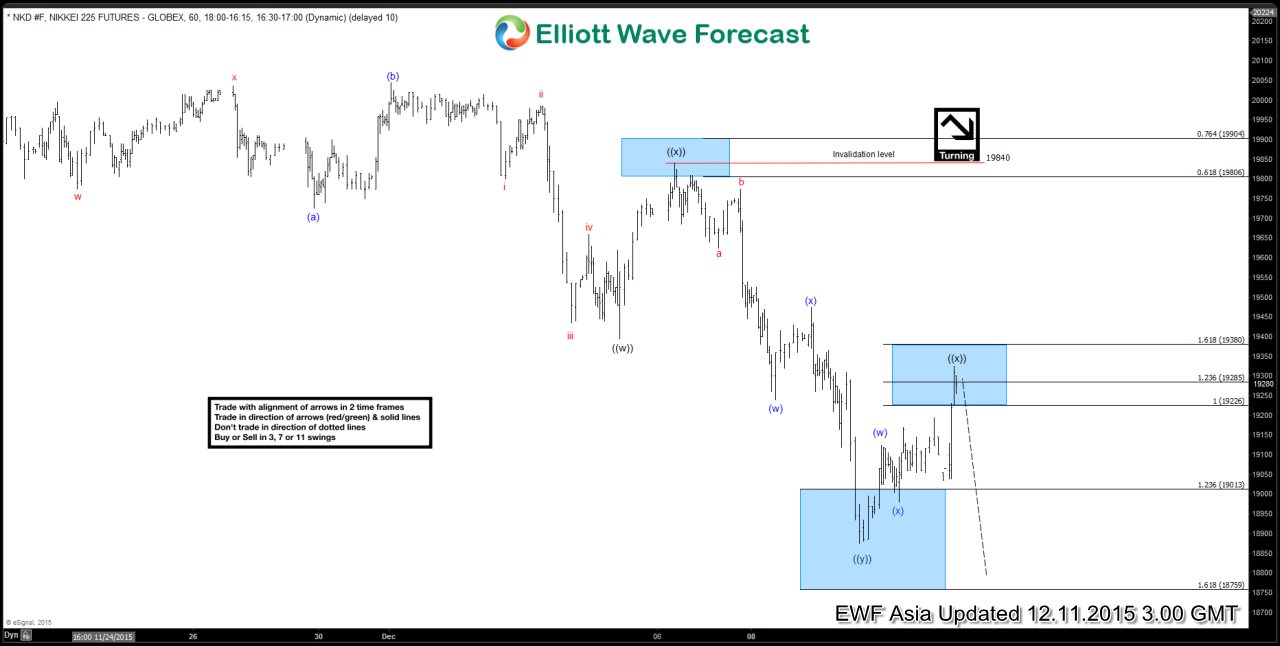
Nikkei Short Term Elliott Wave Update 12.11.2015
Read MoreShort term Elliott Wave cycle suggests rally to 20060 ended wave ((X)). From this level, Index has turned lower and reached 100% equal leg, therefore the cycle is mature. However, in the short term, the Index still can extend lower as far as 19844 pivot stays intact. Decline from 20060 is unfolding as a triple three structure where […]
-
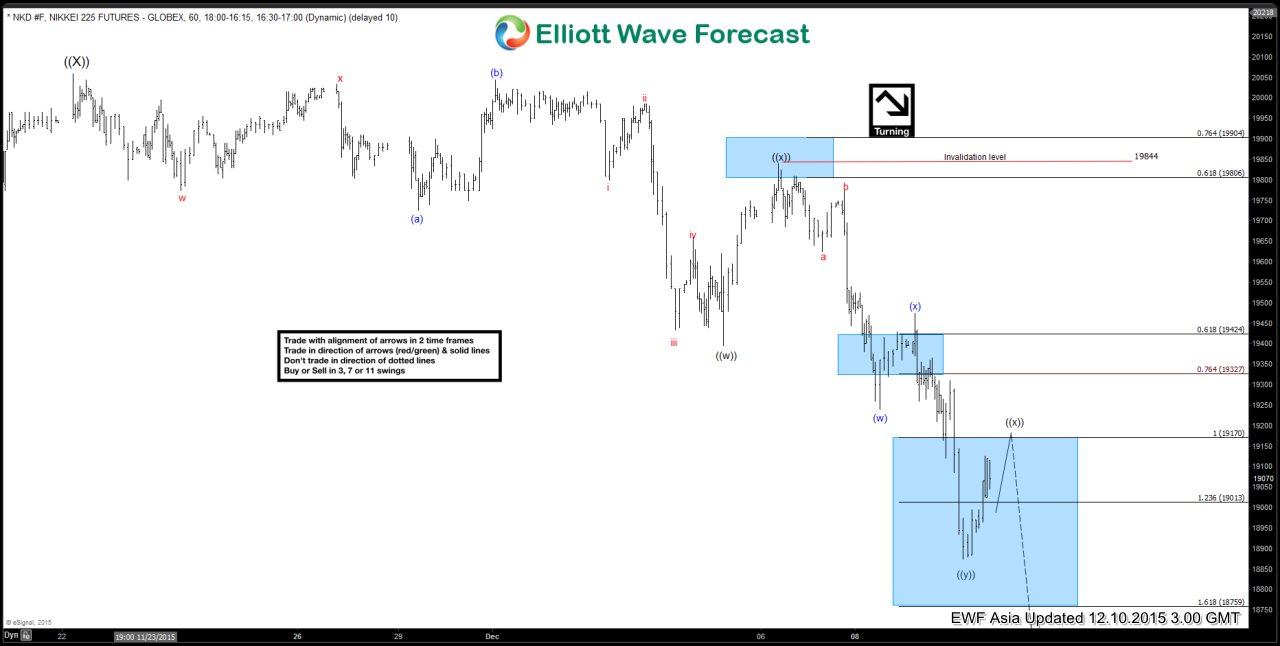
Nikkei Short Term Elliott Wave Update 12.10.2015
Read MoreShort term Elliott Wave cycle suggests rally to 20060 ended wave ((X)). From this level, Index has turned lower and reached 100% equal leg, therefore the cycle is mature. However, in the short term, the Index still can extend lower as far as 19844 pivot stays intact. Decline from 20060 is unfolding as a triple three structure where […]
-
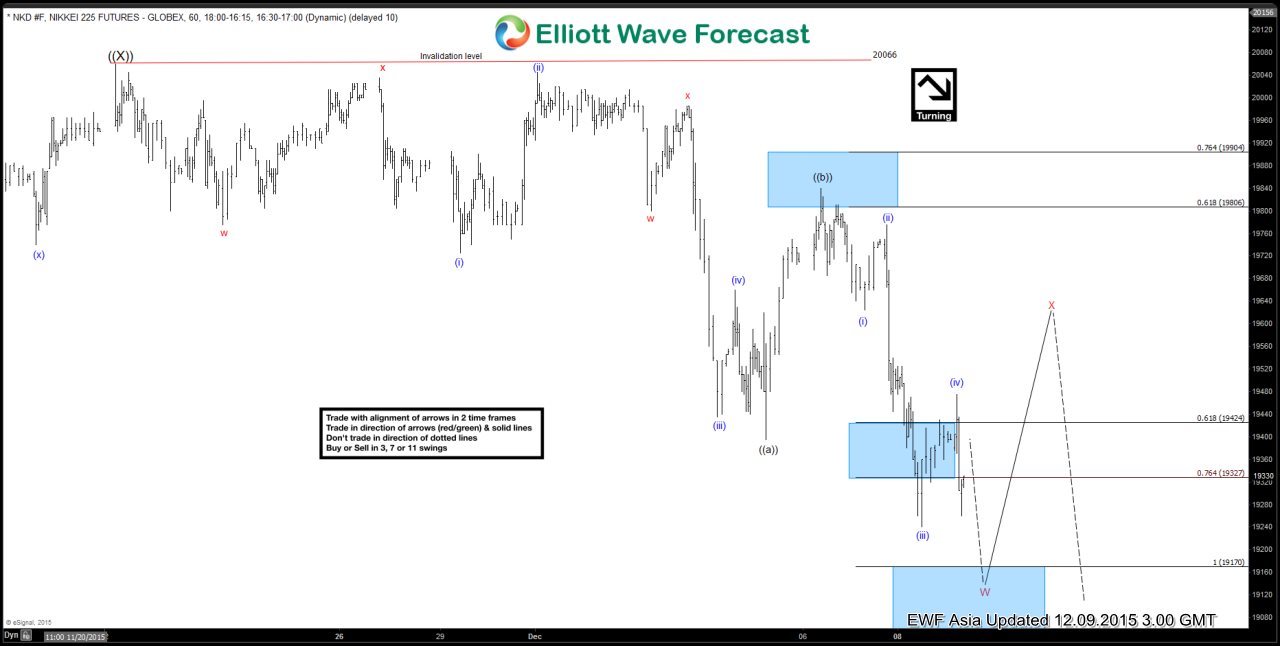
Nikkei Short Term Elliott Wave Update 12.9.2015
Read MoreRevised short term Elliott Wave cycle suggests rally to 20060 ended wave ((X)). From this level, Index has turned lower in wave W with internal as a zigzag structure where wave ((a)) ended at 19395, wave ((b)) ended at 19840, and wave ((c)) lower is in progress as 5 waves. Near term, wave ((c)) of W is expected to […]