
-
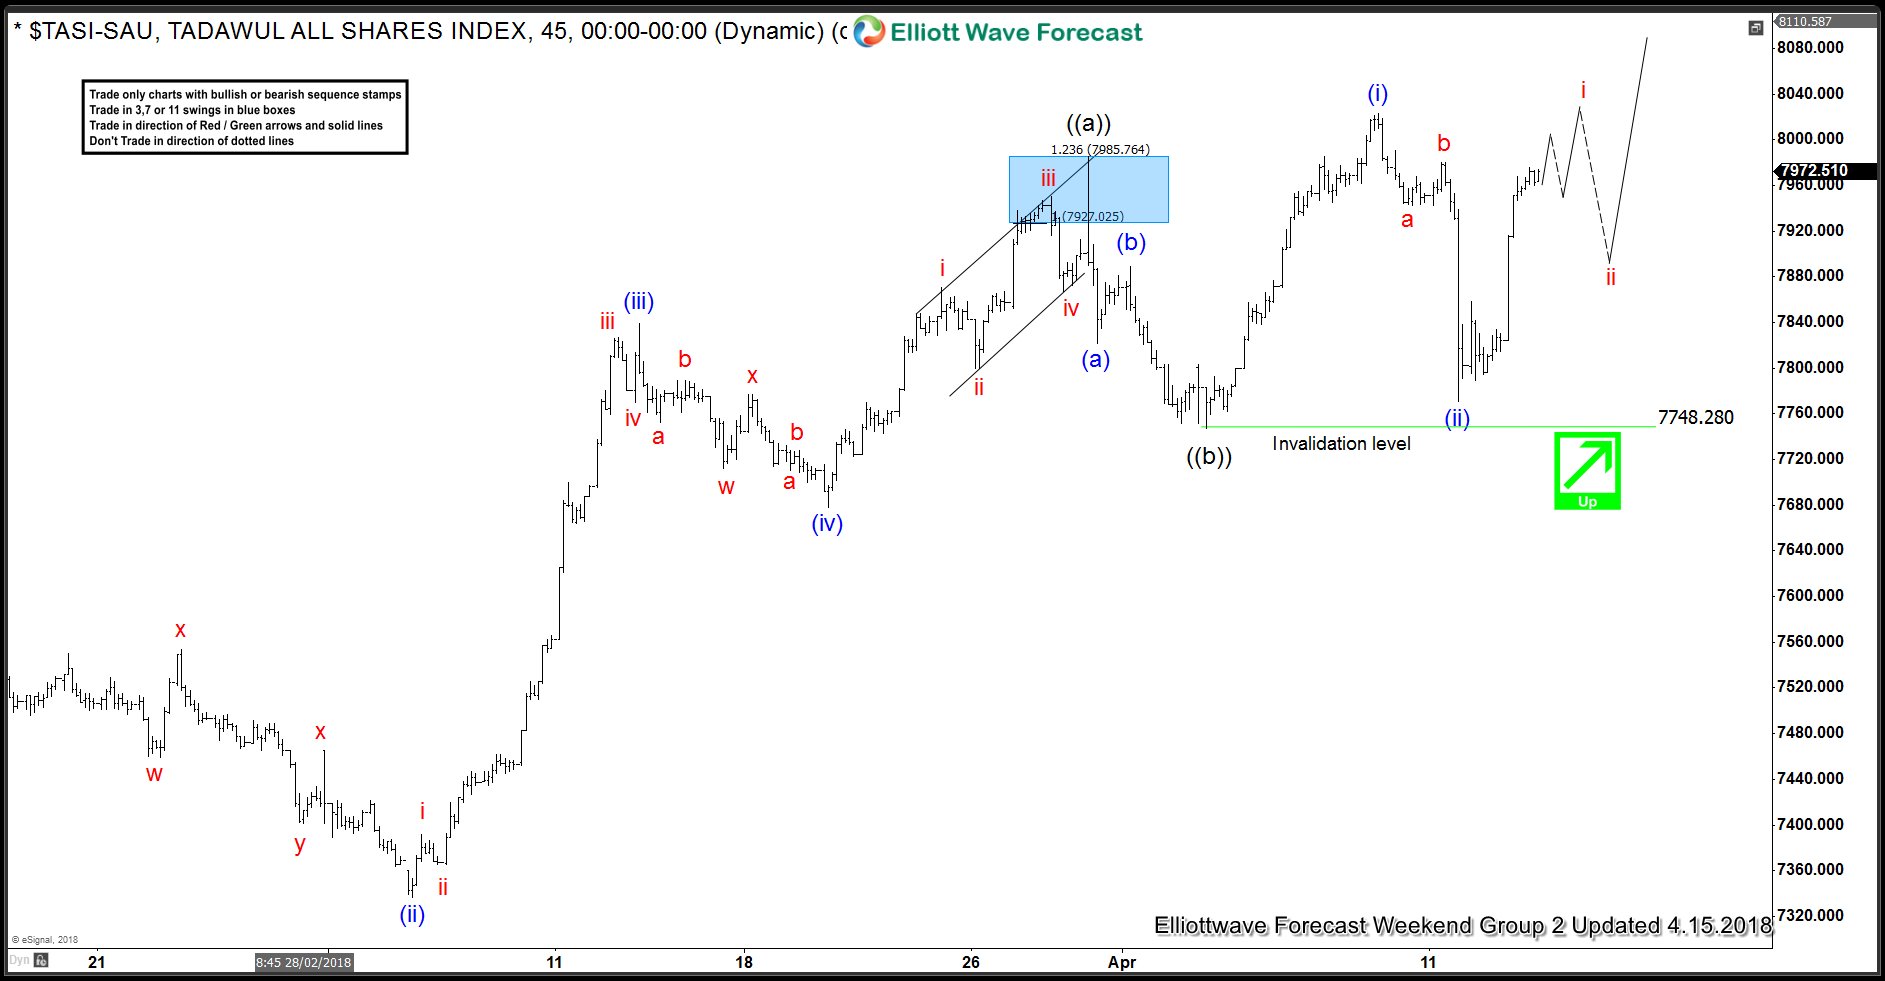
Elliott Wave Analysis: TASI (Tadawul All Shares) Calling Strength Higher
Read MoreTASI (Tadawul All Shares) an index from Saudi Arabia Elliott Wave Analysis suggests that the cycle from 11/21/2017 is showing higher high sequence. Calling for more upside extension towards 8259.82-8484.56 area next before it ends that cycle and starts the pullback. So now let’s take a look at the shorter cycles from February 11.2018 low. Which showed […]
-
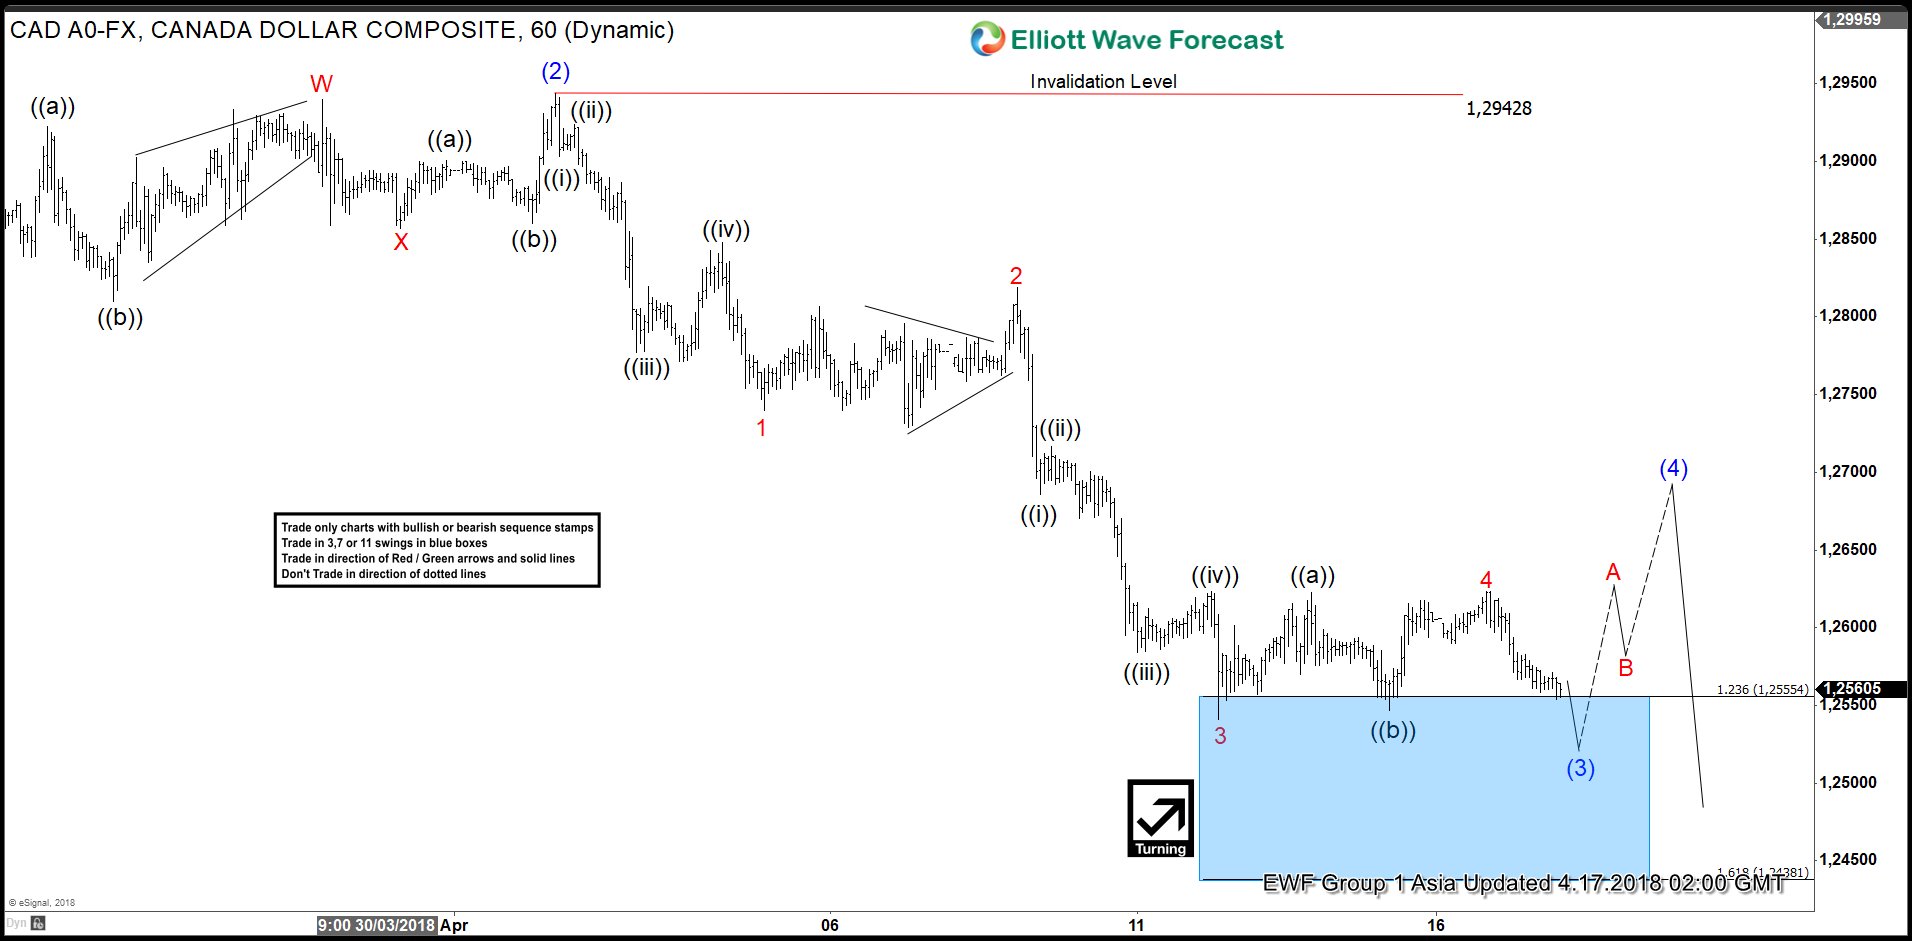
USDCAD Elliott Wave View: Calling Intraday Bounce
Read MoreUSDCAD Elliott Wave short-term view suggests that the bounce to 1.2942 high ended Intermediate degree wave (2). Then the decline from there is unfolding in an impulse sequence with an internal sub-division of each leg lower is showing 5 waves structure thus favored it to be an impulse. Below from 1.2942 high, Intermediate wave (3) […]
-
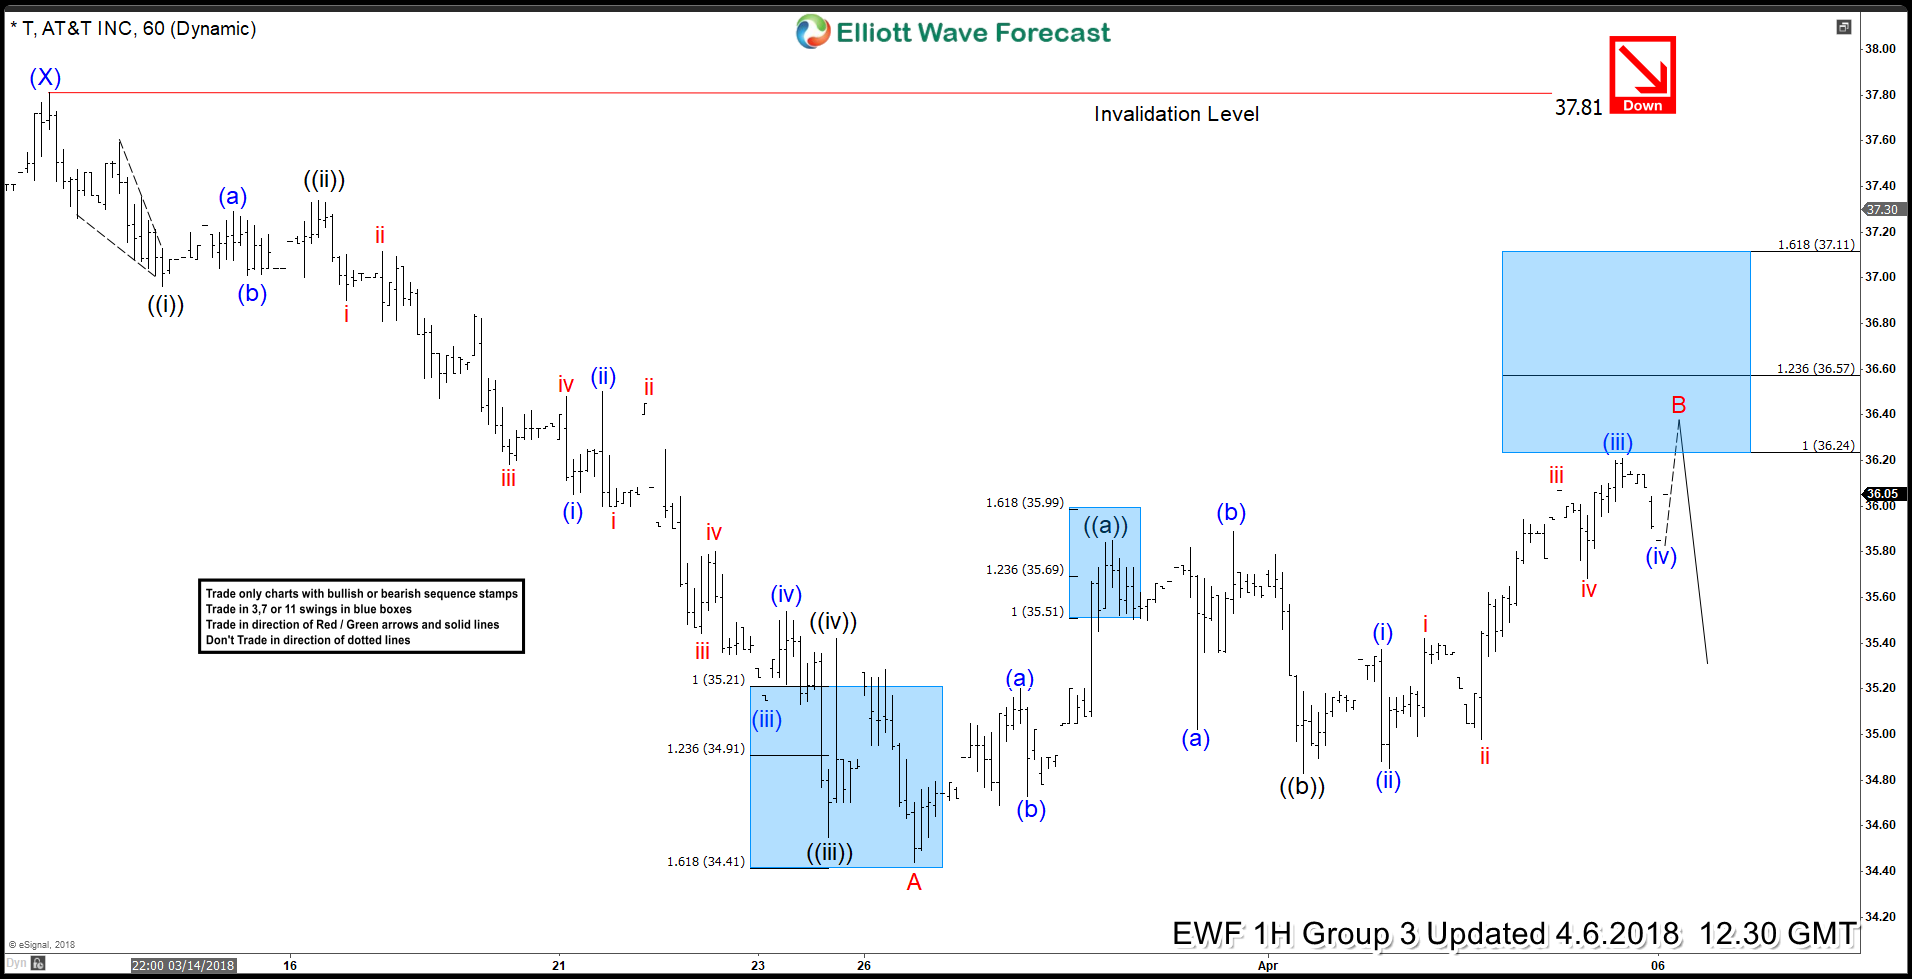
AT&T Elliott Wave View: Calling Bounces to Fail
Read MoreAT&T ticker symbol: ($T) short-term AT&T Elliott Wave view suggests that the bounce to 3/13 high (37.81) ended Intermediate wave (X) bounce. Below from there, intermediate Y leg lower remains in progress as a Zigzag correction. Where initial decline unfolded in 5 waves Elliott Wave Impulse Sequence with extension in Minor wave A. Which can be seen in […]
-
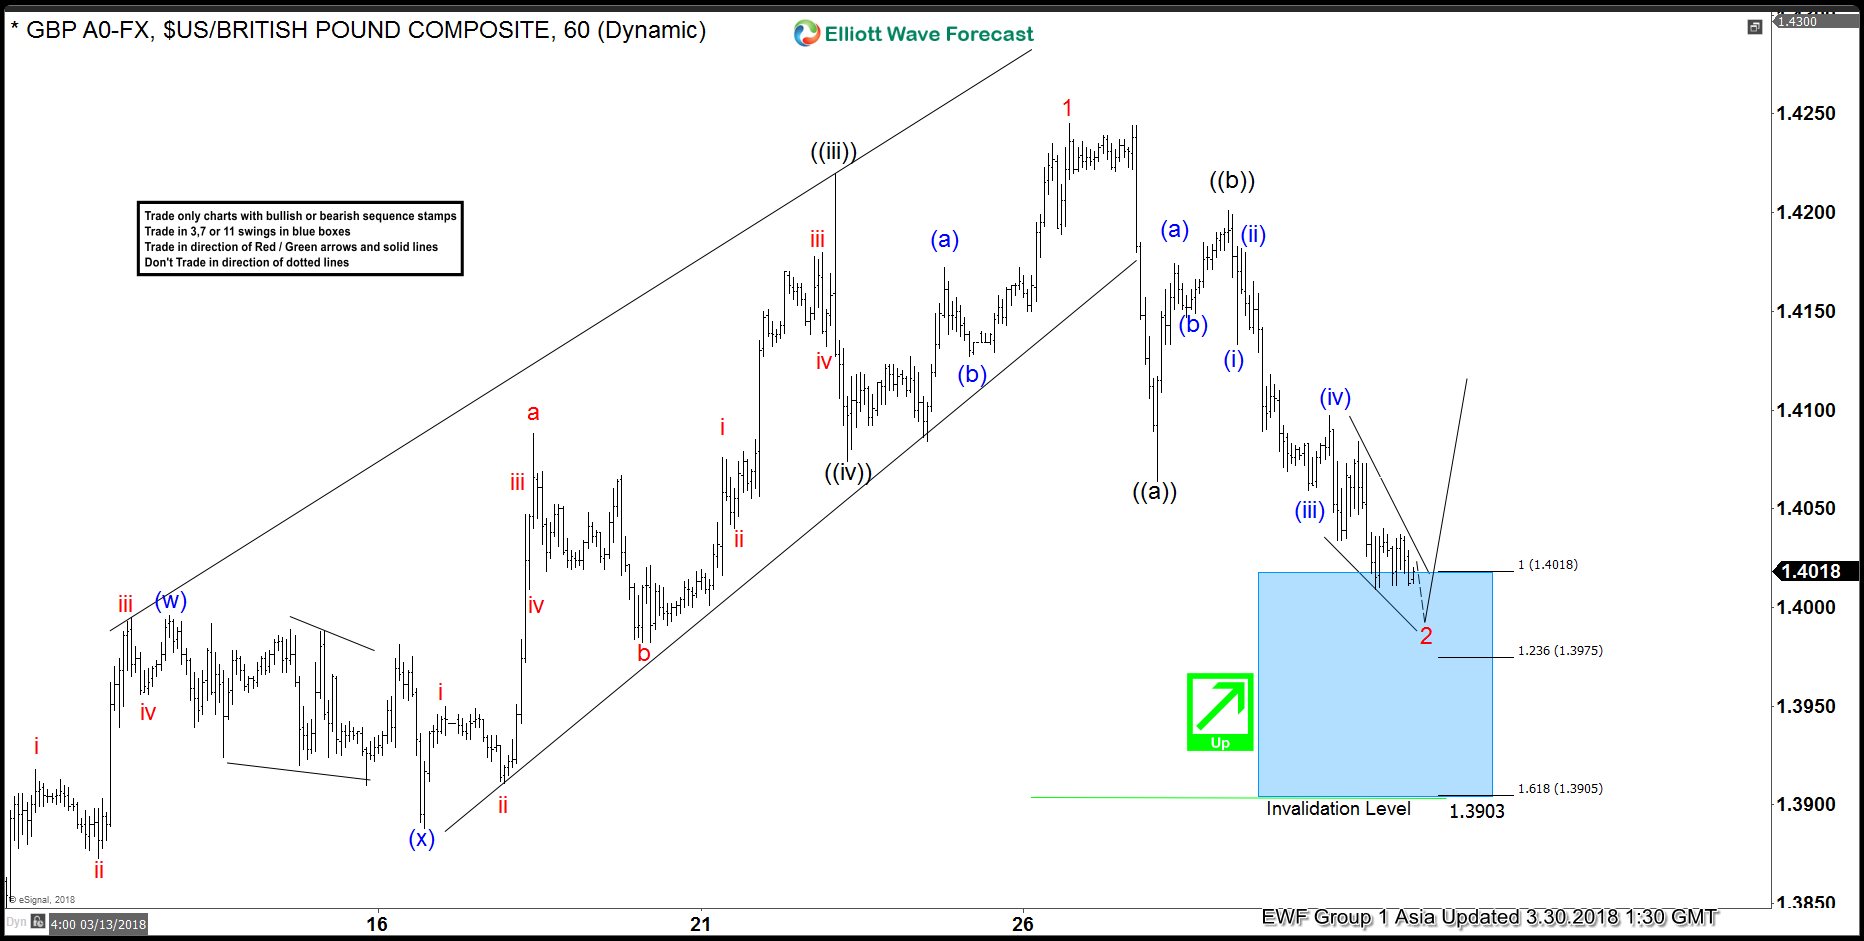
GBPUSD Elliott Wave View: Calling The Bounce Higher
Read MoreGBPUSD Elliott Wave short-term sequence from 3/01 low (1.3709) ended as a Leading Diagonal structure in Minor wave 1 at 1.4248 high in 5 waves. Down from there, the pair is correcting that cycle in Minor wave 2 pullback in 3, 7 or 11 swings before it resumes the upside. So far pair is showing […]
-
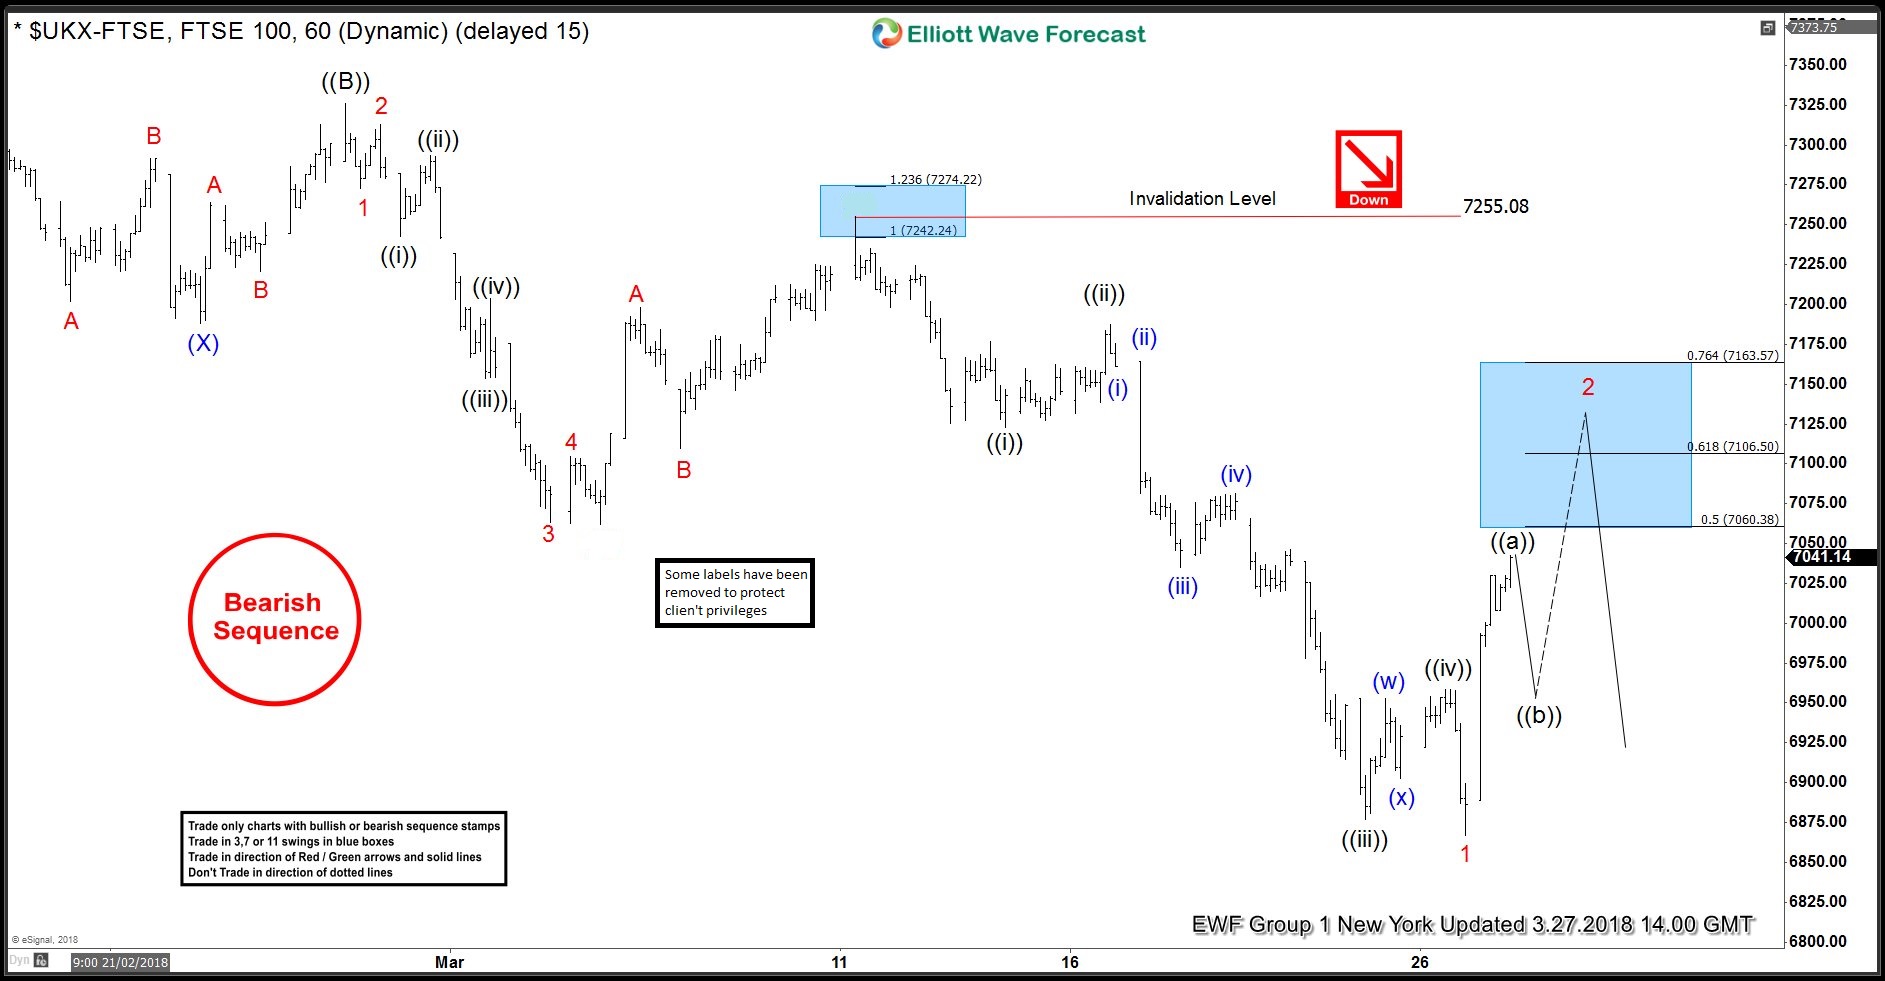
FTSE Elliott Wave View: Suggesting More Downside
Read MoreFTSE the index from UK, is correcting the larger degree cycle from February 2016 lows. While FTSE Elliott Wave Short-term price action suggests that the rally to February 27 high (7333.50) ended primary wave ((B)) bounce. Below from there, the decline is unfolding as a 5 waves Elliott Wave Impulse Sequence within primary ((C)) leg lower. Where each leg lower […]
-
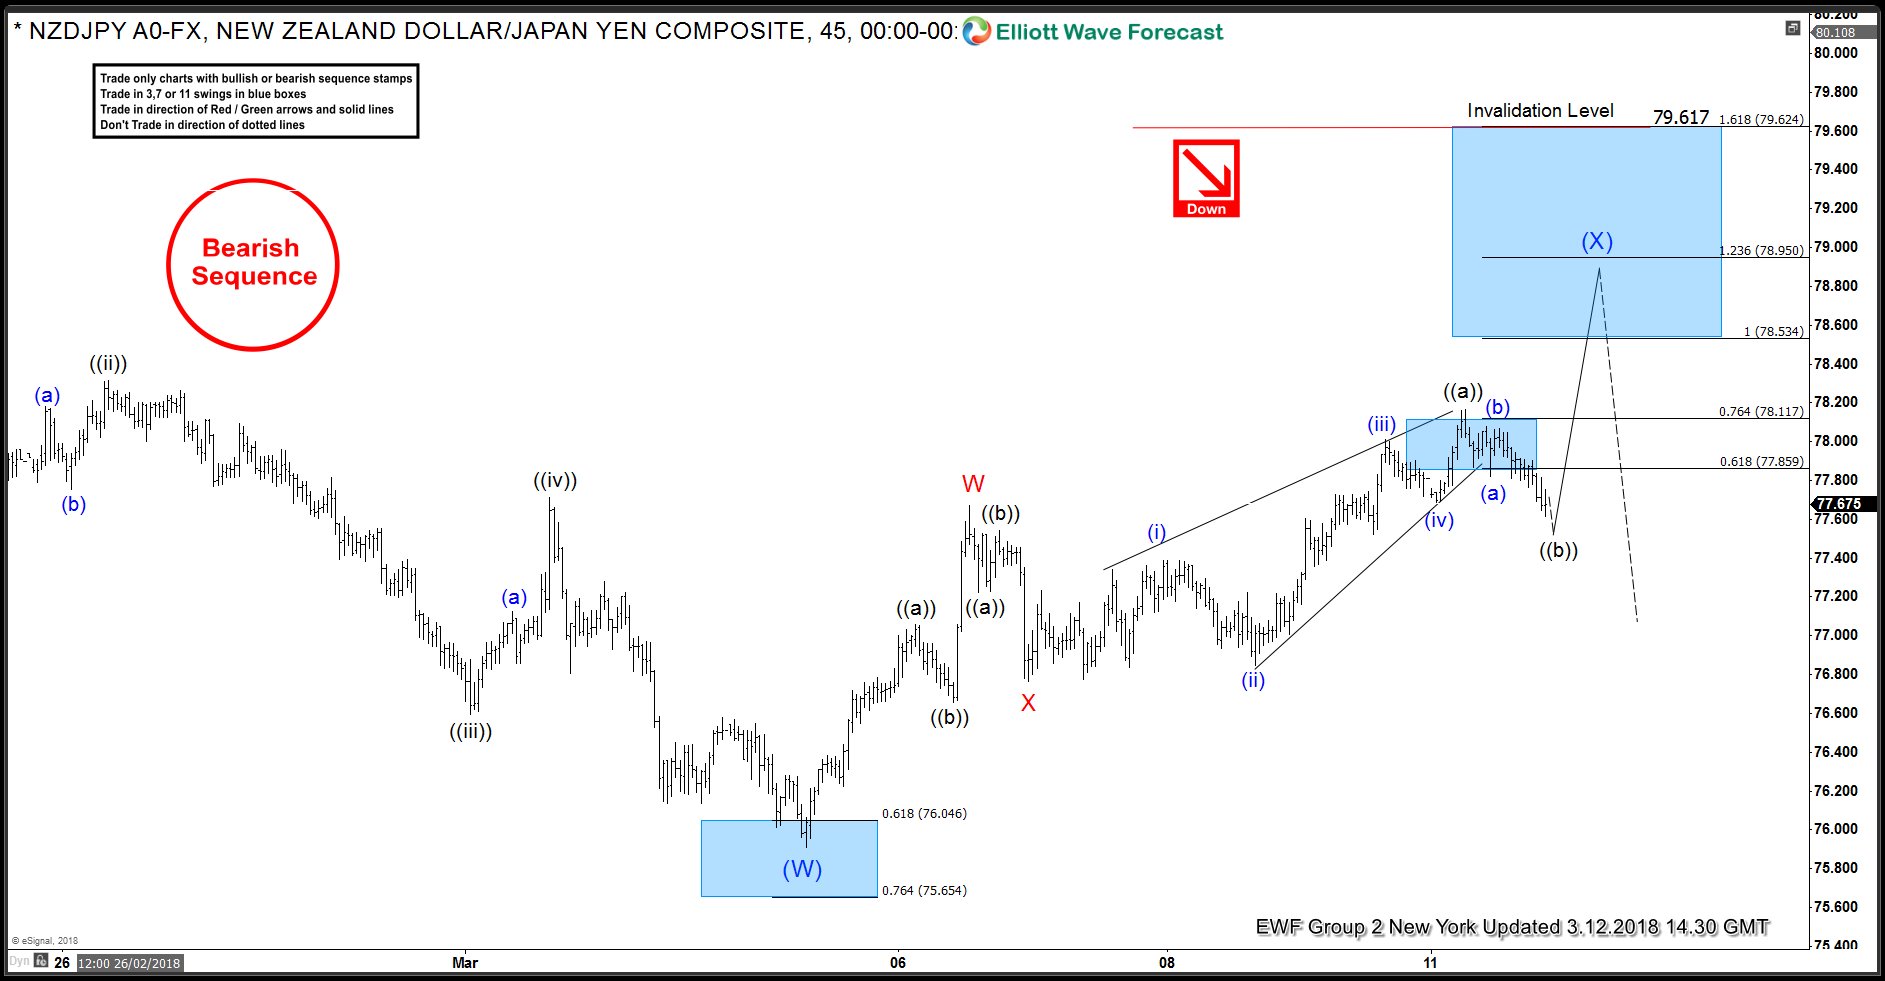
NZDJPY Selling the Elliott Wave bounces
Read MoreIn this Technical blog, we are going to take a quick look at the past Elliott Wave Chart performance of NZDJPY. Which we presented to our clients at elliottwave-forecast.com. We are going to explain the structure and the forecast. As our members know, we were pointing out that the sequence from July 27 2017 peak is incomplete to the downside. Therefore, we advised […]