
-
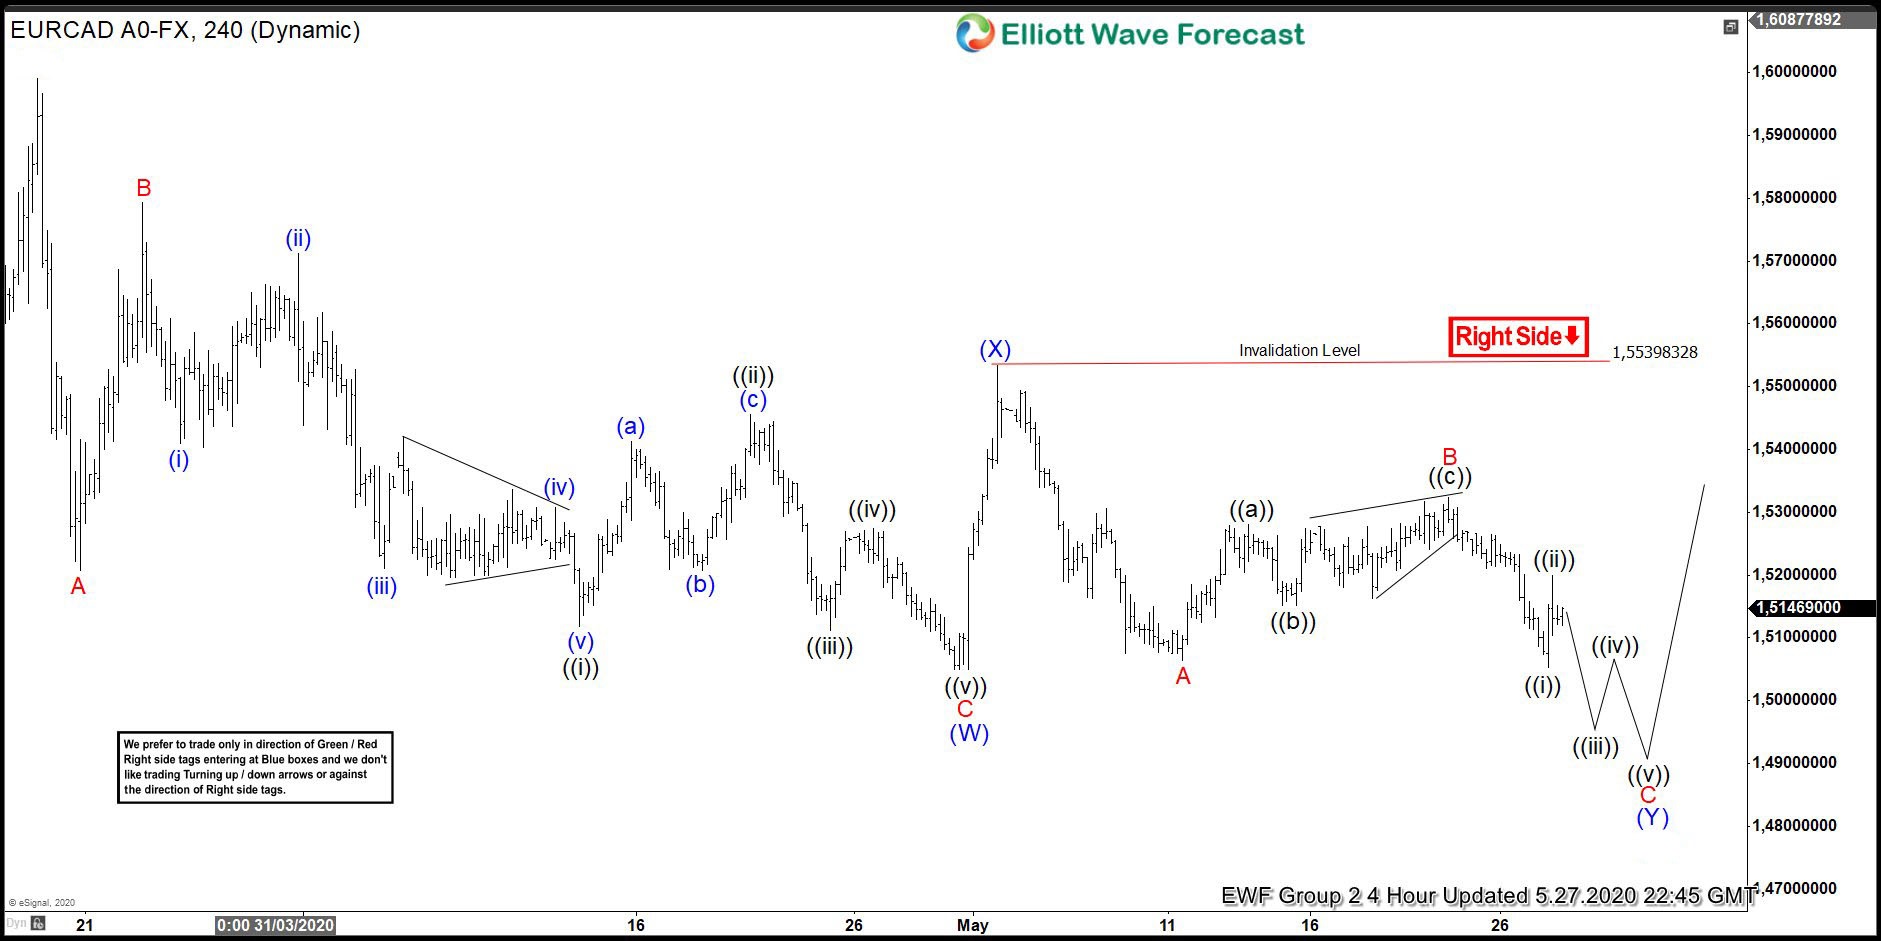
EURCAD Incomplete Bearish Sequence Pointing Lower
Read MoreIn this blog, we are going to take a look at the Elliott Wave chart of EURCAD. The 4 hour chart update from May 29 shows that the pair has continued to extend lower from March 19 peak. From March 19 peak, the pair extended lower in wave (W) as a zig-zag. Wave A ended […]
-
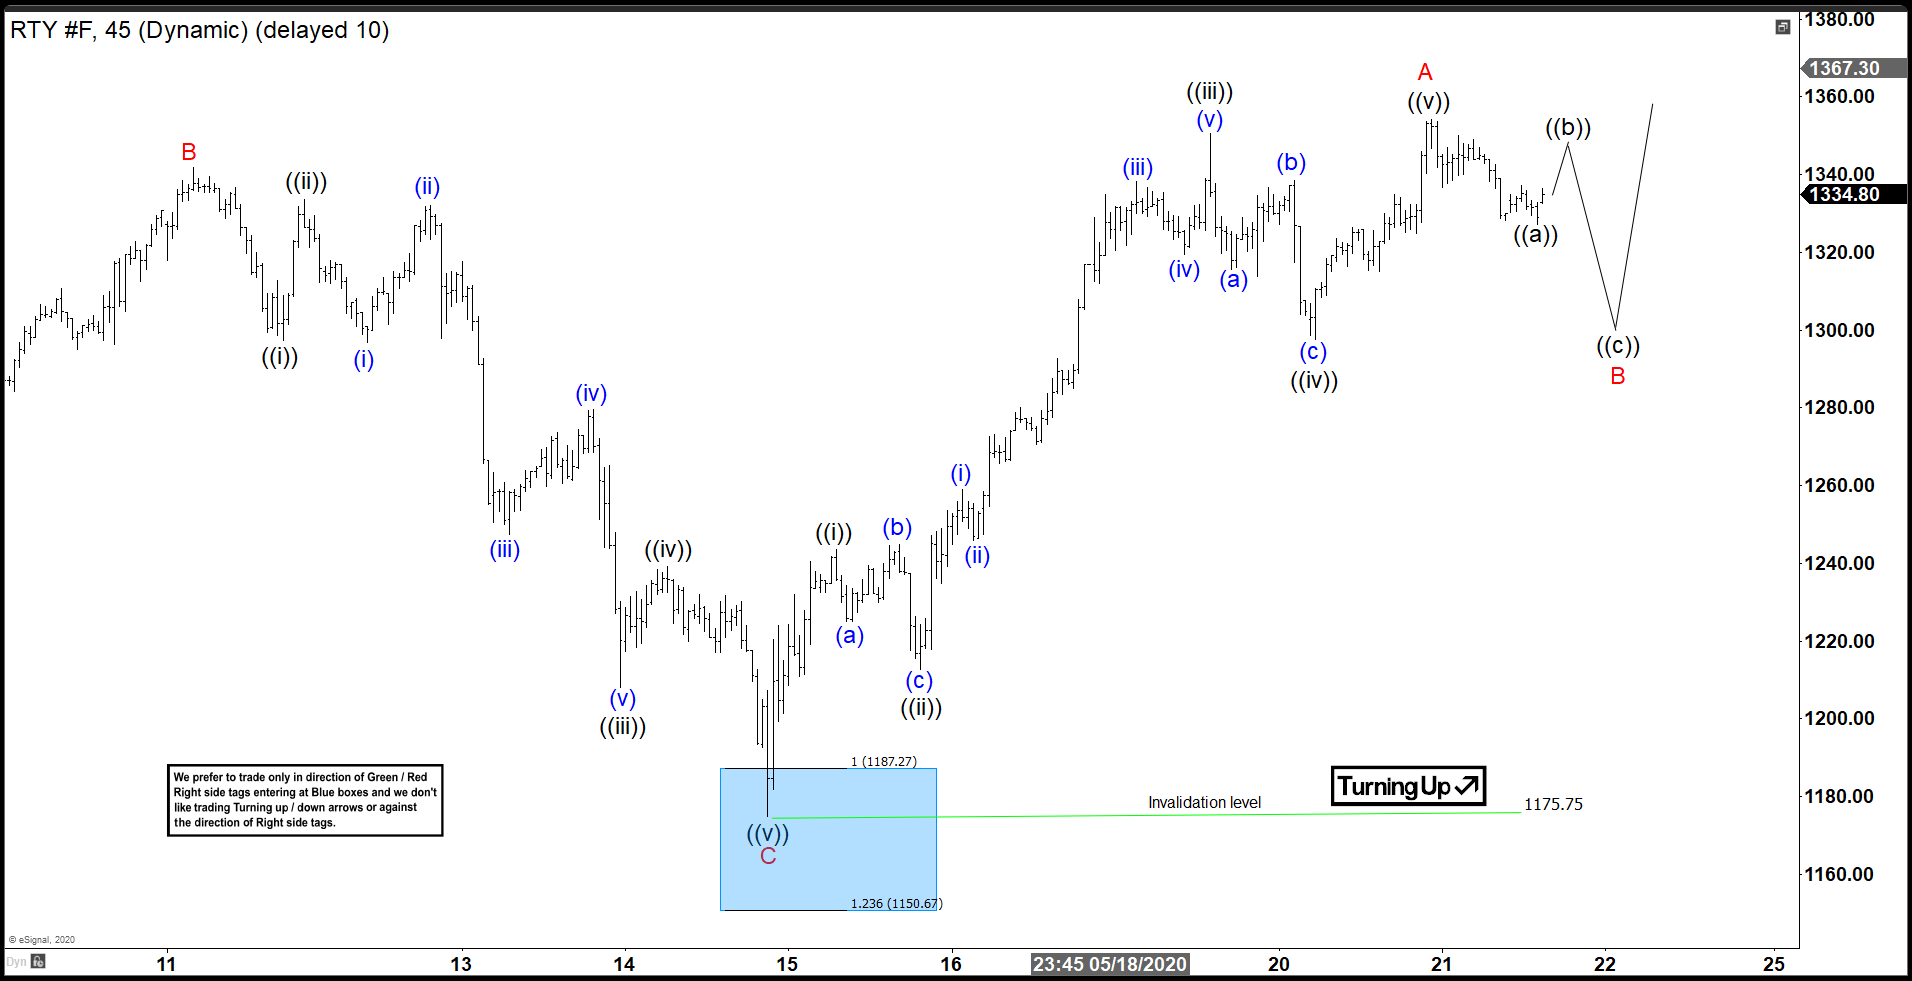
RTY_F (Russell 2000) Forecasting The Bounce From Blue Box
Read MoreIn this blog, we are going to take a look at the Elliott Wave chart of RTY_F (E-mini Russell 2000). The 1 hour NY Midday chart update shows that the cycle from April 29 peak is unfolding as a zig-zag pattern. Wave (A) ended at 1220.1 low and wave (B) bounce ended at 1341.7 high. […]
-
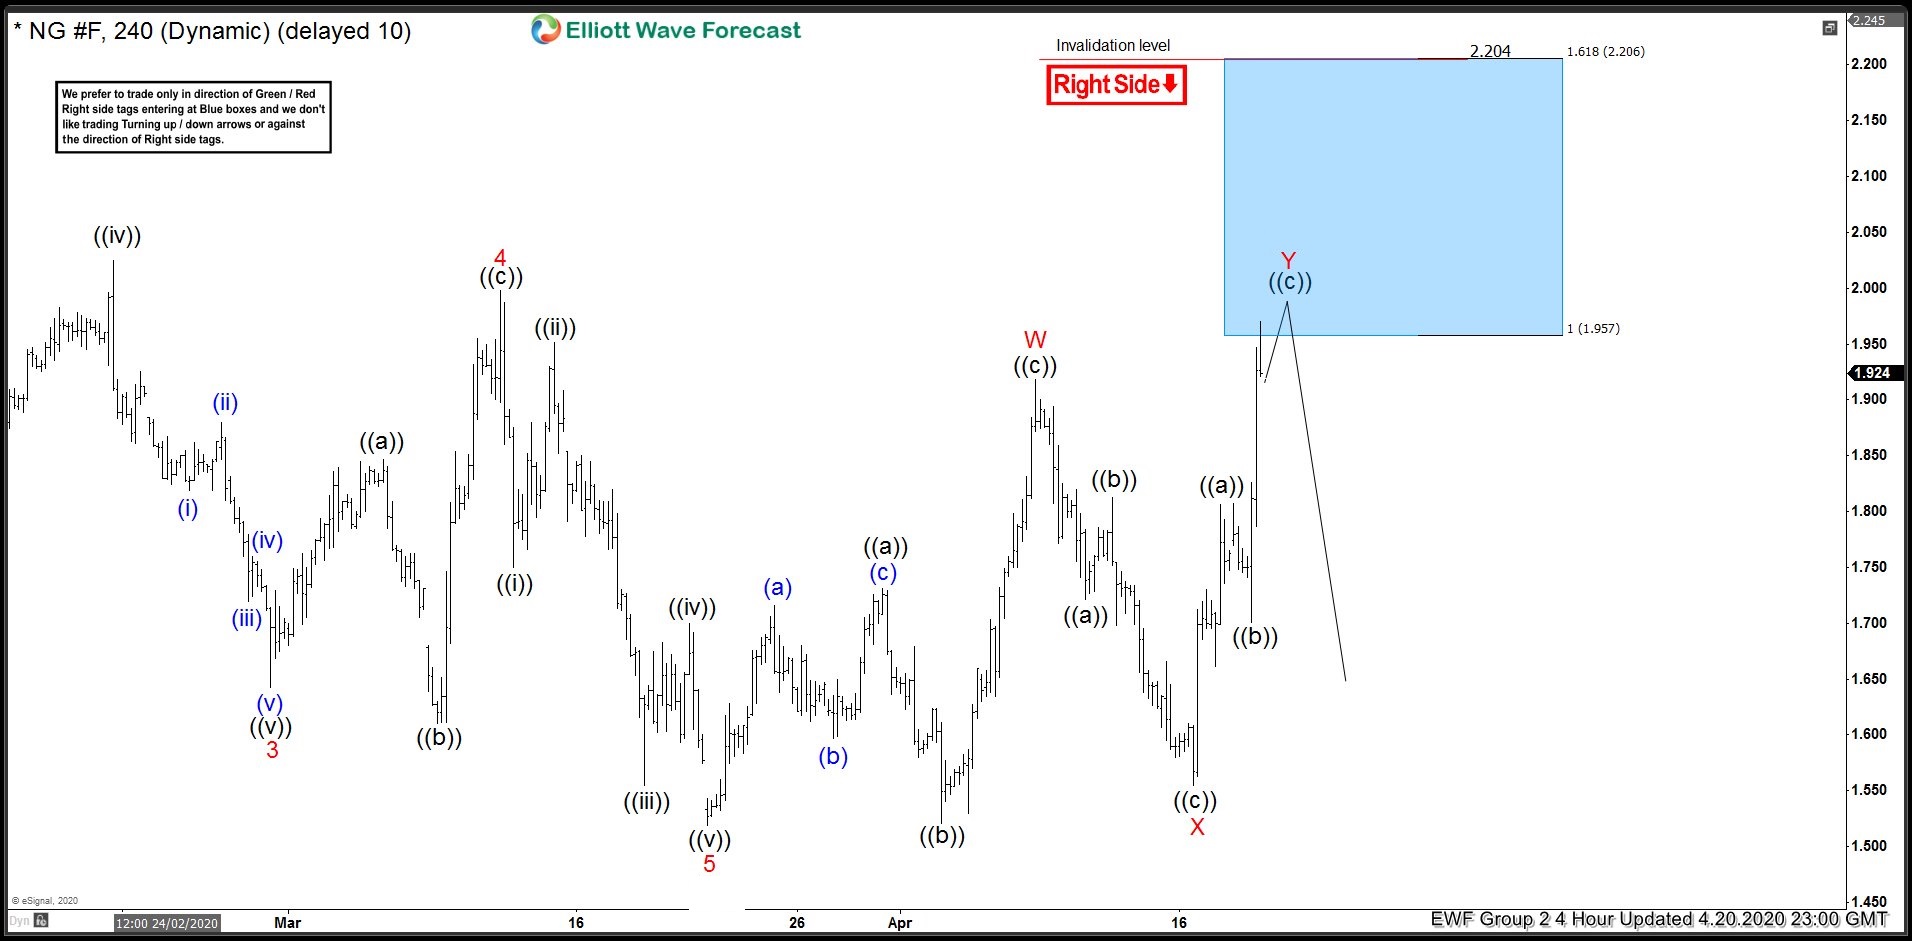
Natural Gas (NG_F) Reacted Lower From Blue Boxes
Read MoreIn this blog, we are going to take a look at the Elliott Wave chart of Natural Gas (NG_F). The 4 hour chart update from 20 April shows that cycle from May 11, 2019 high ended at 1.519 low. The commodity then bounced higher as a double three. Up from 1.519 low, Natural Gas ended […]
-
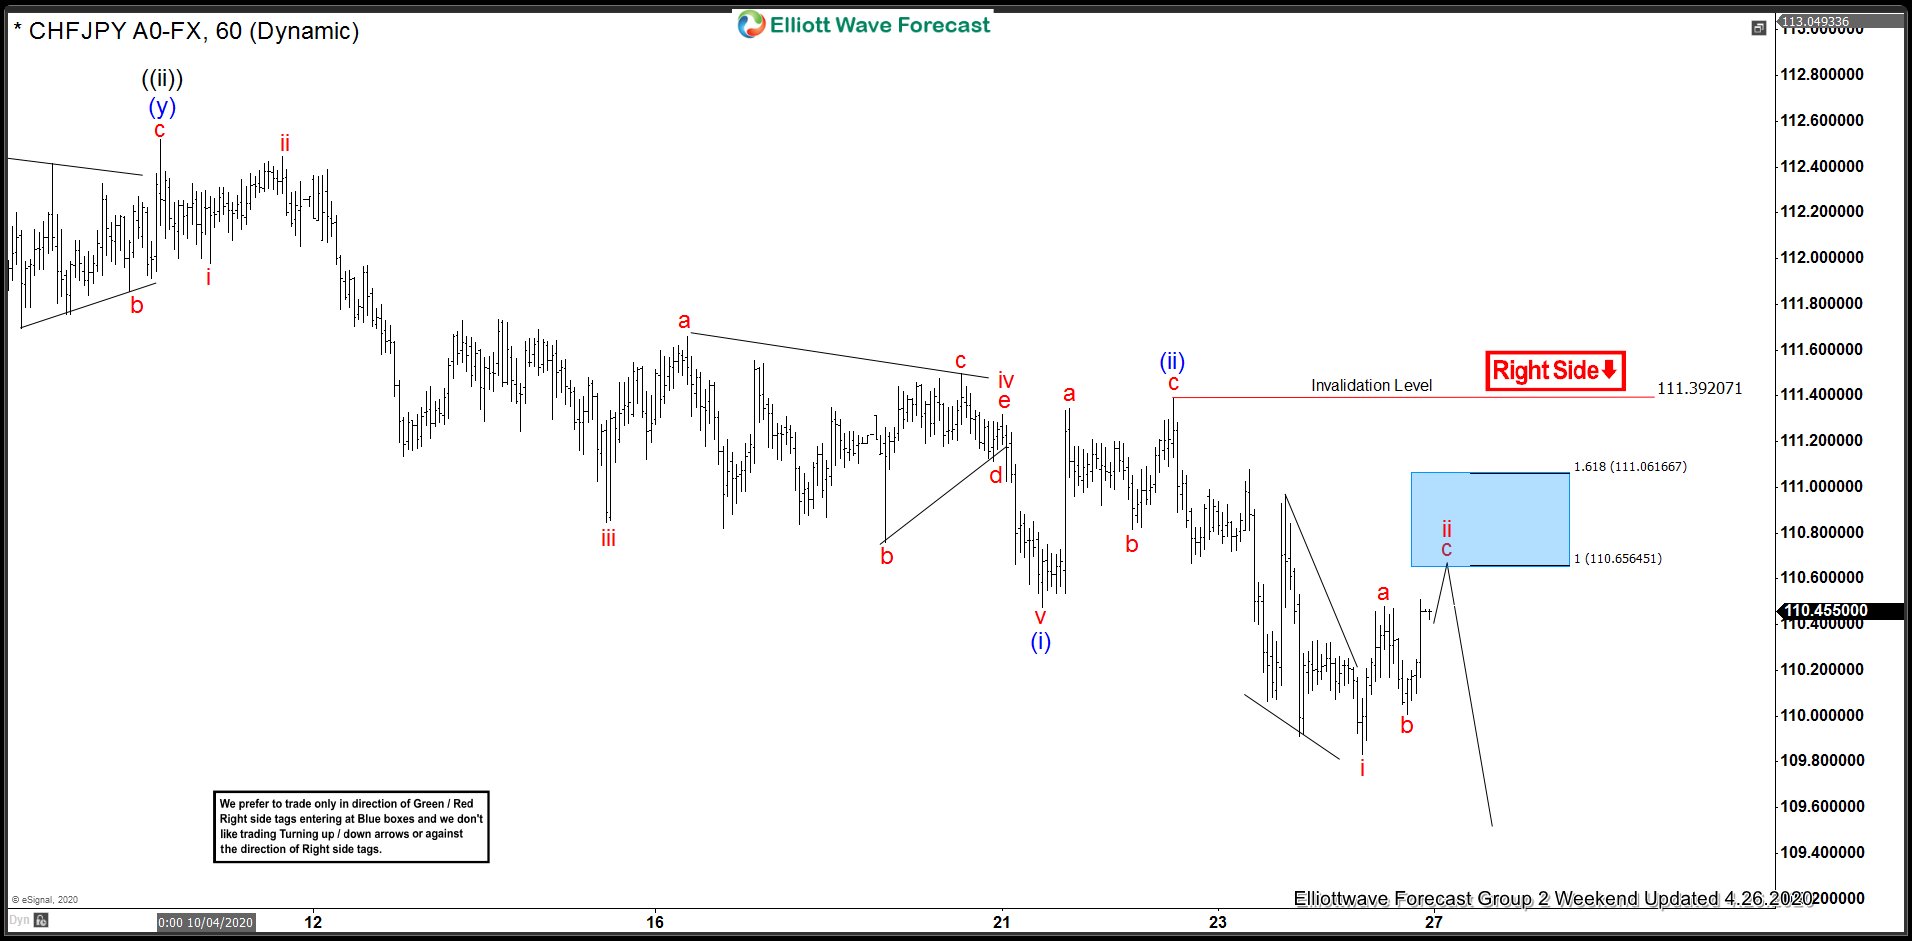
CHFJPY Sellers Appeared At Blue Box Area
Read MoreIn this blog, we are going to take a look at the Elliott Wave chart of CHFJPY. The 1 hour weekend chart update from 26 April shows that CHFJPY ended wave (ii) bounce at 111.39 high. From there, the pair extended lower and broke below previous wave (i) low. The decline ended at 109.83 low. […]
-
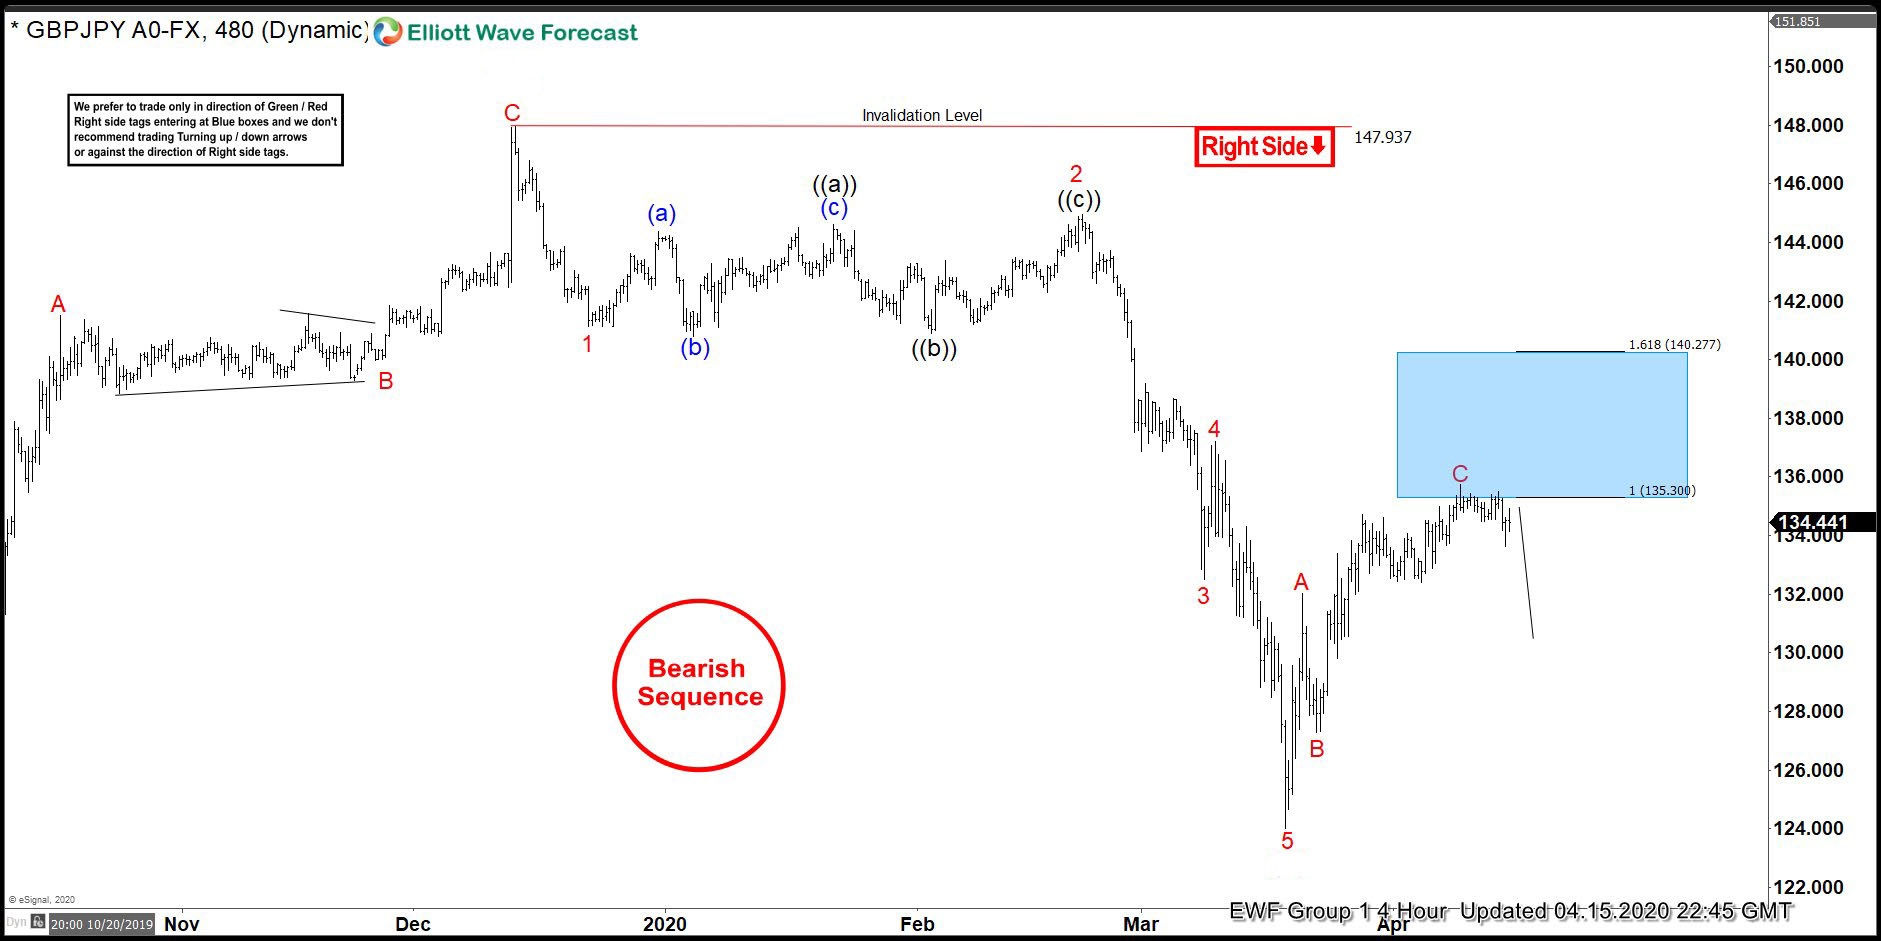
GBPJPY Found Sellers At The Blue Box Area
Read MoreIn this blog, we are going to take a look at the Elliottwave chart of GBPJPY. The 4 hour chart update below from 15 April shows that the cycle from December 12, 2019 high unfolded as 5 waves impulsive structure. Wave 1 ended at 141.14 low. The bounce in wave 2 as a flat correction […]
-
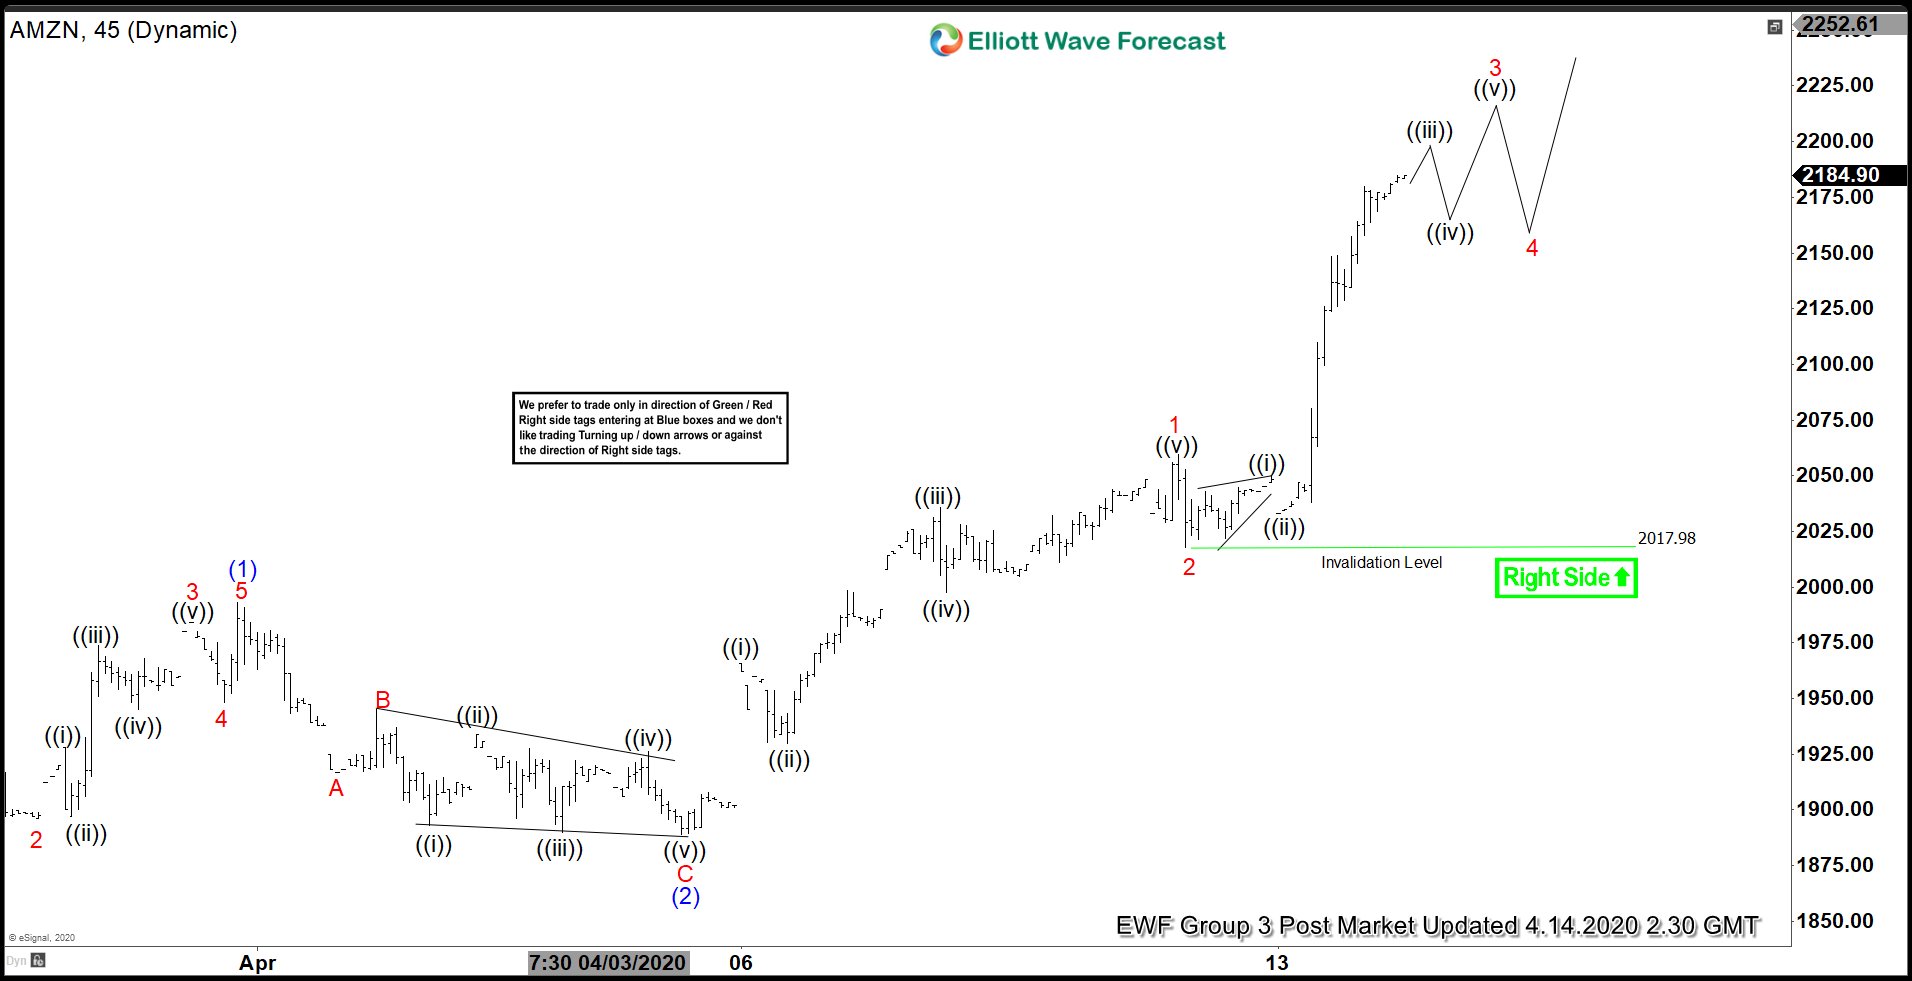
Elliott Wave View: Amazon (AMZN) Aiming for All-Time High
Read MoreAMZN continues to make higher high. While dips stay above April 9 low, expect Amazon to continue higher. This article & video look at the Elliottwave path..